Application Performance Monitoring
Intelligent observability for modern applications – contextually bring together traces, metrics, and synthetics.
Smarter troubleshooting
Application resiliency
Empower collaboration
LM APM Key capabilities
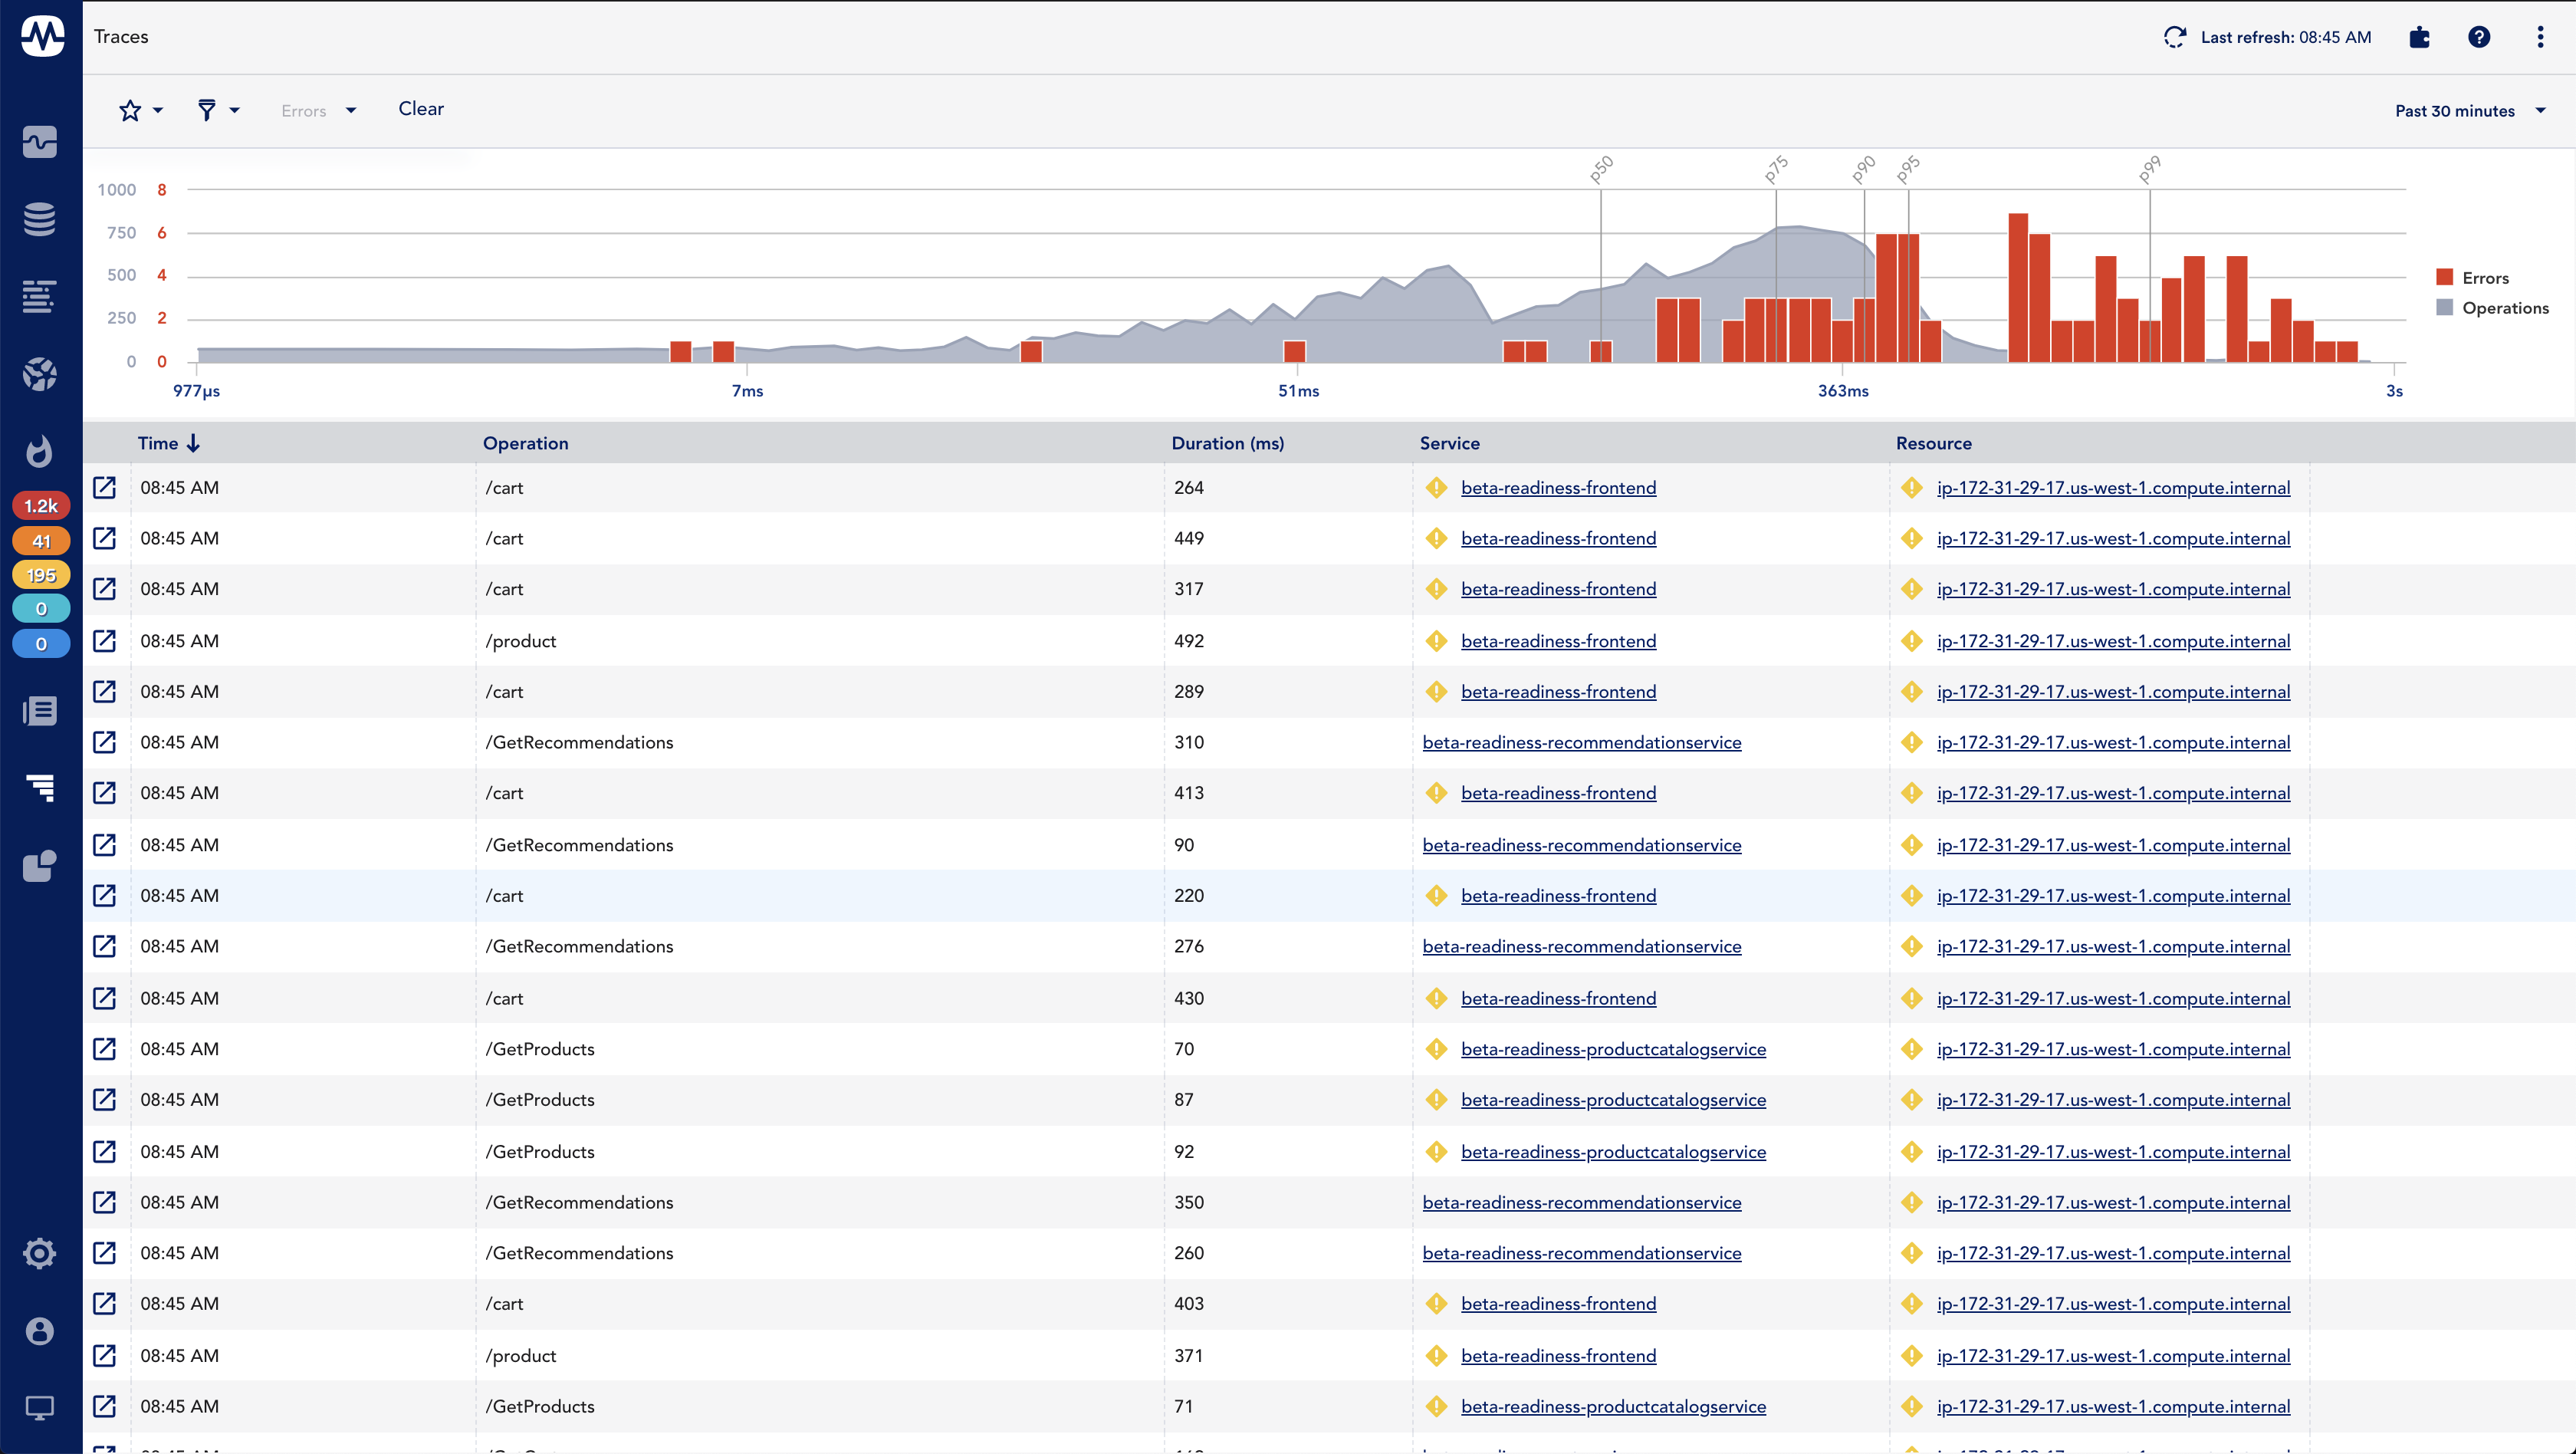
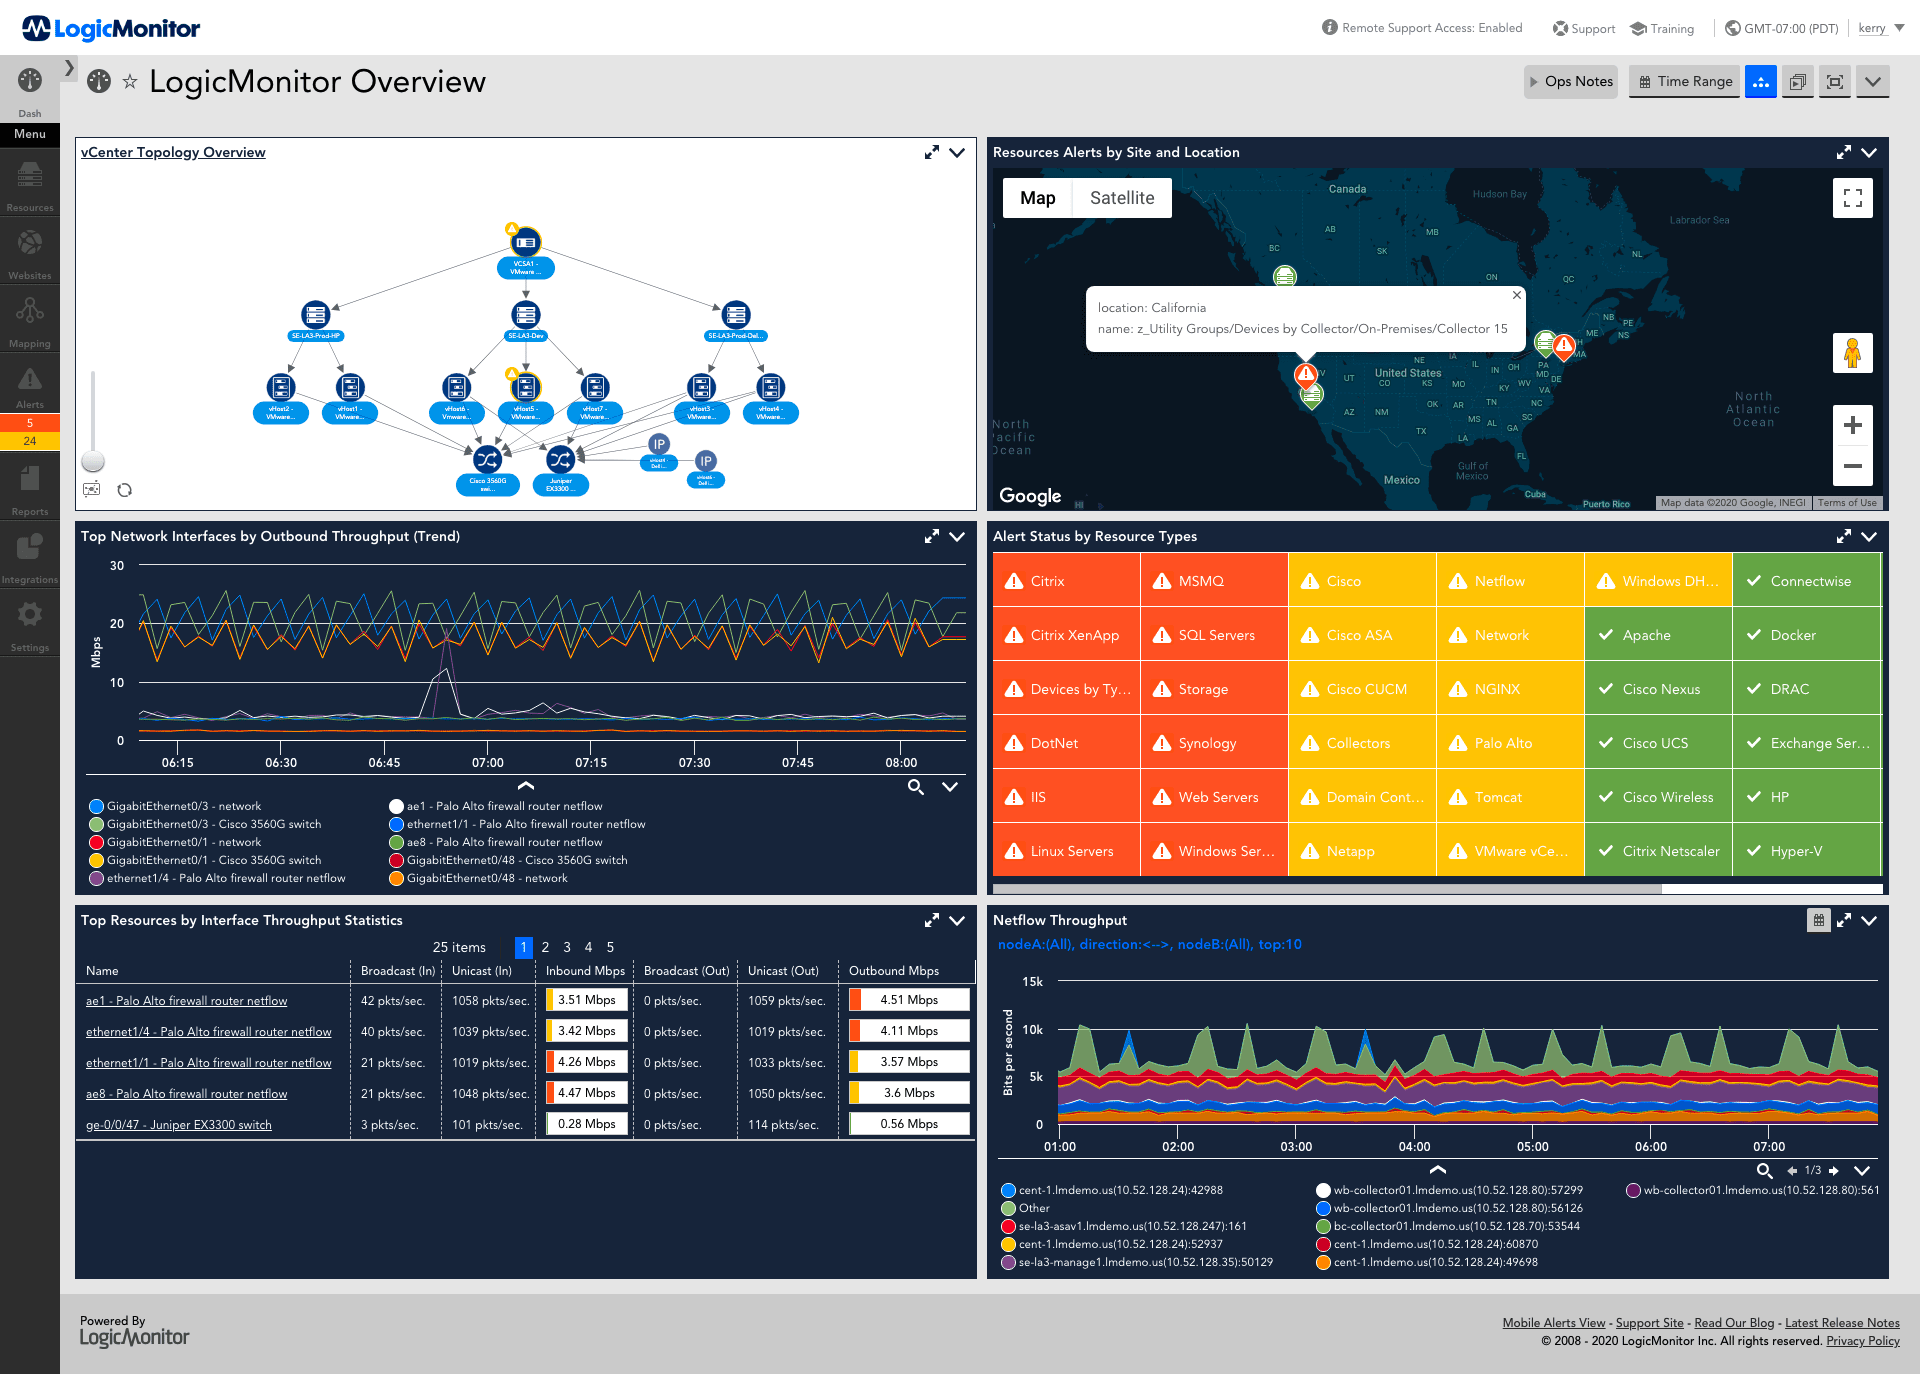
Robust Context
Distributed Tracing
Pinpoint underlying issues with traces through application and hybrid infrastructure.
OpenTelemetry integration monitors end-to-end application requests through distributed services in your environment. Auto-Instrumentation for Java, .Net, and Python captures traces directly for immediate visibility, while precise instrumentation for all languages allows full control over span data.
Build troubleshooting workflows from alerts to traces to identify bottlenecks and pinpoint root-causes. Review associated span tags and logs for additional context.
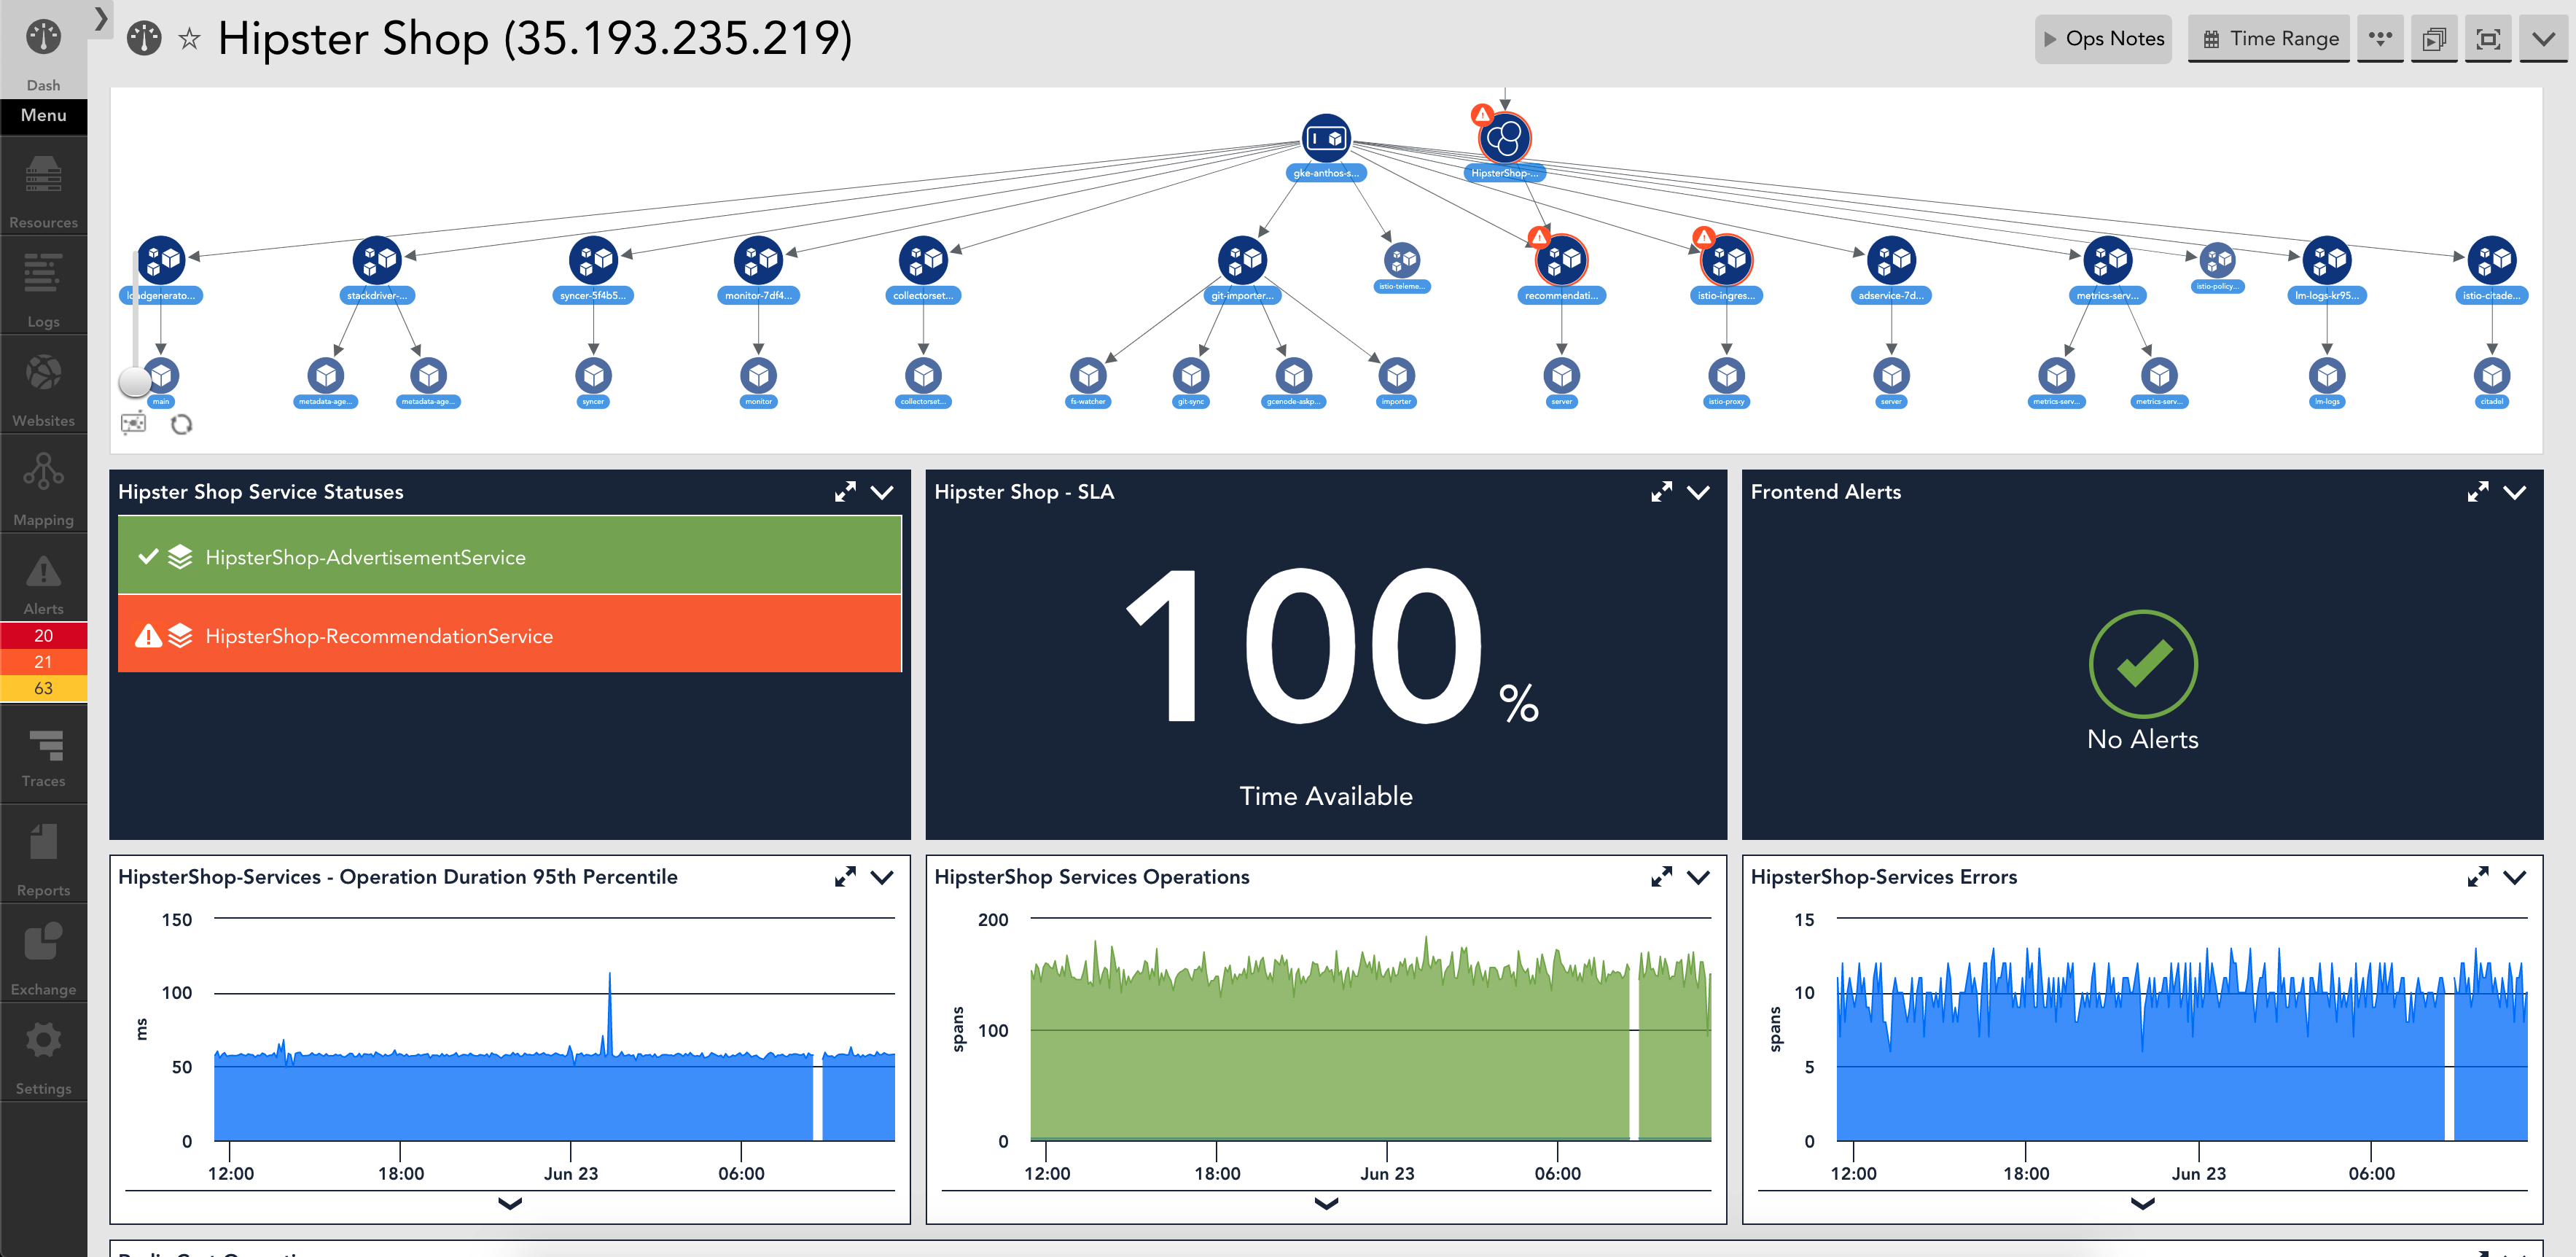
Visualize business outcomes
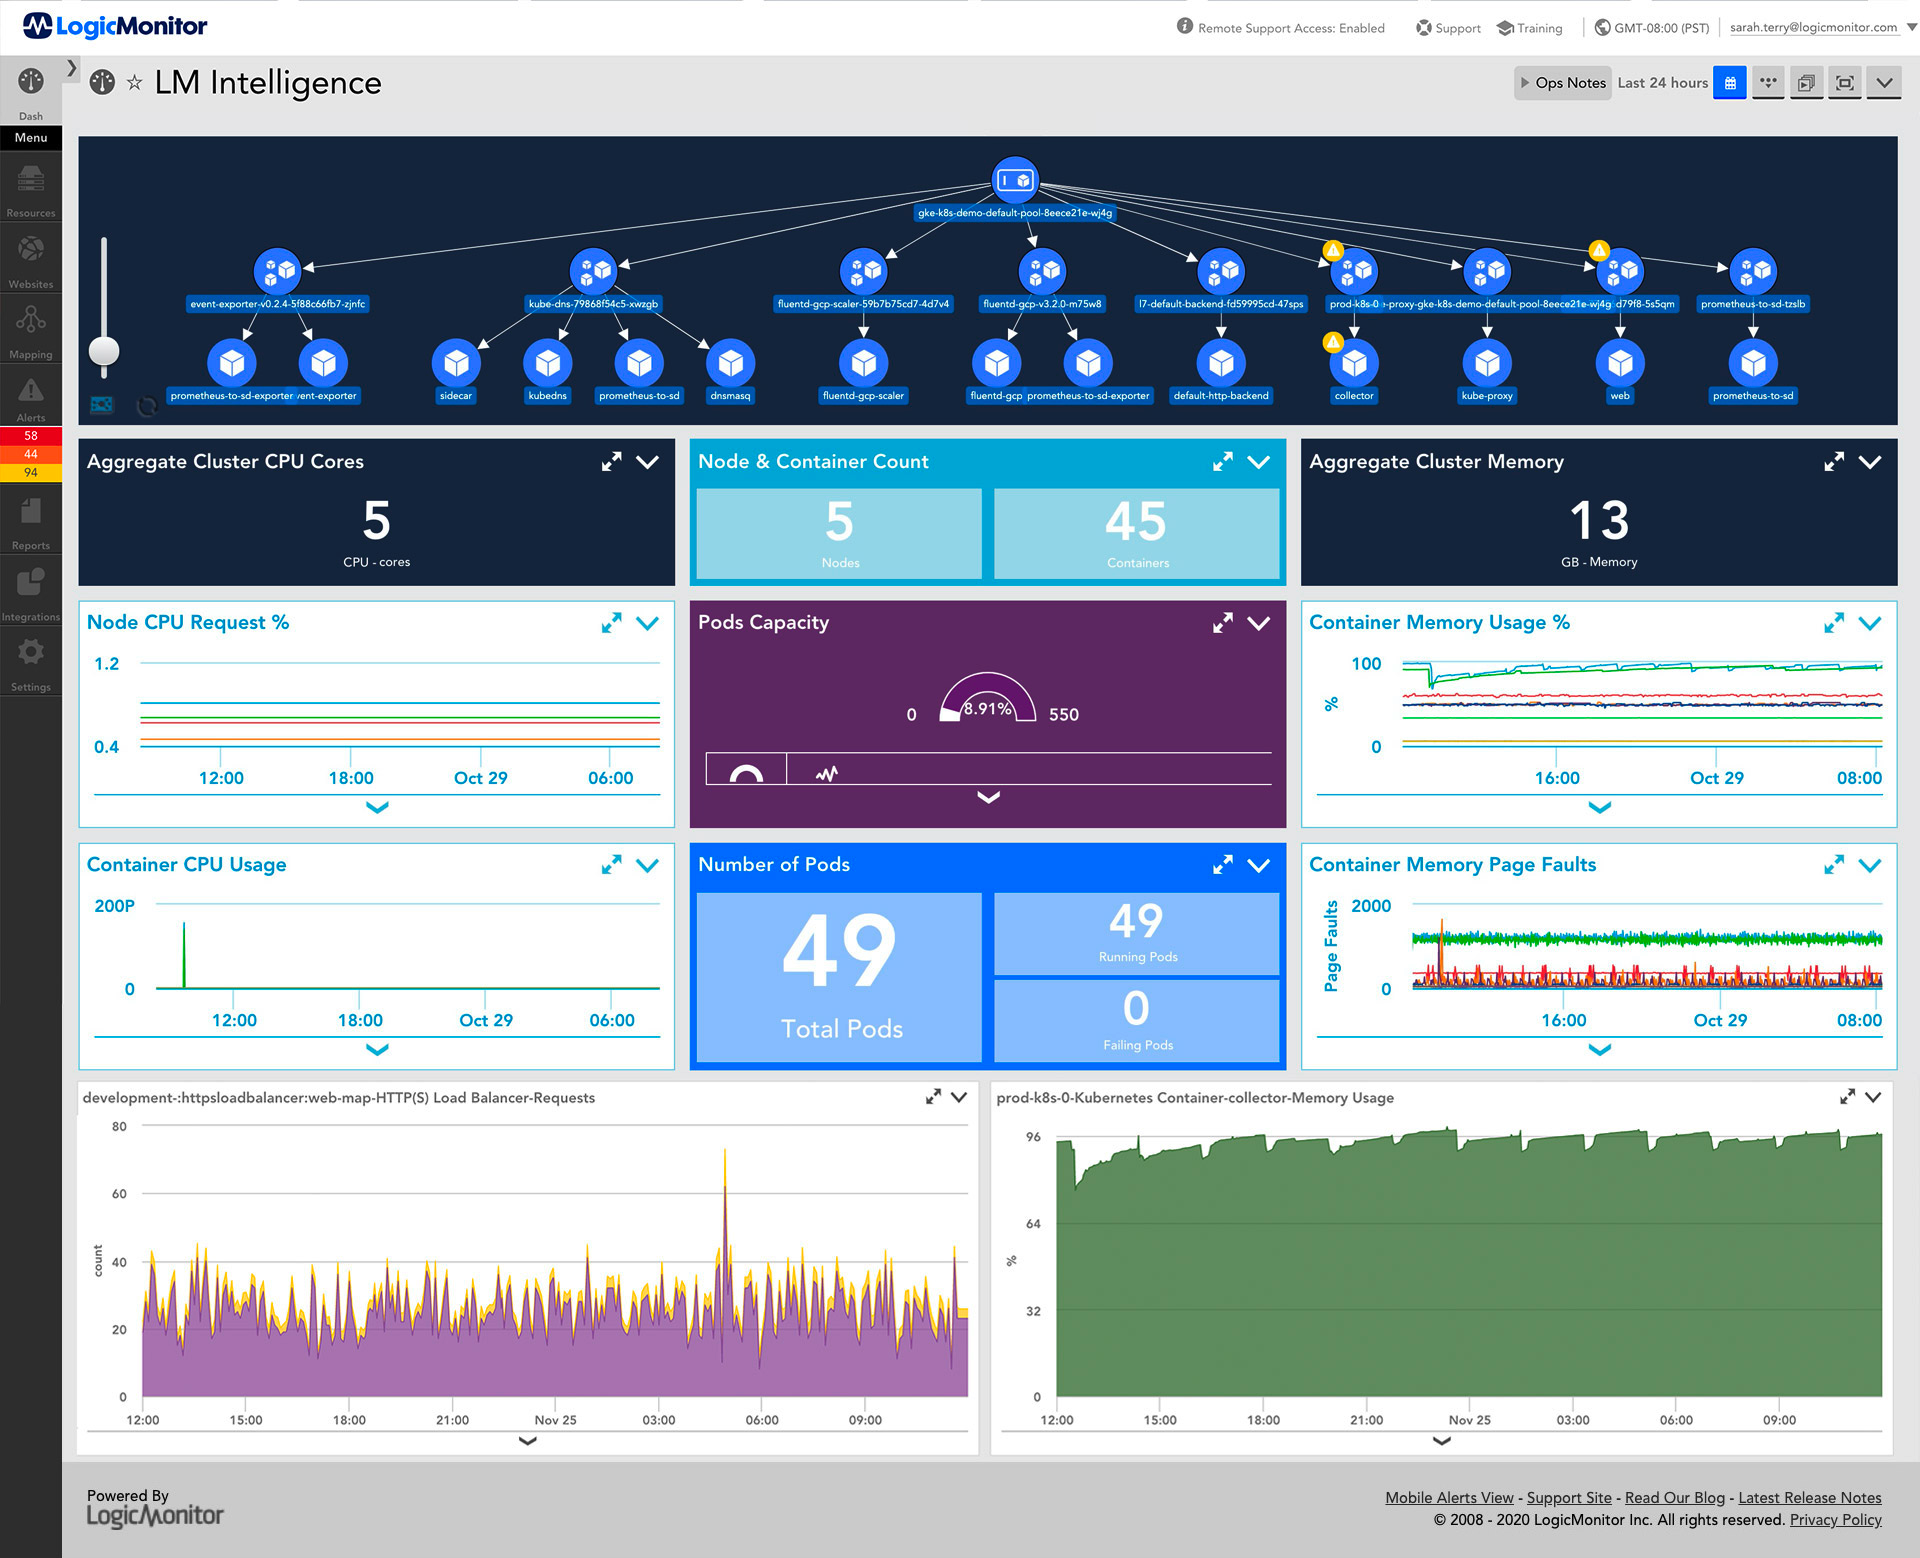
Performance Metrics
Monitor application performance metrics and graph everything from high-level KPIs to granular technical metrics. Visualize any application performance metric against business outcomes and customer experience metrics in a single platform.
Easily import custom time-series data to create application performance metrics via multiple formats:
- Send data from any source directly via PushMetrics API to LogicMonitor to visualize application health alongside existing dashboards
- Import metrics directly from any Open Metrics endpoint (including Prometheus exposition format) without scripts

Critical path coverage
Synthetic Monitoring
Simulate end-user traffic by recording automated browser tests of user interaction or transactions and uploading for monitoring to appear alongside other LM devices. Synthetics give early insight into the quality of the end user experience by reporting metrics on availability and latency.
Monitor and alert on website performance and site availability to ensure customers have the same digital experience across all geographies and browsers. MFA support ensures critical paths are covered in modern applications.
FAQ
- Application Performance Monitoring v. Application Performance Management
Often used interchangeably, but one distinction is that Application Performance Monitoring typically refers to having the capability to see the data and metrics behind various components of your application and Application Performance Management refers to the practice and process of actively making decisions and changes based on data that you are observing within your application.
- What is OpenTelemetry?
OpenTelemetry is an open source and vendor neutral, Cloud Native Computing Foundation (CNCF) project for standardizing how trace data is generated and formatted. LogicMonitor is integrating with OpenTelemetry so you can use the extensive collection of OpenTelemetry client libraries to instrument your application, without any proprietary formatting.
- What is OpenMetrics?
Born out of the Prometheus exposition format, OpenMetrics is an open source and vendor neutral Cloud Native Computing Foundation (CNCF) project for standardizing how metrics data is captured and emitted. LM users can send OpenMetrics-formatted data into LogicMonitor and associate those metrics with traces, logs, and other monitored resources.
- What languages does LogicMonitor’s Application Performance Monitoring support?
Because LogicMonitor has a full integration with OpenTelemetry, all of the languages and libraries supported by OpenTelemetry will be available in LogicMonitor out-of-the-box. To see the most up-to-date list of languages supported by OpenTelemetry, click here: opentelemetry.io/docs
- What are synthetics?
Synthetics are simulated transactions that are intended to mimic an end user’s experience with your website or application. LogicMonitor users can record multi-step, authenticated or un-authenticated scripts and upload them to LogicMonitor to use for alerting and monitoring over time.
- Can I monitor cloud-based applications?
Yes, LogicMonitor can monitor any of your applications hosted on any cloud provider.
- What is Application Performance Monitoring?
Application Monitoring (APM) refers to tracking user experience, application latency, and identifying bottlenecks within your application to resolve issues.
- What is the difference between Application Monitoring and Application Performance Monitoring?
Application Monitoring and Application Performance Monitoring (APM) are typically used interchangeably, but Application Monitoring can sometimes be used to refer to a broader set of monitoring capabilities like error monitoring or availability monitoring.
- How does LogicMonitor collect Application Performance Monitoring data?
LogicMonitor has a wrapped version of the OpenTelemetry Collector that users can stand up to receive traces from their application. Once the collector is stood up, users can instrument their applications to automatically capture trace data and forward that data into LogicMonitor.
- Does LogicMonitor connect infrastructure and application data together?
Trace data that is collected will be automatically mapped to resources that you are already monitoring with LogicMonitor and new resources will be created if they do not exist. This way, users will be able to correlate application and infrastructure data in the same view and create a single pane of glass for faster troubleshooting and resolution.
Watch a demo to see Application Performance Monitoring in action
More Resources

application performance monitoring / 08.03.23
Using UX and Observability to Track Application Health
Learn More