
From infrastructure to applications
Hybrid Observability Powered by AI
Proactively improve IT and prevent issues with SaaS-based automated monitoring that deploys in minutes with advanced features for infrastructure, applications and business services.
Less remediation, more innovation.
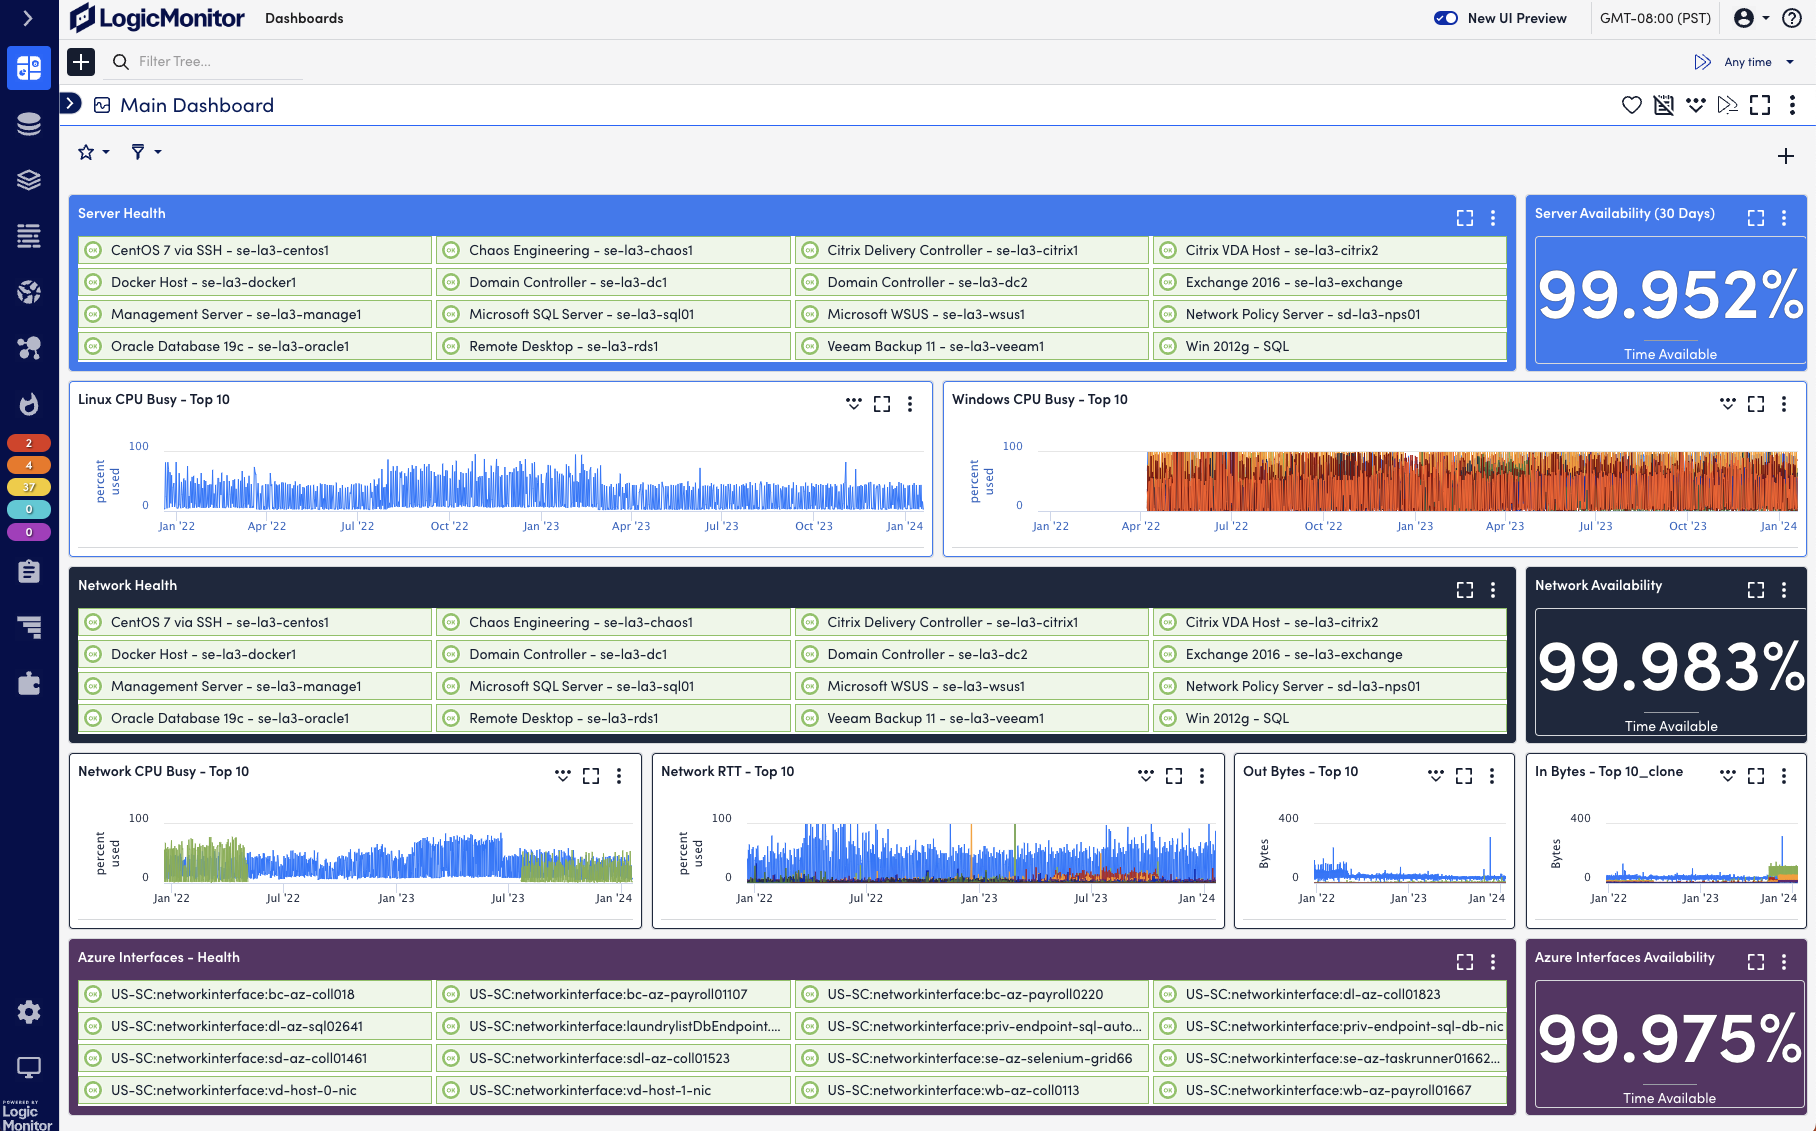
LM Envision platform
LM Envision platform
Why LogicMonitor
Eliminate complexity with one unified platform
90%
less alert noise
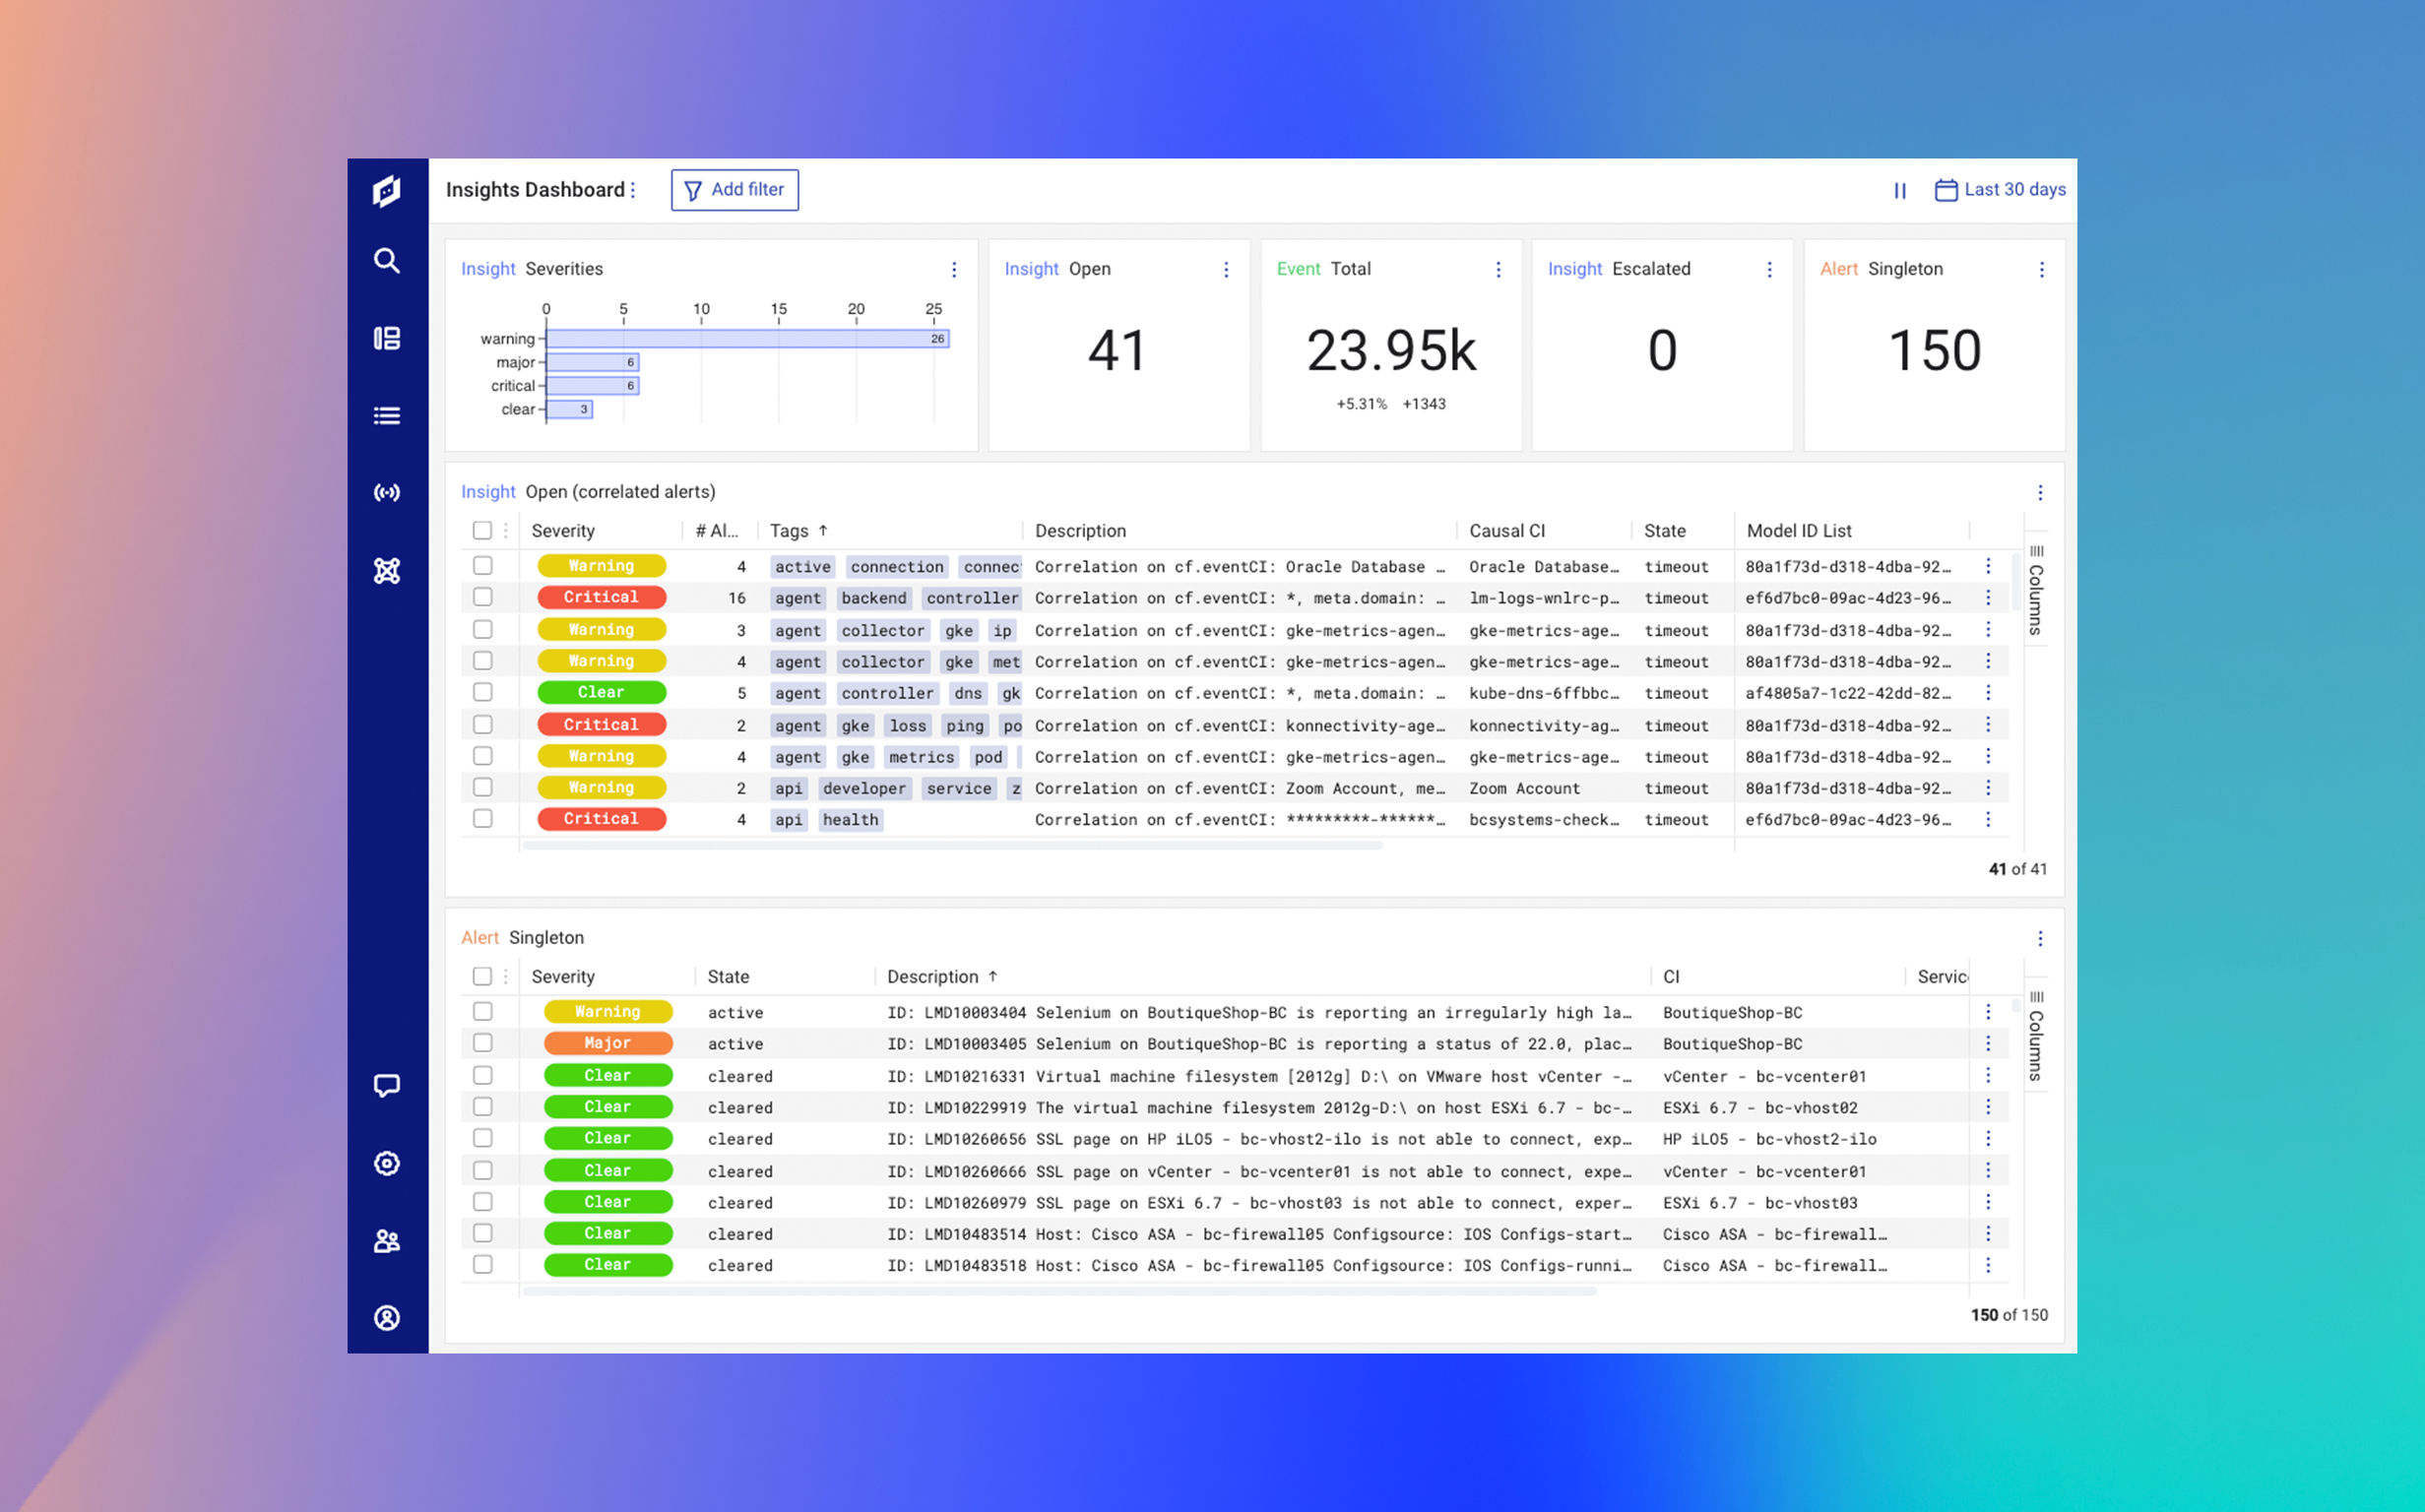
See only what you need, right when you need it. Immediate actionable alerts with our dynamic topology and out-of-the-box AIOps capabilities.
AIOPs46%
reduced MTTR
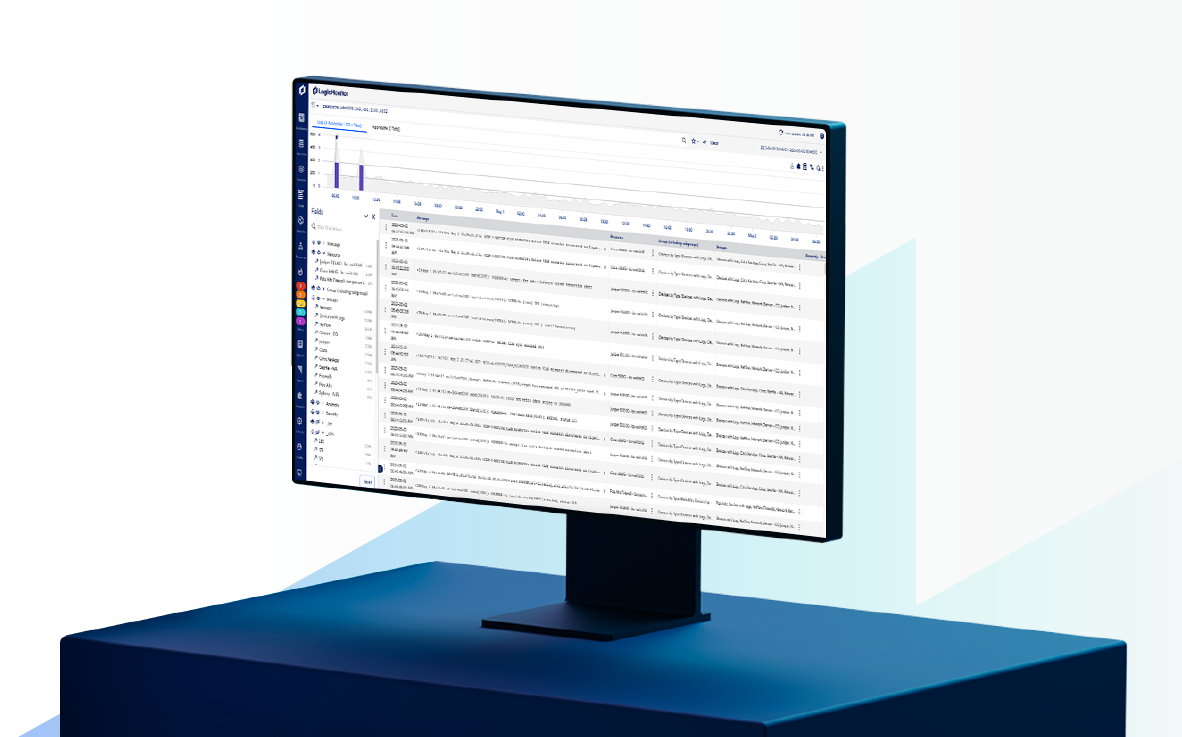
Real-time alerts without noise. Seamless pivoting between monitoring and investigation with unified data including integrated logs.
Reduce MTTREasy
to deploy
Transform your monitoring in minutes, not months. Automatic support, discovery, and dashboards for over 2000 types of infrastructure and applications.
Automation2000+
integrations
We’ve built more monitoring integrations than anyone else, so you can integrate instantly with the devices, technologies, and services your business relies on.
Integrations
Our Trust Scores
Not just a platform. A true partner.


Rating from Gartner Peer Insights and Customer Satisfaction leader on G2
4.5/5
Rated “Excellent” and an “Editor’s Choice” by PCMag
Excellent
The highest NetPromoter score of any IT Infrastructure Management provider
Highest
Innovate faster while improving efficiency
With LM Envision, you no longer have to balance risk with speed. We empower IT that allows organizations to innovate faster, knowing they can quickly identify signals that indicate problems even in production. Expensive performance bottlenecks are identified early, so customer experience is improved while compute requirements – and operations expenses – are reduced.
Trusted by leading companies


How Coca-Cola Bottling Consolidated have revolutionized their IT infrastructure


Schneider Electric consolidates monitoring tools by 83% with LogicMonitor


Carrier Partners with LogicMonitor in Path to Unified Observability
Sign up for your 14-day trial
Try LogicMonitor for free, or get in touch with an expert for a custom demo of the platform.