Network Monitoring

Monitor the health and performance of your entire network infrastructure in a single unified platform. Alleviate networking points of friction with increased visibility, and leverage network logs and metrics to speed up troubleshooting across all network and IT devices.

Supported brands include:

What is network monitoring?

Network monitoring provides the real-time information needed to determine the overall performance of a computer network. Network monitoring is the process of discovering, mapping, and measuring the data and performance within a computer network.The LogicMonitor platform provides solutions for network monitoring by identifying where network traffic originates, autodiscovering network devices, ingesting network syslog data to detect anomalies and anticipating problems.

Comprehensive visibility into your entire network

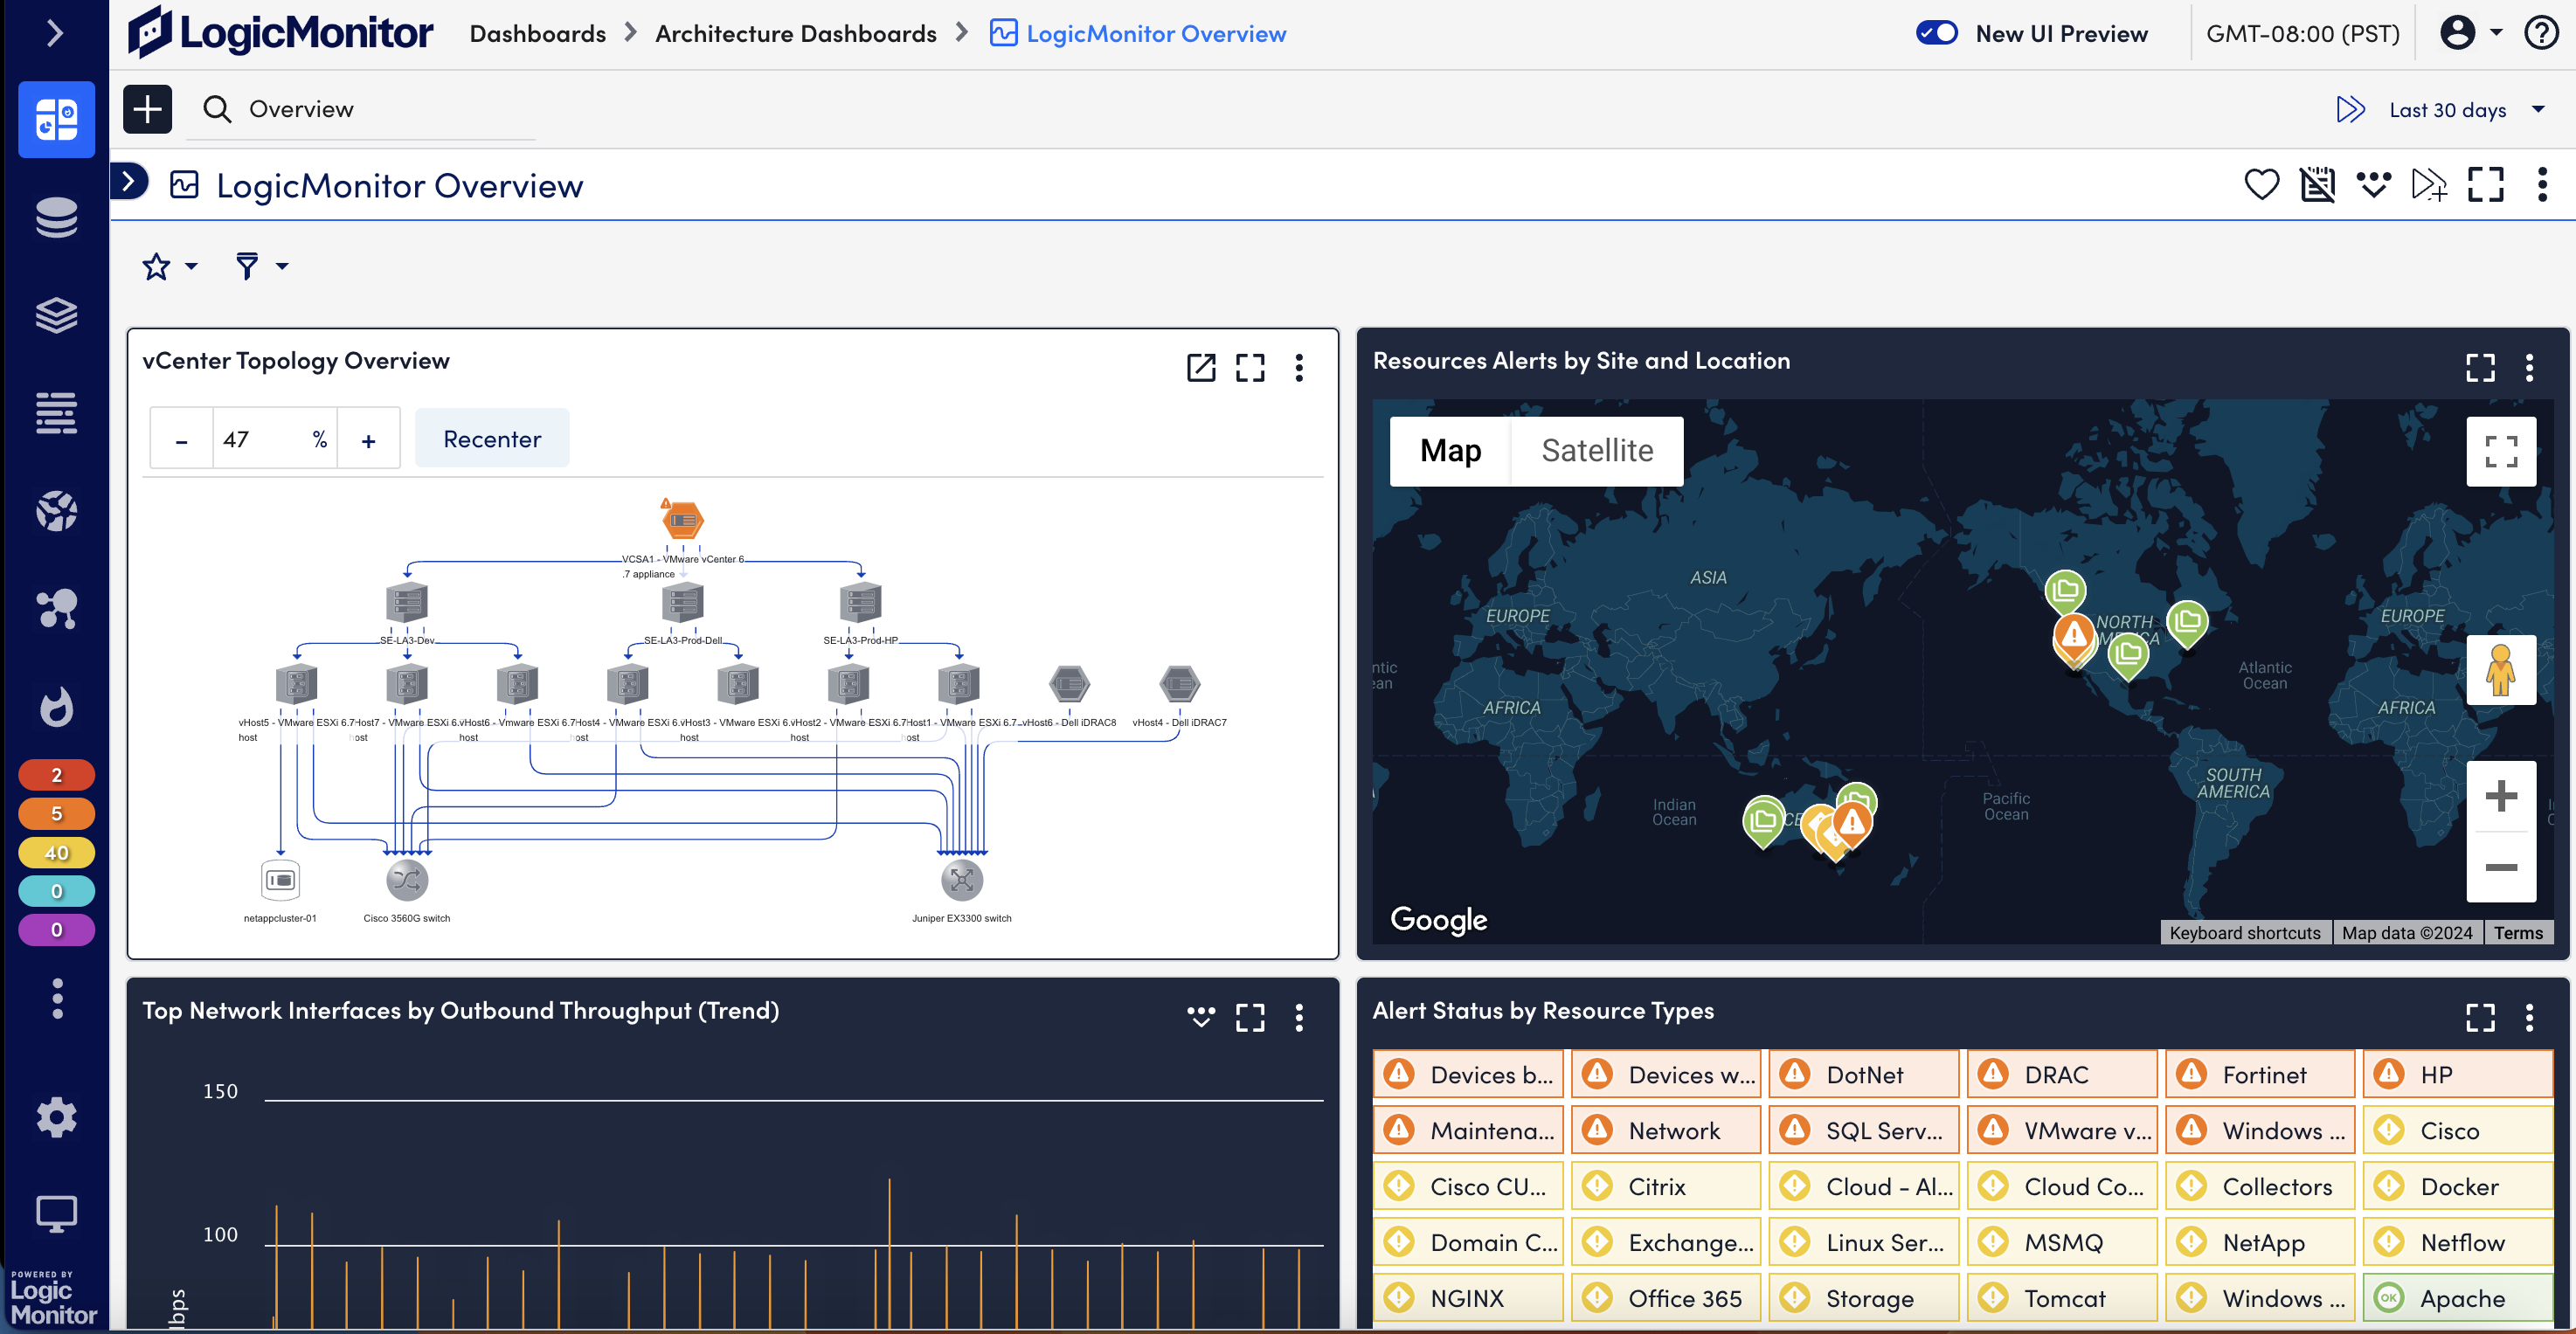
Auto-discover network devices

2000+ out-of-the-box integrations for top brands like Cisco, Juniper, Meraki and more allows for autodiscovery of any device on any network.

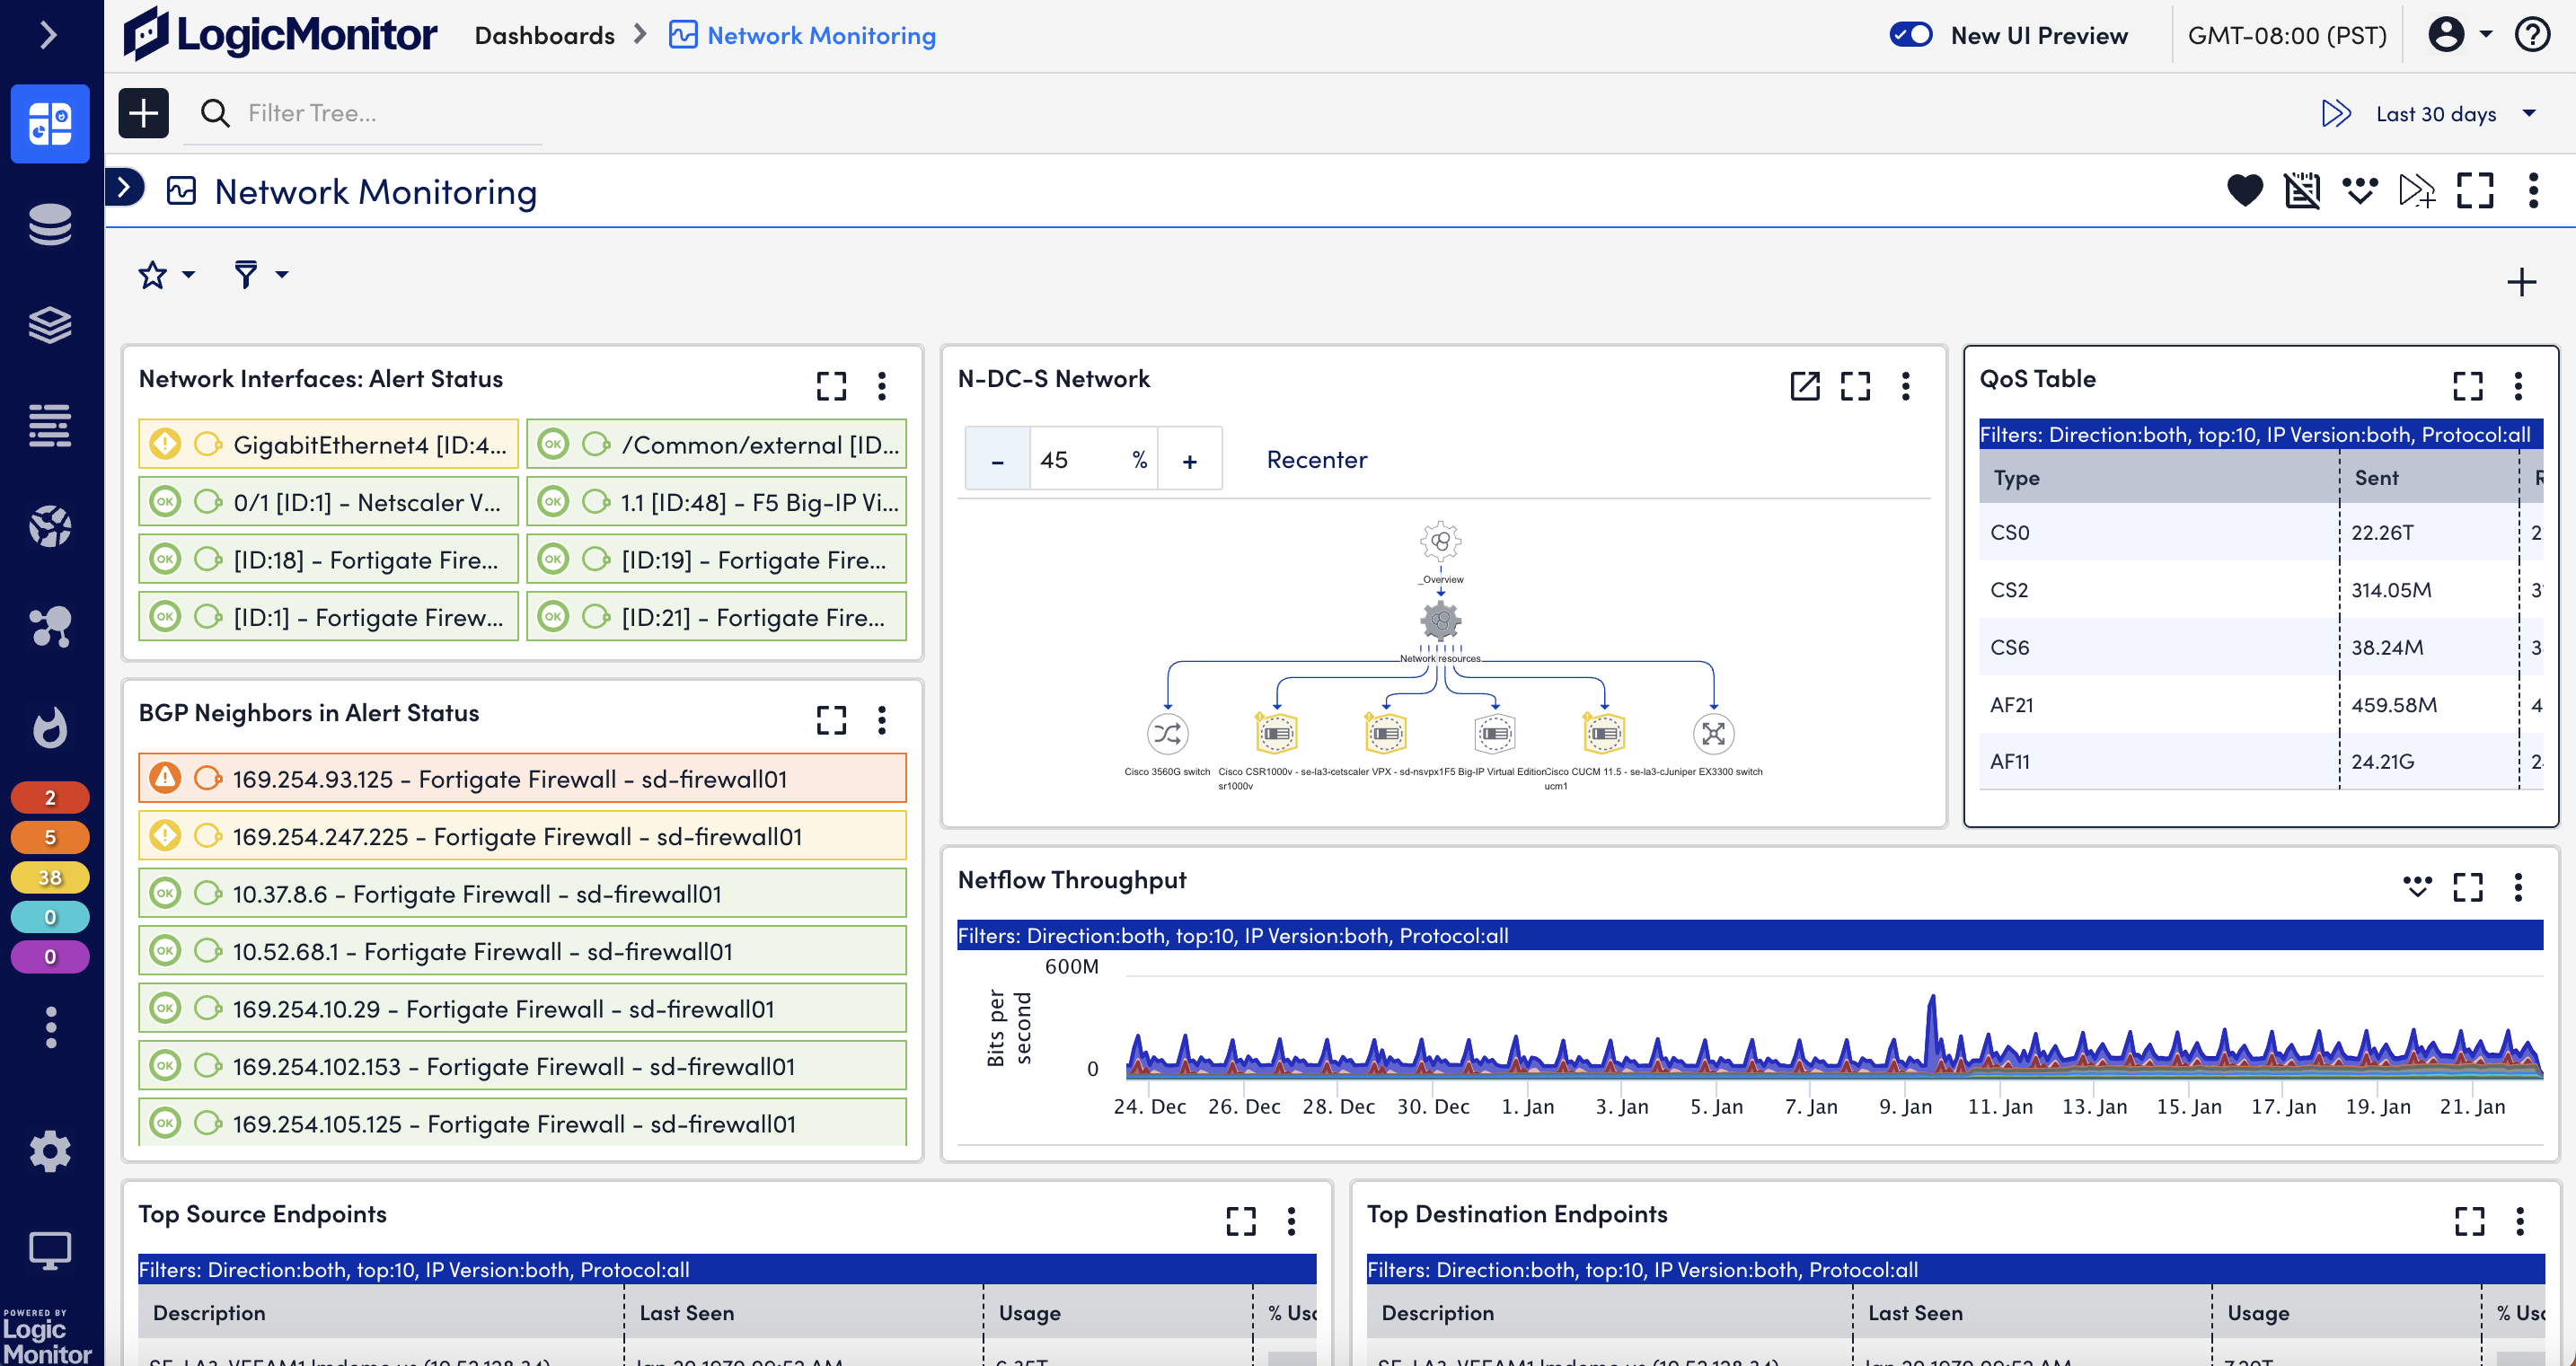
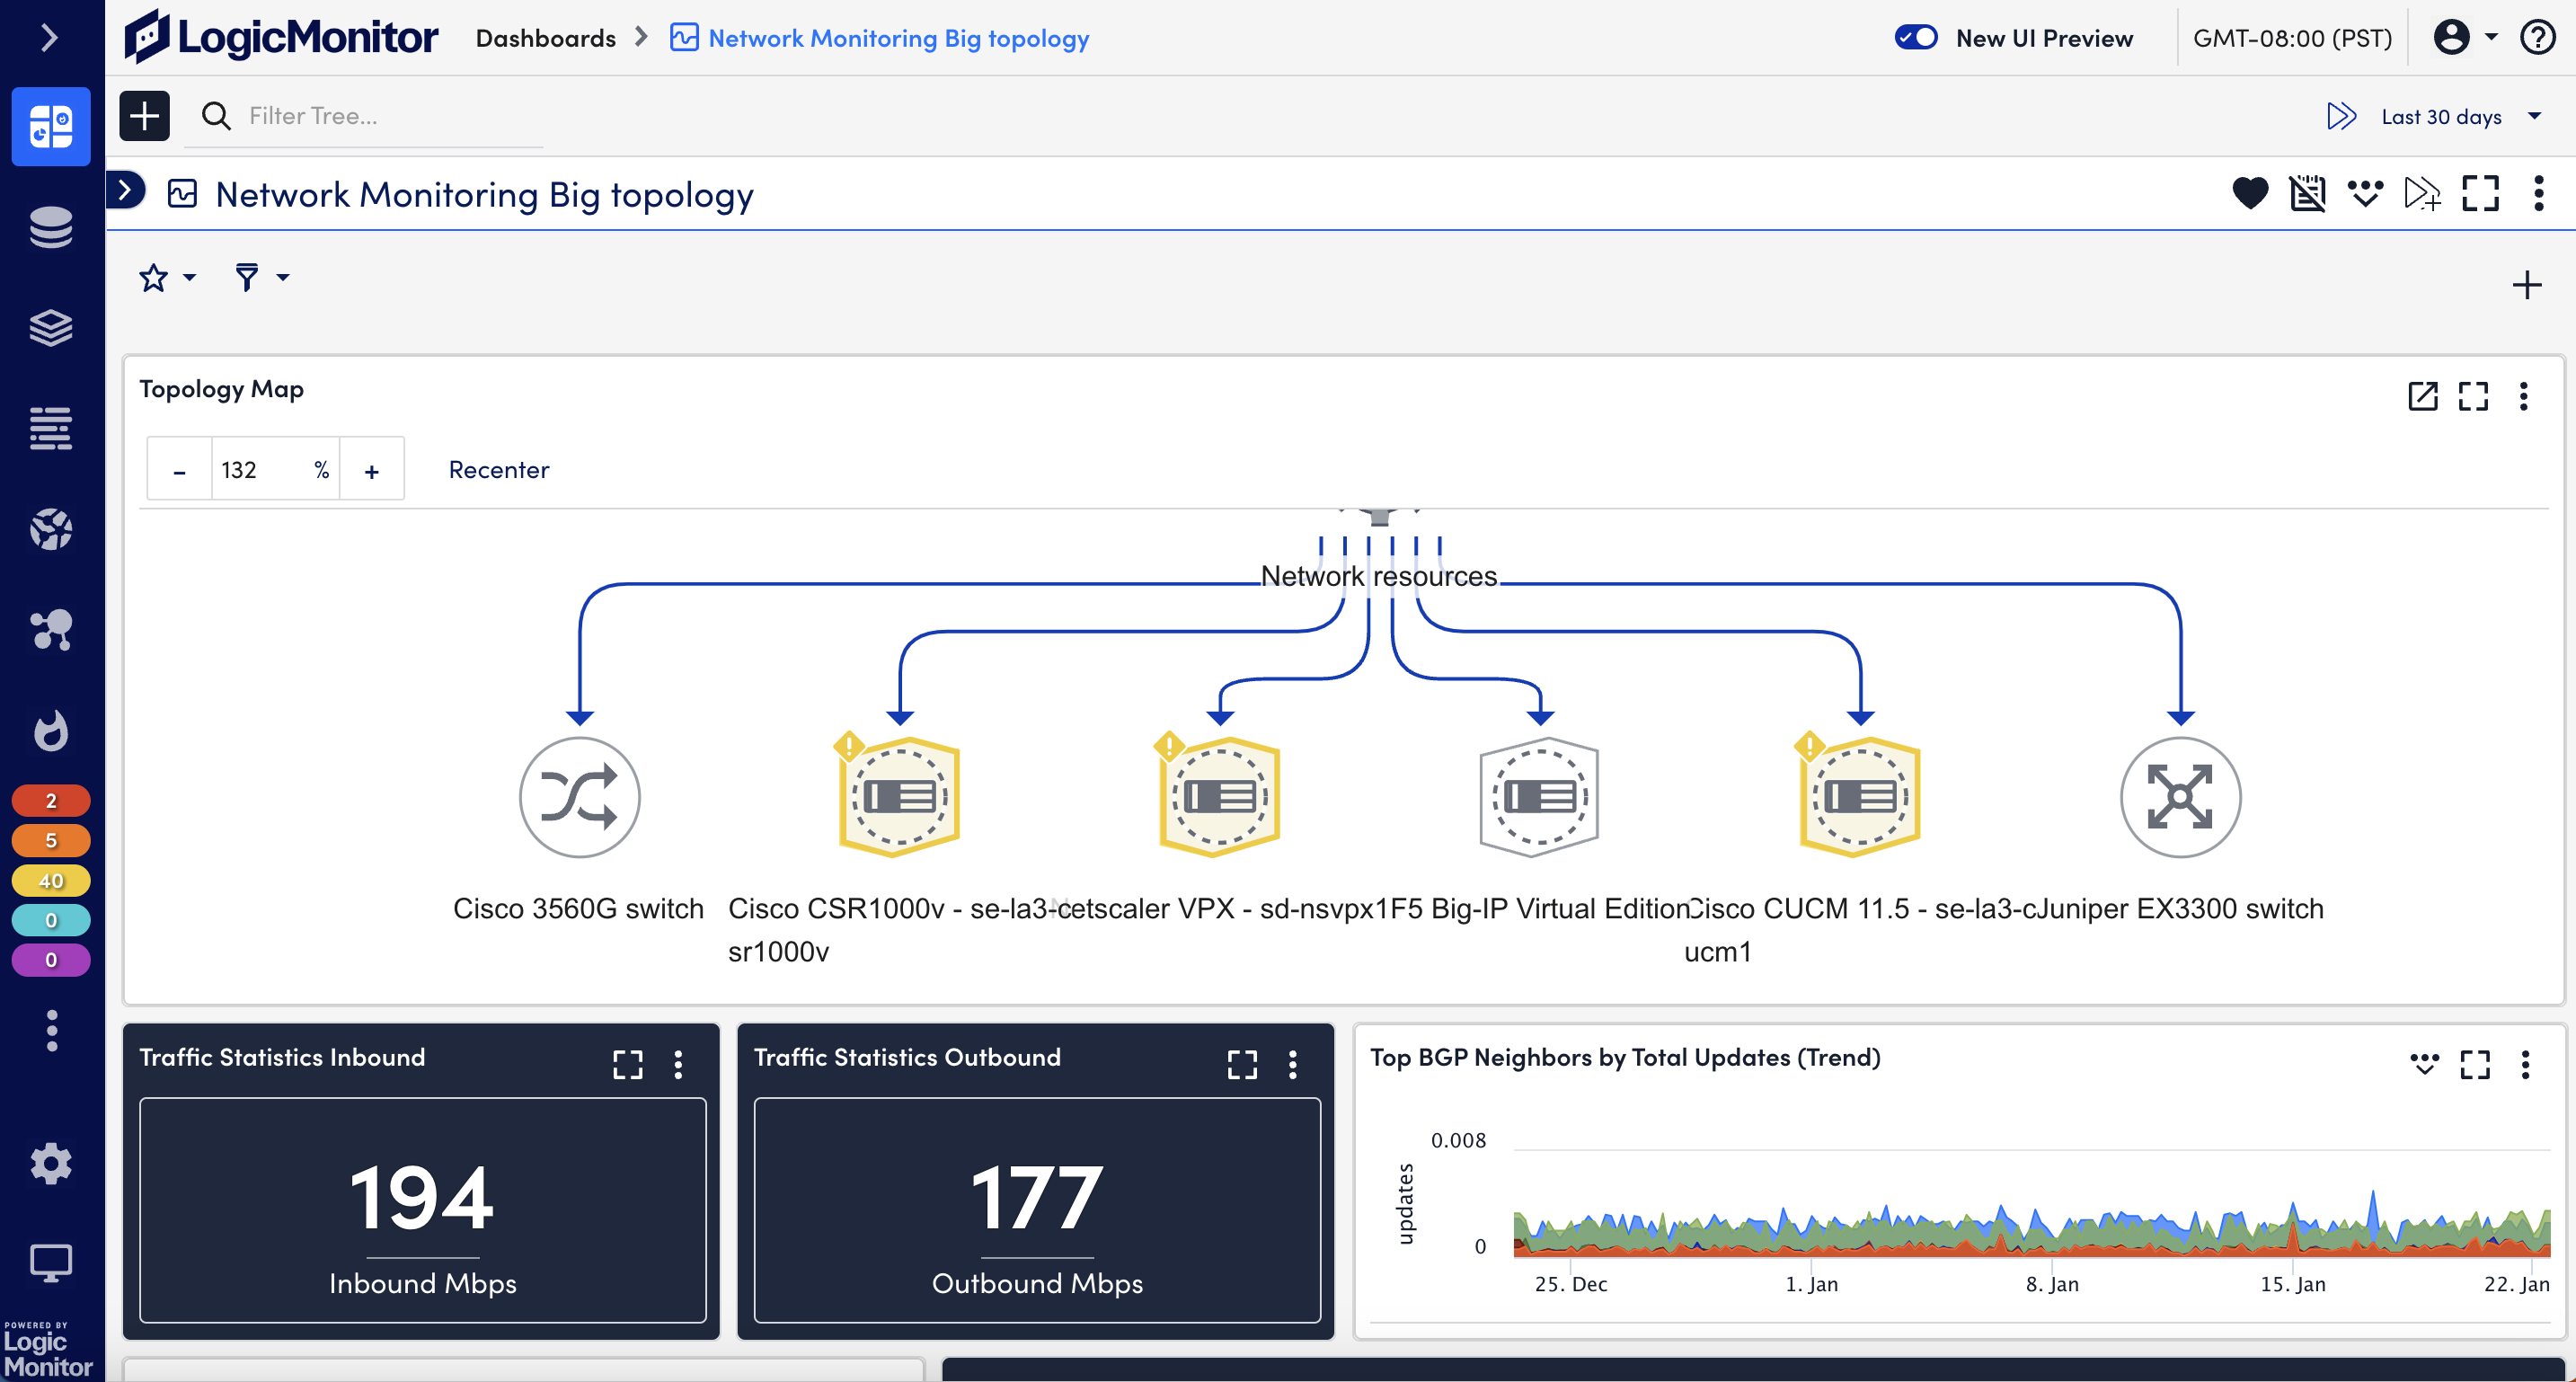
Visualize your network

Discover and map relationships between critical infrastructure resources. Dynamic auto-generated topology maps allow you to contextualize network traffic and alerts in real-time.

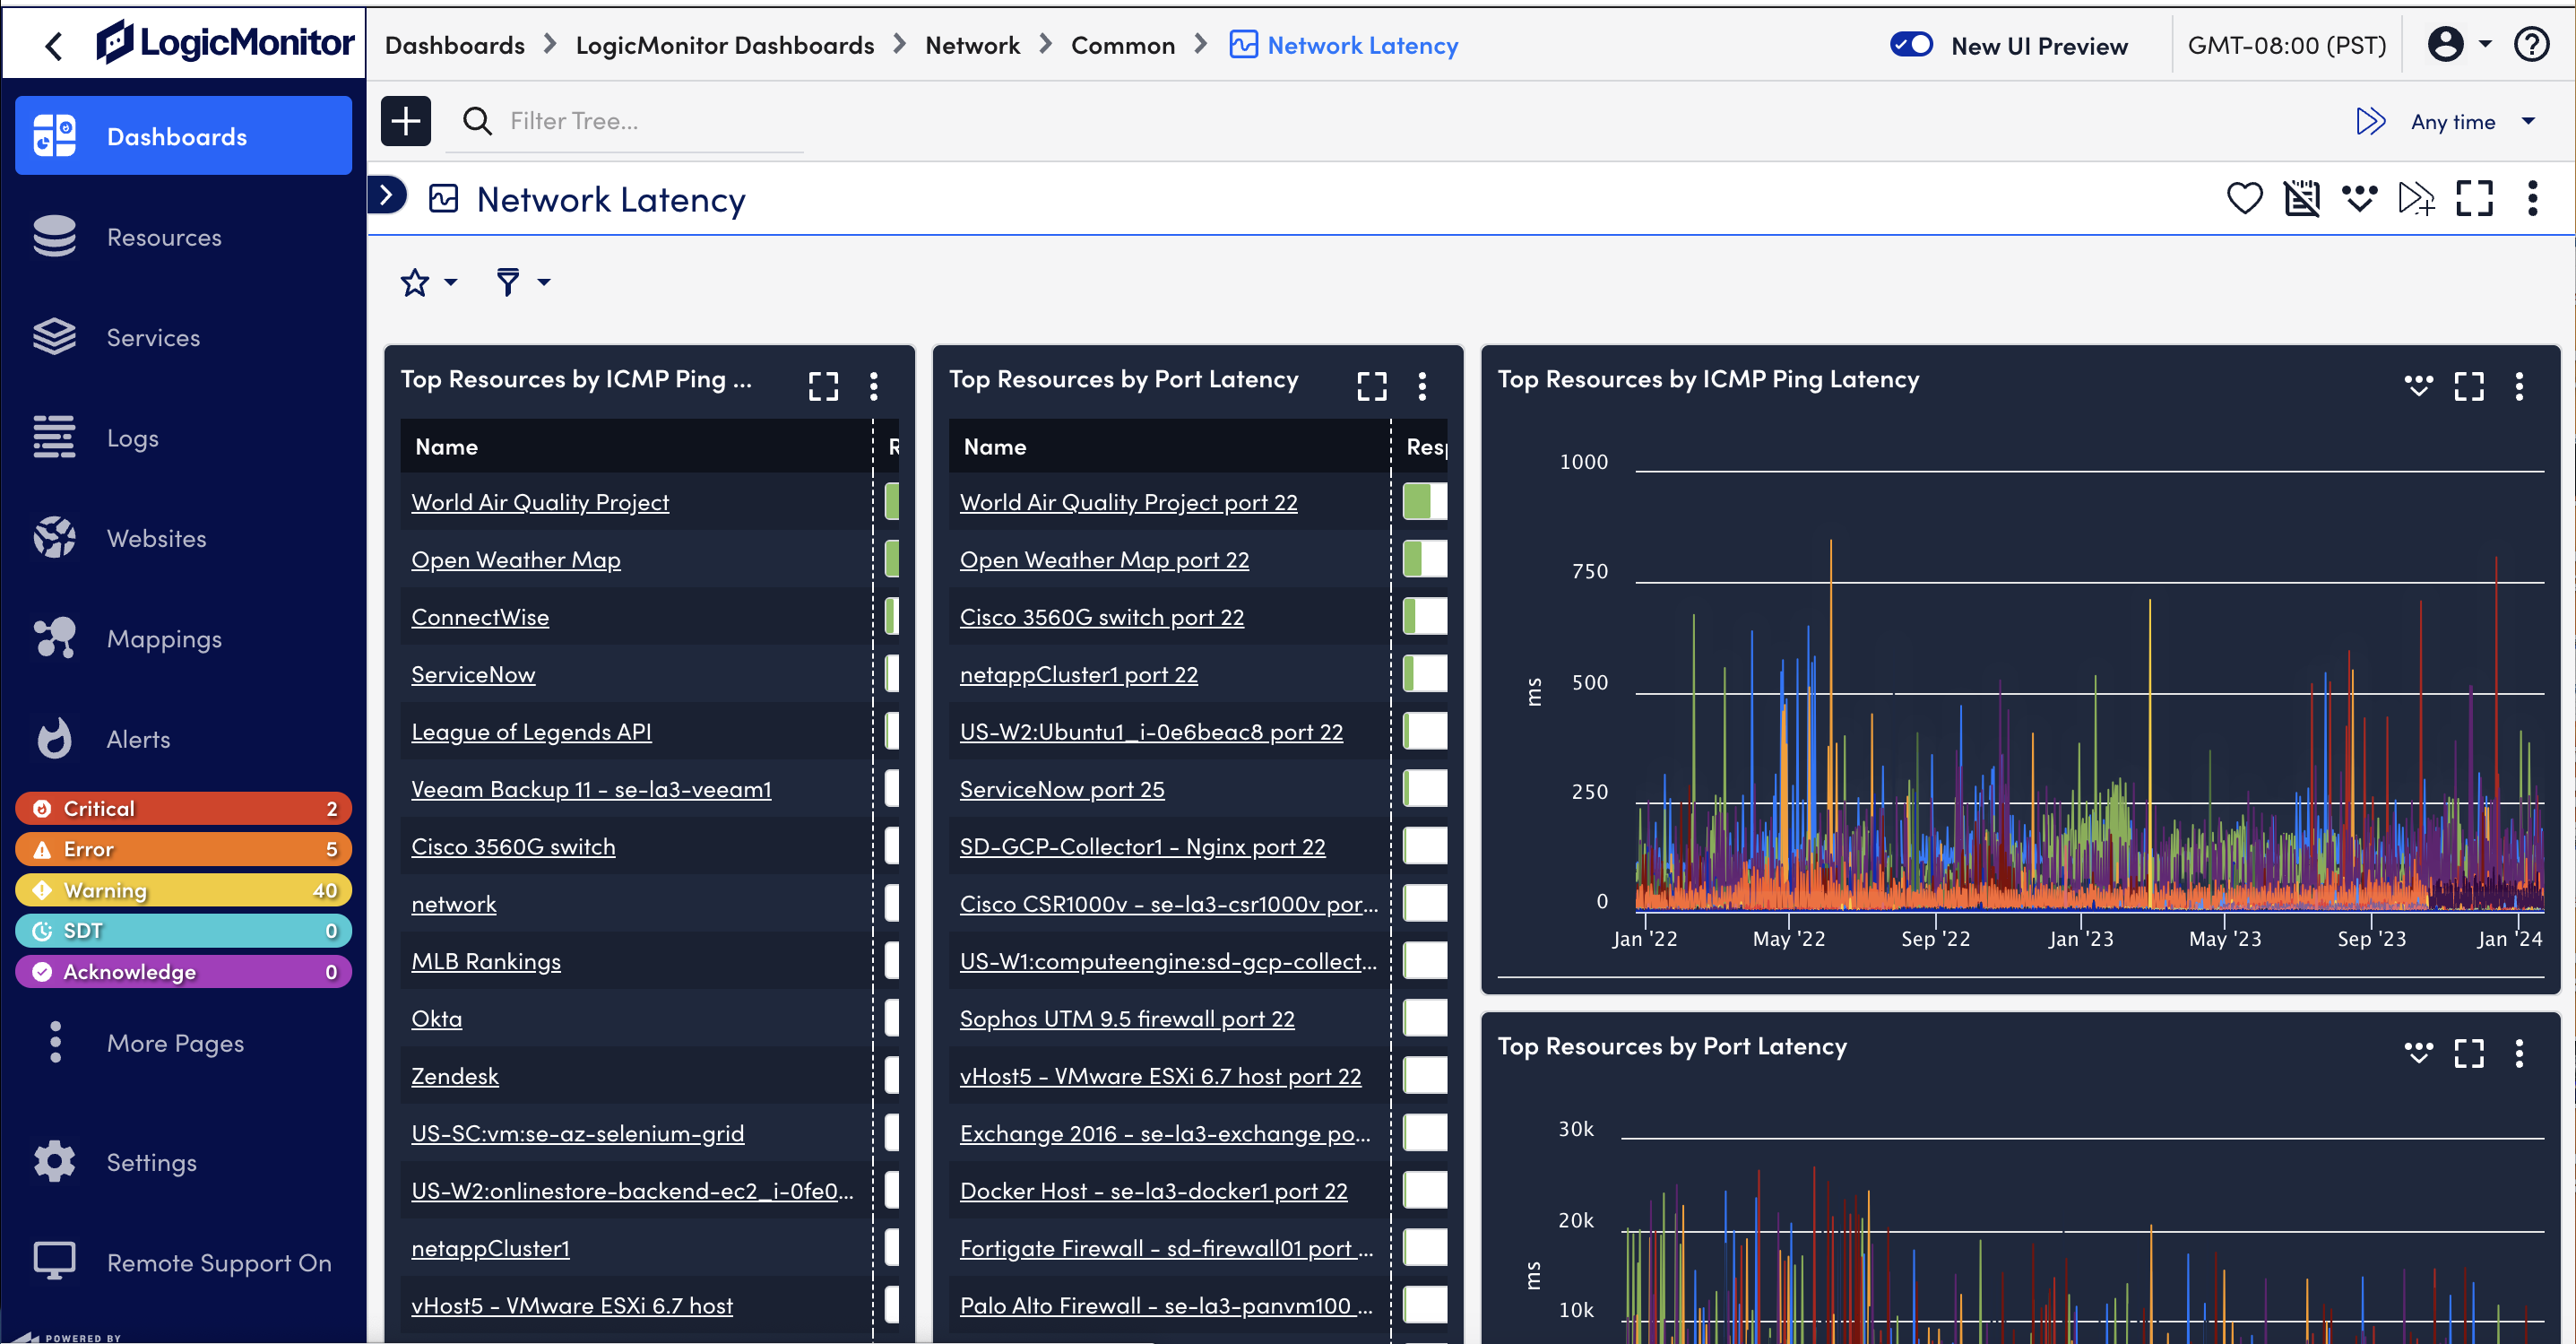
Troubleshoot network issues faster

End-to-end visibility with unified network logs and metrics and intelligent alerting thresholds solves network issues at lightning speed. Learn more

Any device. Any network.

The LogicMonitor platform provides comprehensive monitoring for every kind of modern enterprise network so you can eliminate visibility gaps and break down silos.

  • Monitoring via SNMP, API, jFlow, NetFlow, sFlow, WMI, NBAR2, and/or IPFIX
  • Monitoring for firewalls, routers, switches, wireless devices, load balancers, and more
  • Support for SD-WAN and cloud-based networks
  • Network topology mapping, root cause analysis, and intelligent alerting

Network monitoring that deploys in minutes at any scale

LogicMonitor utilizes a lightweight, agentless collector that automatically discovers everything you need to know about your network.

Get the coverage you need for the most complex networks – whether resources are on-premises, spread across multiple data centers, or in the cloud.

  • Instantly discover and monitor all network devices, including cloud SD-WAN, in a single platform with lightning-fast implementation in dynamic environments
  • Enable Network traffic monitoring on every network device to visualize your entire network infrastructure, from bandwidth allocation down to packet loss, and everything in between
  • Ingest network syslog data in minutes for immediate context without requiring proprietary querying capabilities
  • End-to-end visibility in a single platform for visibility into your network and dependencies across IT environment alongside intelligent alerting thresholds

Improve network health and optimize performance

When problems arise, resolve them faster than ever before with LogicMonitor’s suite of troubleshooting capabilities. Unified network logs and metrics quickly pinpoint the root cause of network availability and performance issues.

LogicMonitor’s dashboards, topology mapping, log-based anomaly detection, and forecasting, elevate visibility into networks to minimize service issues and performance bottlenecks.

With auto-generated topology mapping, LogicMonitor allows you to discover and map relationships between critical infrastructure resources. Drill down further and generate a topology map based on an alert to streamline your troubleshooting workflow and quickly discover the root cause of performance-impacting issues.

Full network visibility into the metrics that matter

Metrics alone do not provide meaningful insights into network health and performance. Traditional network monitoring tools fail to provide full visibility into the connectivity of network devices in modern environments and don’t integrate access to critical network log data to provide context into the events needed for troubleshooting. With LogicMonitor:

  • See the performance of your network devices within your entire IT ecosystem
  • Visualize network traffic latency alongside logs to confirm high-performance availability
  • Understand the impact of network service issues to reduce risk and escalate appropriately to triage
  • Explore relationships between critical infrastructure resources and your network devices with auto-generated topology mapping
  • Identify traffic origination, ensure optimal performance with real-time metrics and logs, and keep a pulse of network health with custom dashboards

See how we stack up

Track your company's network and devices with LogicMonitor.

It's great since we don't have to install bothersome agents on the devices or hardware that we want to monitor. I didn't even need to consult the instructions or contact customer support when I wanted to add a device; the process is simple and easy to follow.

Feb 12, 2024

Edwin Leonard

Senior Software Engineer

Matrix Networks

The tool for strategic Managed Services partners

SolarWinds had the big breach just as we left it. We loved how powerful it was, and how customizable - however, it is an ON-Prem tool, and as a growing MSP, that dynamic didn't and couldn't scale.

Nov 21, 2022

Ali Gaeta

Manager of Managed Services

Internetwork Engineering

Help businesses spend less time on manual tasks and consolidate existing tools

LogicMonitor dynamically scales with our network's growth. Whether we add new devices or expand into the cloud, the platform adapts seamlessly, eliminating the need for constant manual configuration. Excels in providing comprehensive visibility into our network infrastructure. It auto-discovers devices and monitors various network components, including servers, switches, routers, and cloud services.

Sep 22, 2023

Evan Rachel

Social Media Analytics

AutomationHq

Network monitoring benefits

Discover efficiencies

Consolidate workflows to monitor network performance and troubleshooting with unified network logs and metrics. Leverage anomaly detection and dynamic thresholds to identify potential network service issues with actionable insights and enhanced data to minimize impact to customers and employees.

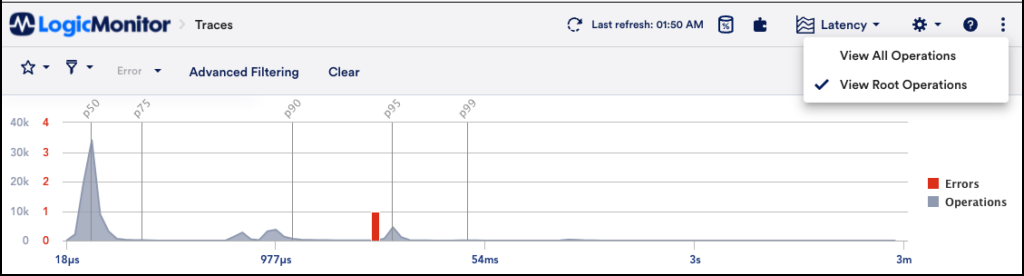
Detect anomalies and outliers

Pinpoint the root cause of potentially malicious traffic to take control of your network, follow log-based network log anomalies to reduce MTTR, and follow contextual analysis to monitored IT devices.
Know exactly why network service was impacted and quickly identify, fix, and learn.

How are firewalls and SD-WAN related?

Adaptive monitoring

Invest in network monitoring that meets the needs of new technology like cloud computing, virtualization, and SD-WAN or SASE to ensure network availability and performance. Deploy, add devices, and manage network access to optimize your network infrastructure for modern hybrid and multi cloud environments.

Related solutions

Get full stack visibility

LM Envision goes beyond monitoring your network, to monitoring your entire tech stack. From cloud, to on-prem, to hybrid environments, your entire infrastructure is available at your fingertips. Get the unified view you need to reduce mean time to resolution and correlate network performance with other key infrastructure components.

Explore infrastructure monitoring

Understand how your network is affecting service delivery

With over 2500 integrations, LM Envision has your cloud, on-premises, and hybrid IT environments covered with the power to drill into your applications, servers, storage arrays and more. Out-of-the-box integrations with Netflow, sFlow, jFlow, WMI, Cisco, firewalls, routers, switches and thousands more make up a truly comprehensive solution. See more, faster.

Explore integrations

Reduce alert noise with advanced intelligence

Proactively manage challenging network conditions like congestion and over-consumption of network resources with deep analysis of top flows, ports, and QoS tables. Cut through the noise and streamline workflows with advanced AIOps capabilties including anomaly detection, root cause analysis and dynamic thresholds.

Explore AIOps
AIOps 3D icon

Support software-defined networks

LM Envision works with Cisco SD-WAN product teams to develop best-in-class monitoring coverage for Viptela and Meraki. With extensive visibility for SD-WAN alongside traditional datacenter and hybrid cloud environments with built-in topology mapping to show the relationships within your infrastructure.

Explore SD-WAN

Expand network visibility with log data

Ingest log data from network devices (routers, switches, firewalls) to analyze alongside other devices in a single platform for a unified view of the IT environment. Log-based anomaly detection looks through noisy logs to push relevant insights that could minimize performance issues. Scale log ingestion with business needs and reduce MTTR by correlating network performance with other critical infrastructure components.

Explore Log Analysis

Contact our team to get started

Go beyond website monitoring with full access to the LogicMonitor platform. Comprehensive monitoring and alerting for unlimited devices and the full suite of core platform features.
Features include:

  • AIOps early warning system
  • Automated device discovery
  • Alerting and escalation chains
  • 2000+ monitoring integrations
  • 100+ pre-built dashboards
  • Comprehensive training modules
  • 24/7 chat support

Sign up today

Networking and Kubernetes: A Layered Approach

Explore the latest networking trends, delve into the intricacies of Linux networking, and come to understand the challenges of deploying containerized applications in cloud networks.

View eBook
Networking and Kubernetes

2023 G2 Network Monitoring Grid Report

See how LogicMonitor's network monitoring stacks up in this comprehensive report by G2, the world’s largest B2B software review platform.

View Report
G2 Network Monitoring Software report

Network monitoring and troubleshooting solution brief

Scale the impact of your network with comprehensive hybrid and multi-cloud monitoring in a single platform. Alleviate networking points of friction with increased visibility, and leverage unified network logs and metrics to speed up troubleshooting across all network and IT devices.

View Brief

More network monitoring resources

Anomaly detection graphic

anomalies / 03.21.24

How to enhance network monitoring: 3 anomaly detection use cases

Discover three use cases for anomaly detection in network monitoring, from identifying overheating to predicting degradation and abnormal CPU usage. Learn how it automates thresholds and boosts efficiency.

Learn More
desktop with LM UI

Cloud Monitoring / 12.20.23

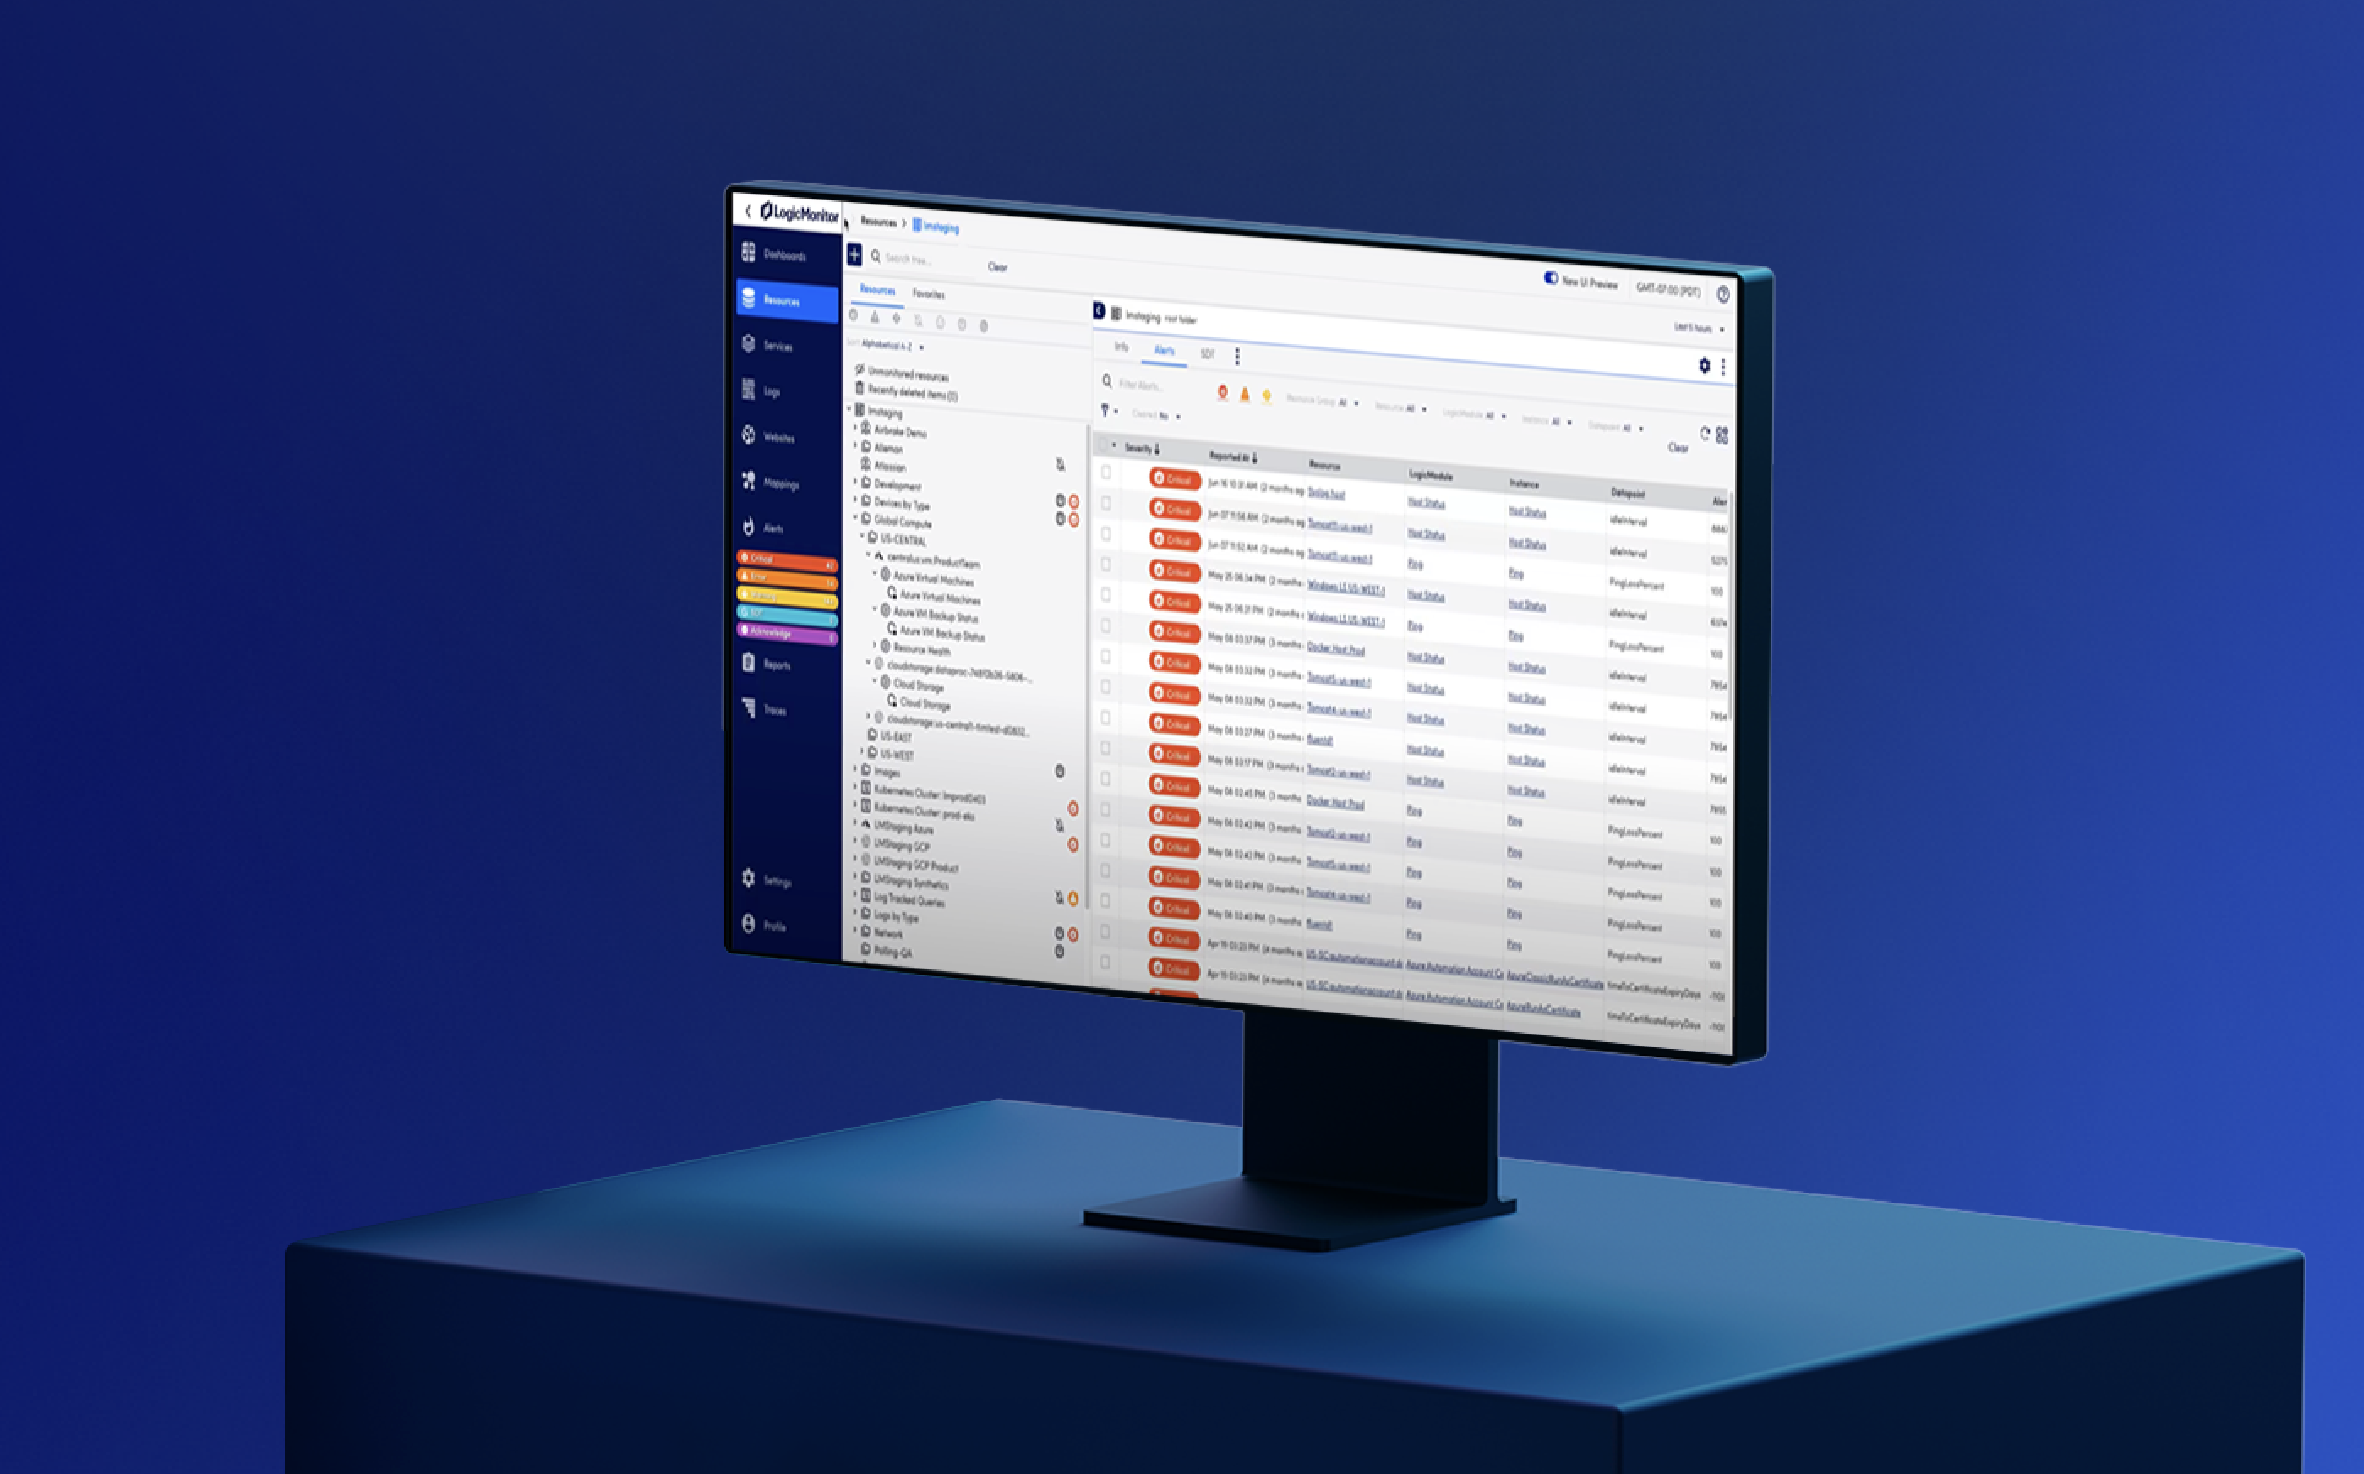
Hybrid observability made easy: introducing LogicMonitor’s new UI

LogicMonitor introduces new UI to meet the demands of modern hybrid observability and cloud-centric operations.

Learn More
viking logo

alerts / 12.14.23

LogicMonitor Delivers a Competitive Advantage to the NFL’s Minnesota Vikings Football Team

The renowned sports team depends on the hybrid observability platform, LM Envision, for uninterrupted access to vital video footage

Learn More

Network monitoring FAQs

What is network monitoring?

Network monitoring provides the real-time information needed to determine the overall performance of a computer network. These solutions proactively detect and provide solutions for problems in a network by comparing live performance against an expected performance baseline.

How does network monitoring work?

Networks can be monitored by discovering devices within a network and correlating that information with the data those devices on the network are outputting.

Why is network monitoring important?

Monitoring your network is crucial for businesses to ensure uptime within your network, to troubleshoot issues, and to proactively plan for the future.

Which network monitoring tool is the best?

LogicMonitor’s cloud-based observability platform is a leader for network monitoring, infrastructure monitoring, and beyond.

Why Should you monitor your network?

Networks need to be monitored to maintain uptime. Monitoring specific devices within each network can show what resources are being allocated where, and what devices are using the most bandwidth.

Is LogicMonitor Network Monitoring Agent
based or agentless?

LogicMonitor’s network monitoring is agentless, so no physical devices need to be installed to start monitoring your entire network.

What is network performance monitoring?

Network performance monitoring measures the real-time health of your entire network of connected devices, to ensure reliability and uptime.

What is network topology mapping?

Network topology mapping is the process of graphing network-connected devices and the data collected within devices together to form a map of where network data streams through and how.

What’s the difference between network
monitoring and network performance
monitoring?

Network monitoring measures all of the devices within a network, while network performance monitoring measures the overall health of that network. The two terms are similar, and in most functional instances can be used interchangeably.