Redshift
Last updated on 27 March, 2023LogicMonitor currently has two datasources for monitoring Redshift:
- AWS_RedshiftCluster
- AWS_RedshiftNodes
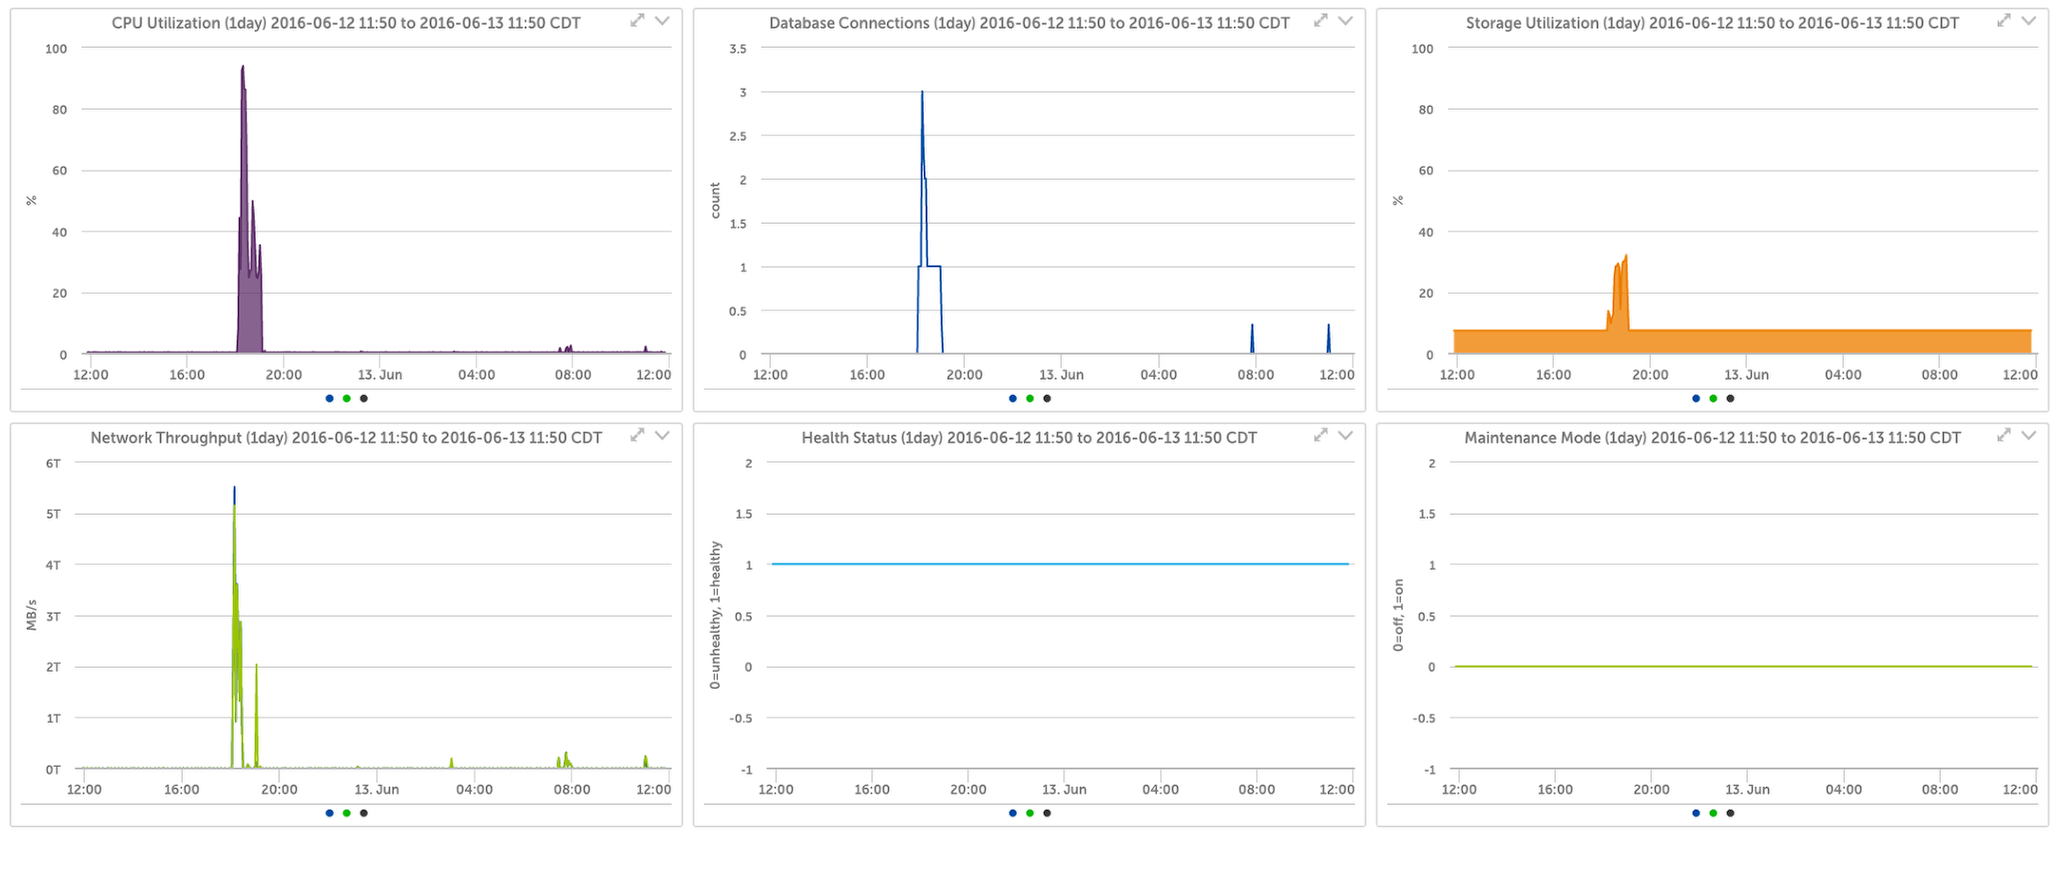
AWS_RedshiftCluster
Source: CloudWatch
Datapoints:
- CPUUtilization
- DatabaseConnections
- HealthStatus
- MaintenanceMode
- NetworkReceiveThroughput
- NetworkTransmitThroughput
- PercentageDiskSpaceUsed
Default Polling Interval: 1 minute
Additional Configuration Necessary?: No. This datasource will automatically apply to the Redshift instances discovered for your AWS account and start collecting data.
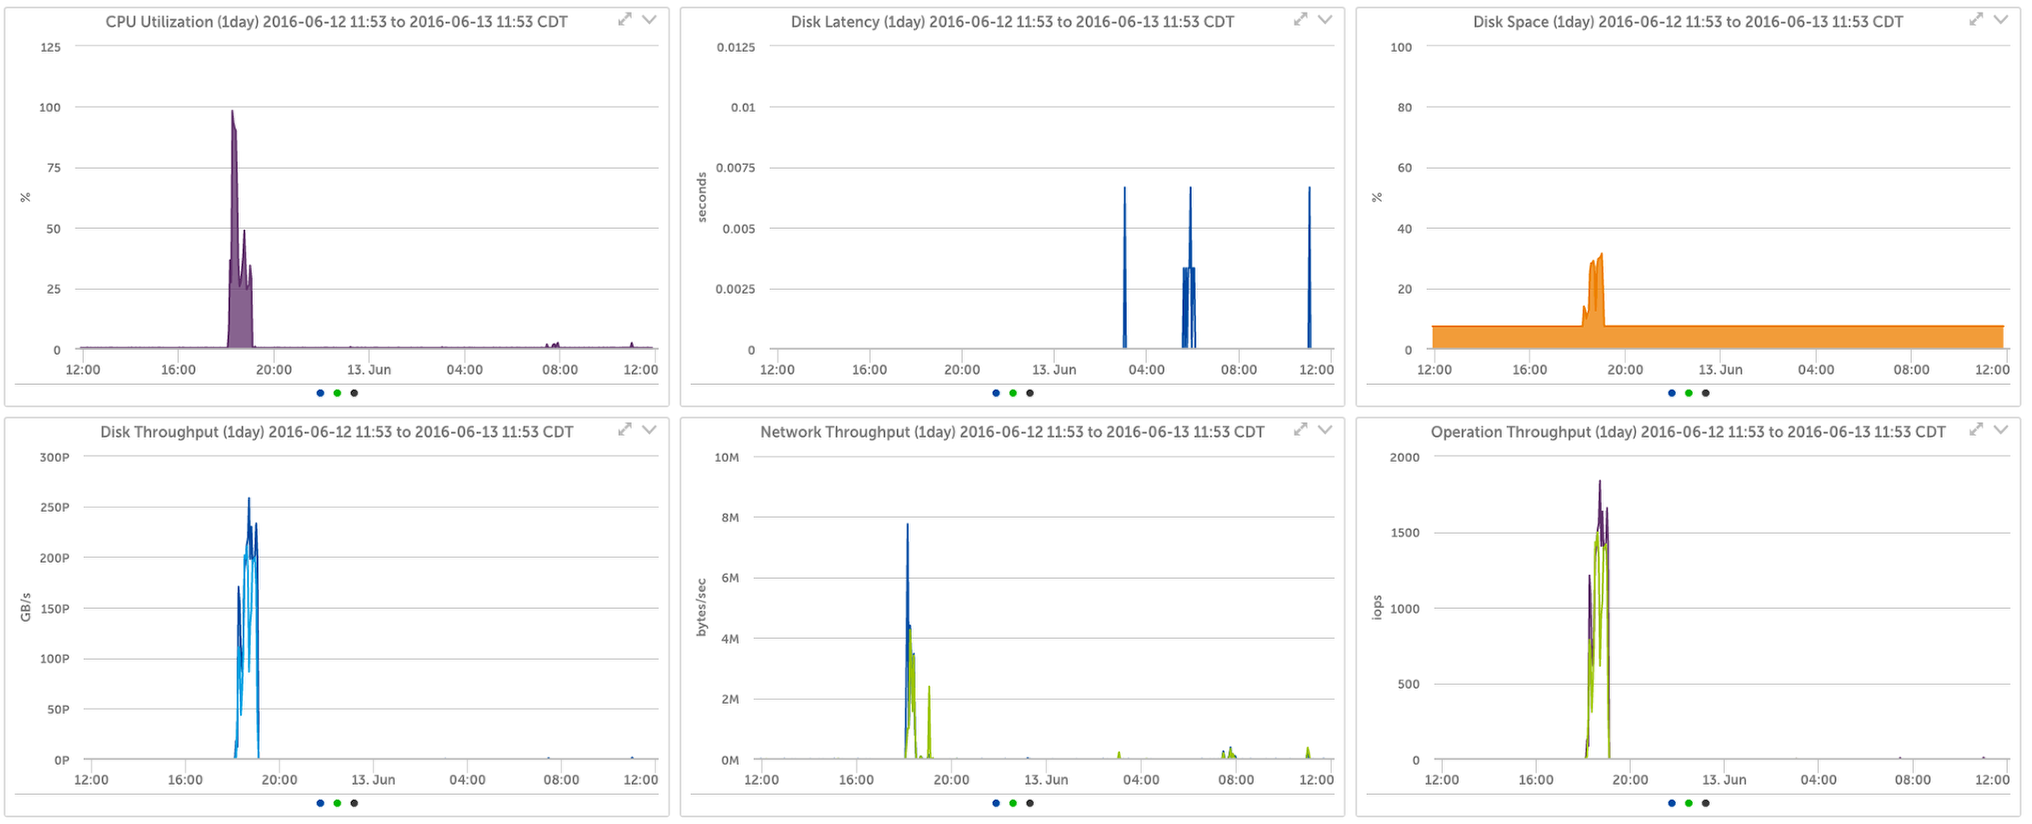
AWS_RedshiftNodes
Source: CloudWatch
Datapoints:
- CPUUtilization
- NetworkReceiveThroughput
- NetworkTransmitThroughput
- PercentageDiskSpaceUsed
- ReadIOPS
- ReadLatency
- ReadThroughput
- WriteIOPS
- WriteLatency
- WriteThroughput
Default Polling Interval: 1 minute
Additional Configuration Necessary?: No. This datasource will automatically apply to the Redshift instances discovered for your AWS account and start collecting data.