S3
Last updated on 27 March, 2023LogicMonitor currently has one datasource for monitoring S3 bucket size metrics:
- AWS_S3 – collects billable storage consumed by each S3 bucket
- AWS_S3_Performance – collects bucket performance metrics
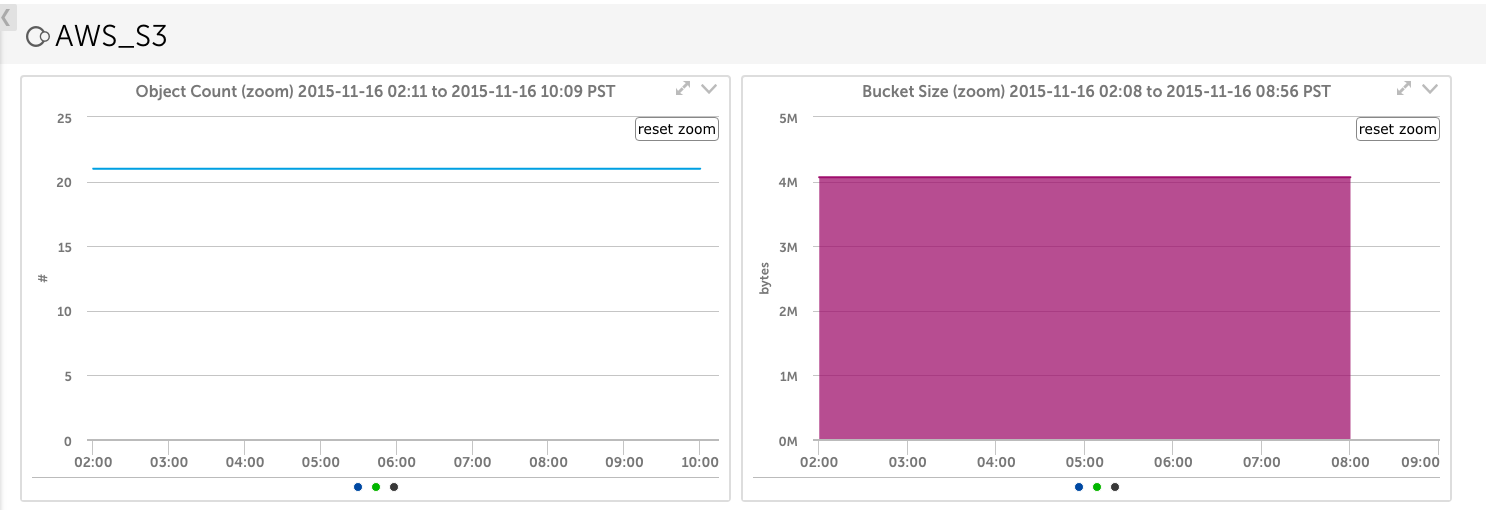
AWS_S3
Source: CloudWatch
Datapoints:
- Bucket size – standard storage class
- Bucket size – reduced redundancy storage (rss) class
- number of objects
Default Polling Interval: 1 hour. Note that S3 data is reported via CloudWatch once per day. Therefore, if desired, you can decrease the polling interval to one day to minimize your CloudWatch costs. Doing so, however, will necessitate that you set the time range on your graphs to span multiple days.
Additional Configuration Necessary?: No. This datasource will automatically apply to the S3 instances discovered for your AWS account and start collecting data.
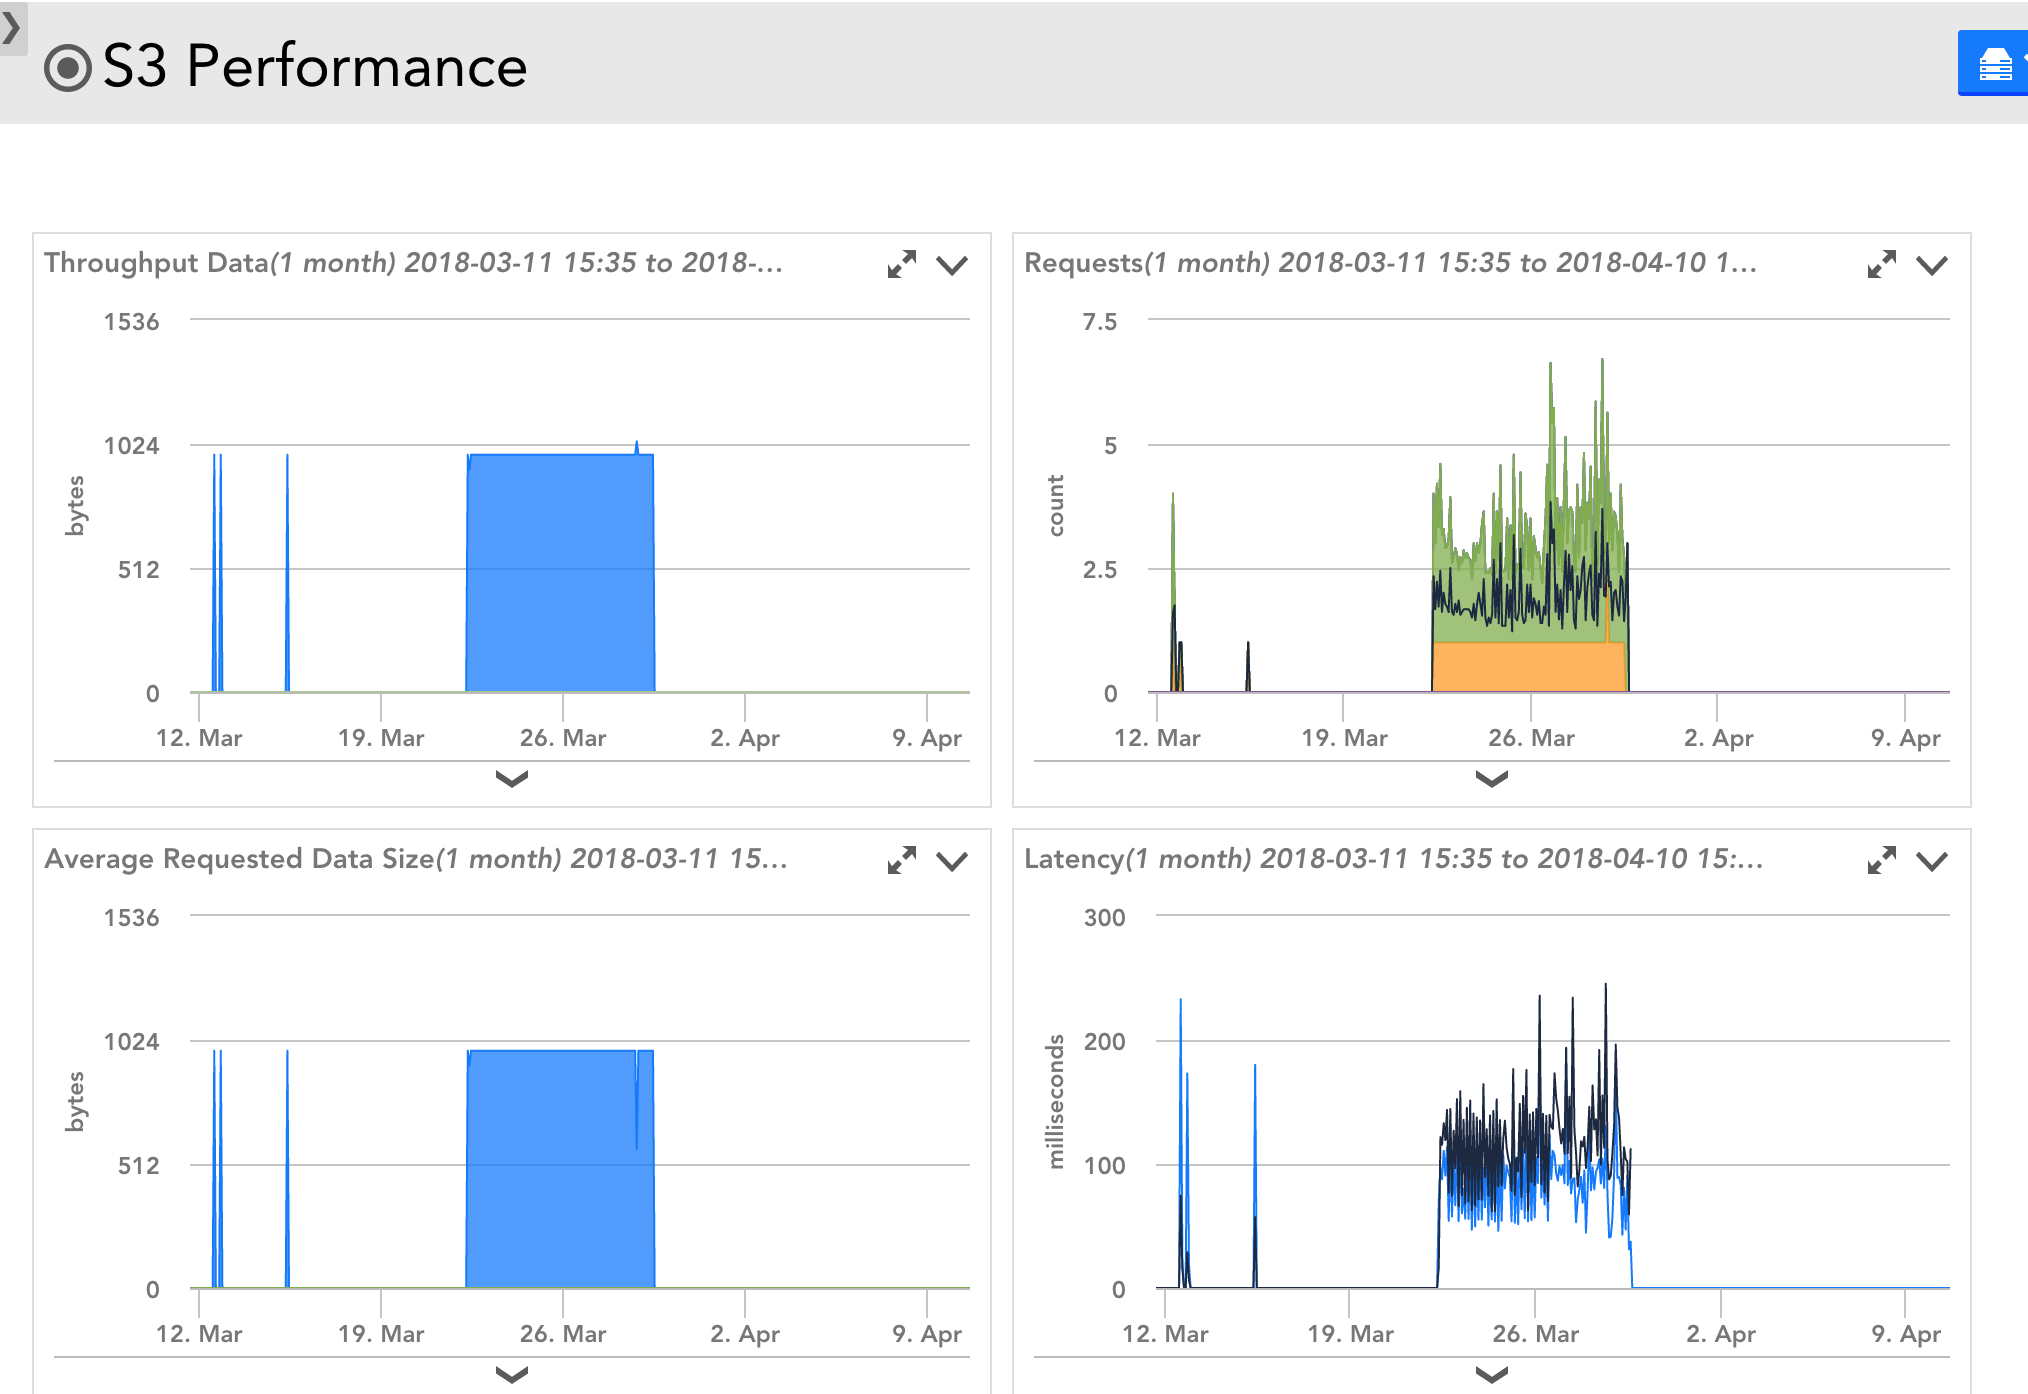
AWS_S3_Performance
Source: CloudWatch
Datapoints:
- 4xx Errors
- 5xx Errors
- Requests – All, GET, HEAD, DELETE, POST, PUT, LIST
- Bytes Downloaded
- Bytes Uploaded
- Latency – First byte, Total
Default Polling Interval: 5 minutes
Additional Configuration Necessary?: Yes, request and data transfer metrics must be enabled per bucket before these metrics are available via CloudWatch. This module will automatically apply to all S3 buckets with data transfer and / or request metrics enabled (but will not apply to buckets without such metrics enabled).