
Collector Performance
Last updated on 09 January, 2021LogicMonitor’s collectors are configured to work well in most environments, but can need tuning.
Performance Overview
There is a trade-off between the collector’s resource consumption (CPU and memory) and performance. The collector by default does not consume many resources, so tuning of the collector may be required in large environments, environments where a collector is not doing a variety of work (e.g. a collector doing almost all JMX collection, instead of a mix of SNMP, JMX and JDBC), or environments where many devices are not responding. Tuning may involve adjusting the collector’s configuration, or it may involve redistributing workloads.
A common reason for collectors to no longer be able to deal with the same devices they have been monitoring is if some devices no longer respond. For example, if a collector is monitoring 100 devices with no queuing, but then starts showing task queueing, or is unable to schedule tasks, this may well be because it can no longer collect data from some of the devices. If it was talking to all those devices via JMX, and each device normally responded to a JMX query in 200 ms, it could cycle through all the devices easily. However, if the JMX credentials now mismatch on 10 of the hosts, so that they do not respond to LogicMonitor queries – the collector will keep a thread open until the configured JMX timeout. It will now be keeping several threads open, waiting for responses that will never come. Tuning can help in this situation.
How do I know if a Collector needs tuning?
Assuming you’ve set up Collector monitoring, you will be alerted by the Collector Data Collecting Task datasource if the collector is unable to schedule tasks. This is a clear indication that the workload of a collector needs tuning, as data is not being collected in accordance with the datasource schedule. This may result in gaps in graphs. Another metric to watch is the presence of elements in the Task Queue. This indicates that the collector is having to wait to schedule tasks, but that they are still completing in the appropriate time – so it’s a leading indicator of a collector approaching its configured capacity.
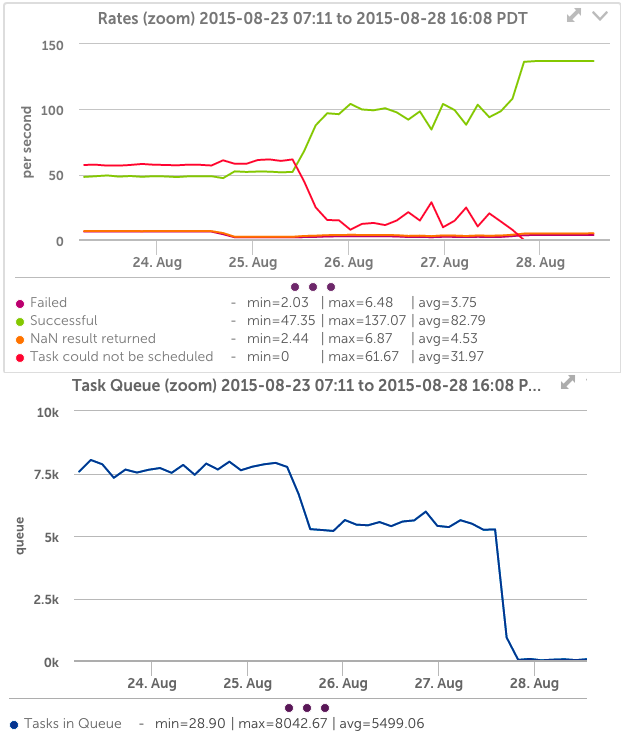
You can see on the below graphs that the Collector datasources clearly show an overloaded collector – there are many tasks that cannot be scheduled, and the task queue is very high. After tuning (Aug 26), the number of successful tasks increases; unscheduled tasks drops to zero, as does the task queue.
A good proactive behavior is to create a collector dashboard, and create a Custom Graph showing the top 10 collectors by the datapoint UnavailableScheduleTaskRate for all instances of the Data Collecting Task datasource on all devices, and another showing the top 10 collectors by TasksCountInQueue. Given each collector has many instances of these datasources (one for each collection method), you may have to specify specific collection methods as instances – snmp, jmx, etc – in order to not exceed the instance limit on a custom graph. Otherwise set instances to a star (*) to see all methods on one graph.
Collector Tuning
The easiest way to tune your Collector is simply to increase the Collector size. The small Collector only uses 2GB of memory, but can perform more work if upgraded to a larger size (and the server running the Collector has the memory available). The Collector’s configurations can also be modified manually, as discussed in Editing the Collector Config Files.
In general, there are two cases that could require Collector tuning:
- when devices are not responding
- when the Collector cannot keep up with the workload
Both are often addressed by increasing Collector Size, which should be your first step. However, if you’ve already tried increasing the size and still see performance issues, you may find it helpful to do a little fine tuning.
Devices not responding
If devices are failing to respond to a query from the collector, because they have had their credentials changed, the device is offline, the LogicMonitor credentials were incorrectly set, or other reasons, you should get alerts about the protocol not responding on the device. The best approach in this situation is to correct the underlying issue (set the credentials, etc), so that the monitoring can resume on the devices. However, this is not always possible. You can validate from the Collector debug window (Under Settings…Collectors…Manage Collector…Support…Run Debug Command) whether this issue is impacting your collectors. If you run the command !tlist c=METHOD, where method is the data collection method at issue (jmx, snmp, WMI, etc), you will get a list of all the tasks of that type the collector has scheduled.
If you see many tasks that failed due to timeout or non-response – those tasks are keeping a thread busy for the timeout period of that protocol. In this situation, it may be appropriate to reduce the configured timeout, to stop threads from blocking for so long. The default for JMX timeouts was 30 seconds at one point – which is a very long time for a computer to respond. Setting that to 5 seconds (the current default) means that for a non-responsive device, 6 times as many tasks can be processed in the same time. Care should be taken when setting timeouts to ensure they are reasonable for your environment. While it may be appropriate to set the JMX timeout to 5 seconds, the webpage collector may be left at 30 seconds, as you may have web pages that take that long to render. Setting a timeout to a shorter period than it takes devices to respond will adversely affect monitoring.
To change the timeout for a protocol, you must edit the collector configuration manually from the Collector Configuration window. Edit the collector.*.timeout parameter to change the timeout for the protocol you want (ex: change collector.jmx.timeout=30 to collector.jmx.timeout=5).
You may also need to increase the number of threads, as well as reducing the timeout period – see the section below.
Collector cannot keep up with workload
If the Collector is still reporting tasks cannot be scheduled, it may be appropriate to increase the number of threads for a collection method. This will allow the collector to perform more work simultaneously (especially if some threads are just waiting for timeouts), but will also increase the collectors CPU usage.
To increase the threads available to a collection method, you must edit the collector configuration manually from the Collector Configuration window. Edit the collector.*.threadpool parameter to change the threadpool allotment for the protocol you want (ex: change collector.jmx.threadpool=50 to collector.jmx.threadpool=150).
It is recommended to increase the threadpool setting gradually – try doubling the current setting, then observing behavior. Note changes in the collector’s CPU utilization, and Heap utilization – more threads will use more CPU, and place more demands on the JVM heap. If the collector heap usage (shown under the Collector datasource Collector JVM Status) is approaching the limit, that may need increasing too.
If a collector has had its threads increased and its heap increased, and still cannot keep up with the workload (or is hitting CPU capacity) – it is time to add another collector and split the workload amongst the collectors.