AIOps for Hybrid Observability
LogicMonitor’s Layered AI approach ensures that intelligence and machine learning are baked into every facet of the LM Envision platform, helping IT teams improve efficiency, minimize alert fatigue, proactively predict trends, and maximize enterprise growth and transformation.
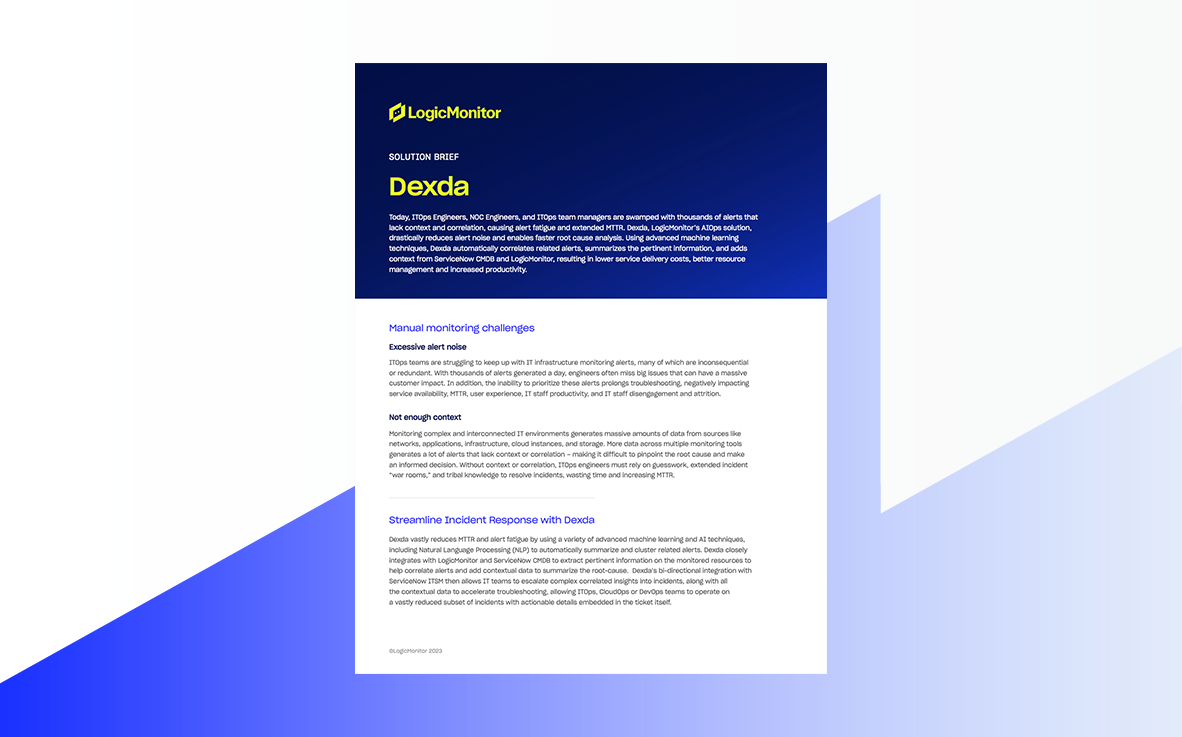
Dexda: AI for Hybrid Observability
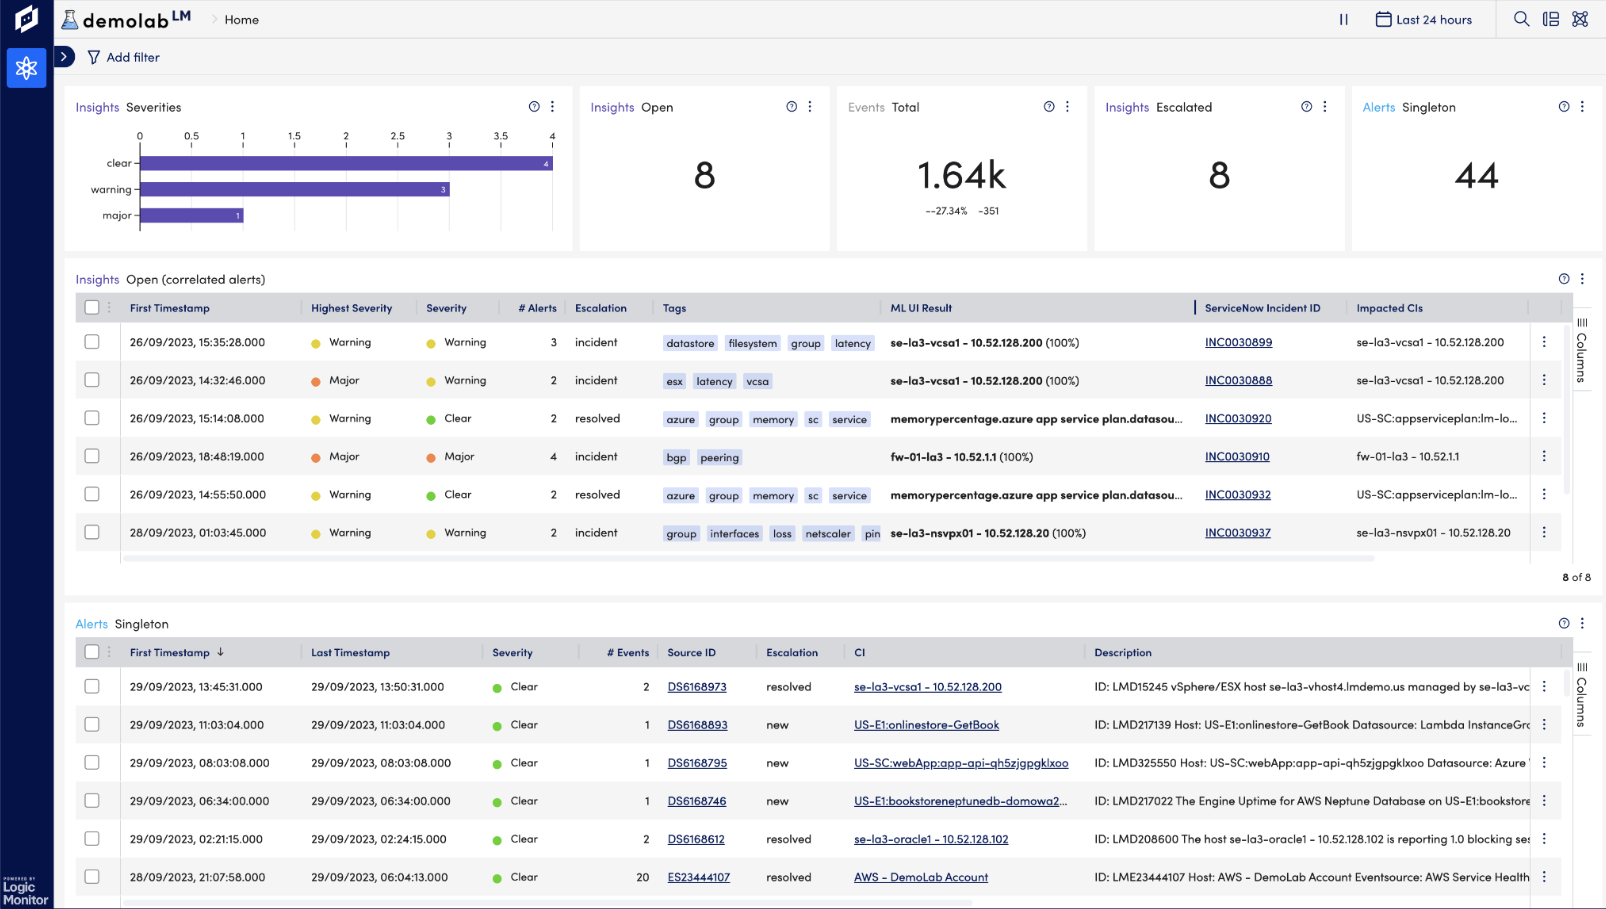
LogicMonitor’s enterprise capabilities, powered by Dexda, ingest events and seamlessly transform them into episodes to reduce alert noise by up to 80%.
Advanced machine learning techniques automatically identify features in the alert data to correlate the disparate alerts into connected insights based on time, resources involved, environment, and other significant features of the enriched alert data.
Using advanced machine learning and natural language processing (NLP) algorithms, Dexda helps ITOps teams effortlessly identify problems, determine the root cause of those problems faster than ever before, and prevent events from exploding into business-critical incidents.
The Dexda Difference
Quick Time to Value
Get started with Dexda immediately. Dexda employs out-of-box ML models with no need for training and includes a seamless integration with LogicMonitor. With multi-tenancy, Dexda is completely scalable and MSP-ready with correlations scoped to each tenant, so you can help your customer quickly identify incidents.
Explainable AI
With Dexda’s open and customizable machine-learning models, users can define their own correlation models to target the alert and enriched CMDB data that makes sense for their business. In addition, using Adaptive correlation, Dexda automatically re-clusters alerts when it identifies a more optimal clustering option. This avoids any delay in escalating insights to ServiceNow.
ServiceNow Ready
Dexda integrates seamlessly with the ServiceNow Incident module for full bi-directional synchronization of alerts in Dexda and incidents in ServiceNow. Dexda event episodes are enriched with ServiceNow CMDB information so responders have additional context for rapid problem identification and resolution.
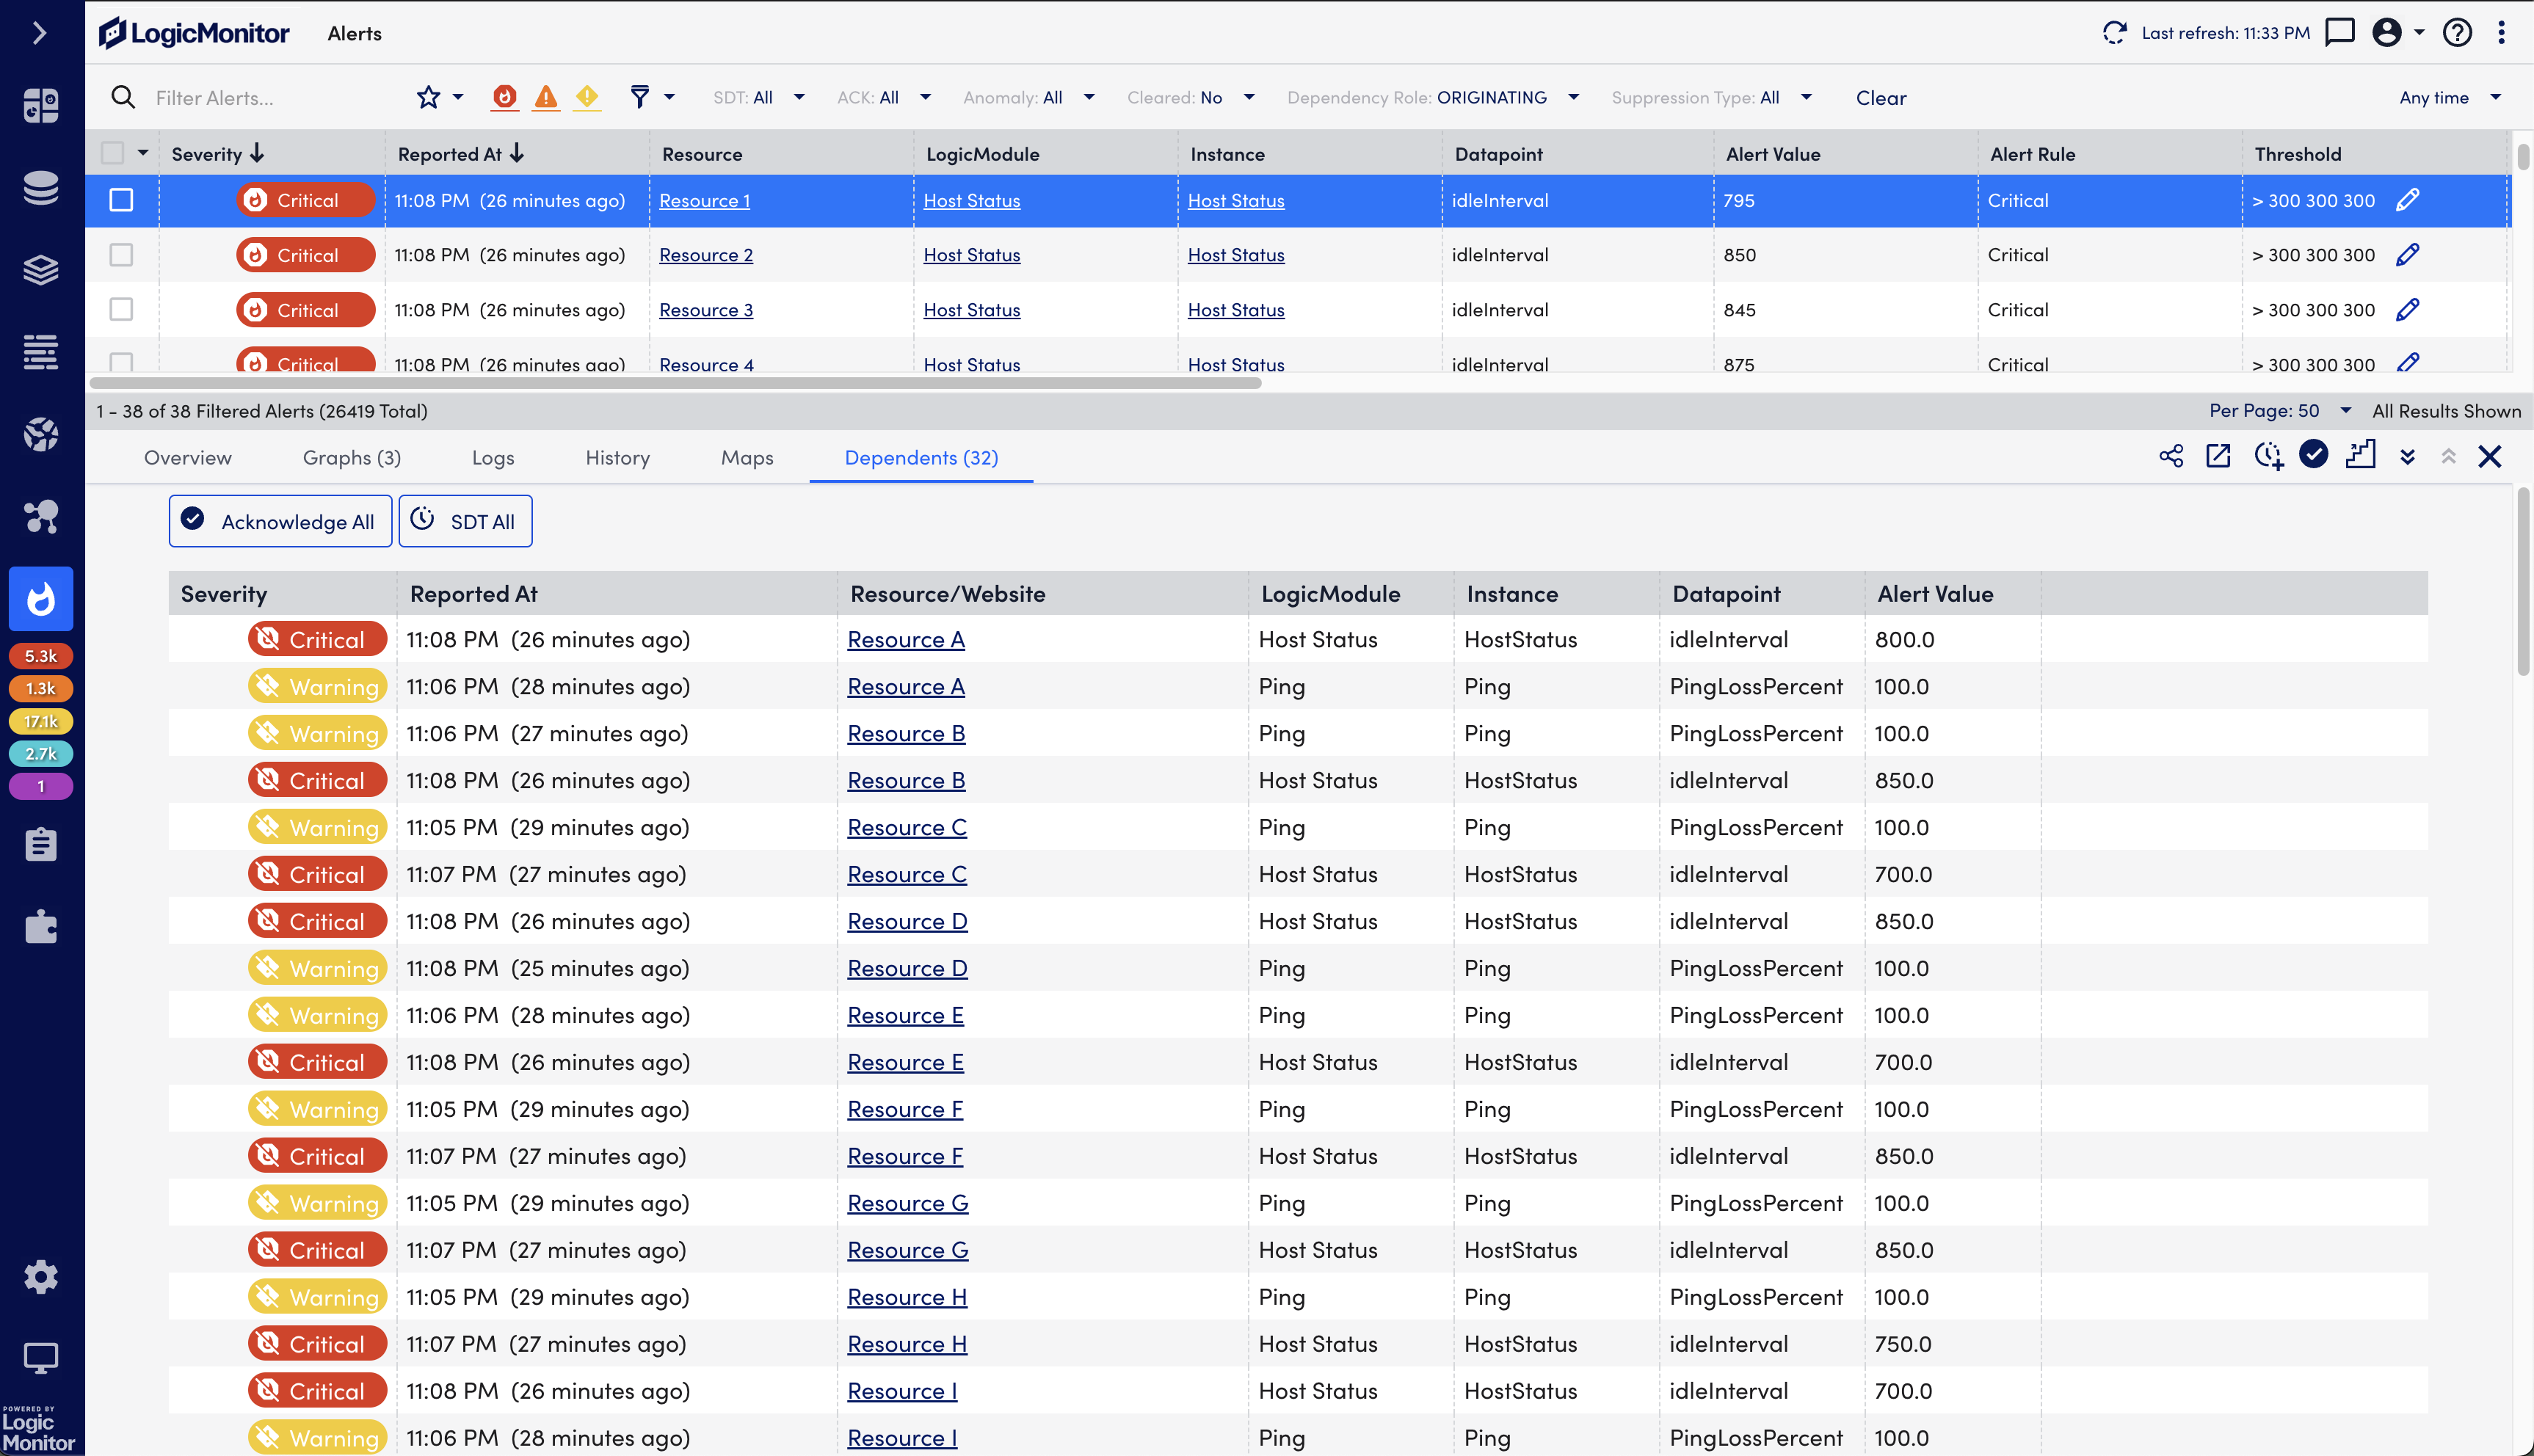
Adaptable Alert Clustering
Many teams struggle with too many alerts, especially when the same alerts are repeatedly created. Dexda clusters alerts using AI-driven methods across time, infrastructure and other items to convert hundreds of alerts into a single episode, which can be used to automatically open an incident in ServiceNow and get enriched with ServiceNow CMDB information to accelerate troubleshooting.
AIOps frequently asked questions
- What is AIOps?
AIOps, which stands for Artificial Intelligence for IT Operations, is a method for analyzing and displaying data for IT teams based on machine learning algorithms. The AI used in AIOps is often based on historical patterns coupled with current learned data trends.
- Is LM’s AIOps really using AI?
Yes. LogicMonitor’s AIOps goes beyond simple machine learning and pattern detection to learn and report based on individual relationships within each company’s tech stack.
- Does LogicMonitor use customer data to train their models?
For Dexda, the AI engine is pre-trained and the models do not combine data from other customers. In features like dynamic thresholds, we use your historical data but it’s only your data – we do not combine it with other customers’ private data.
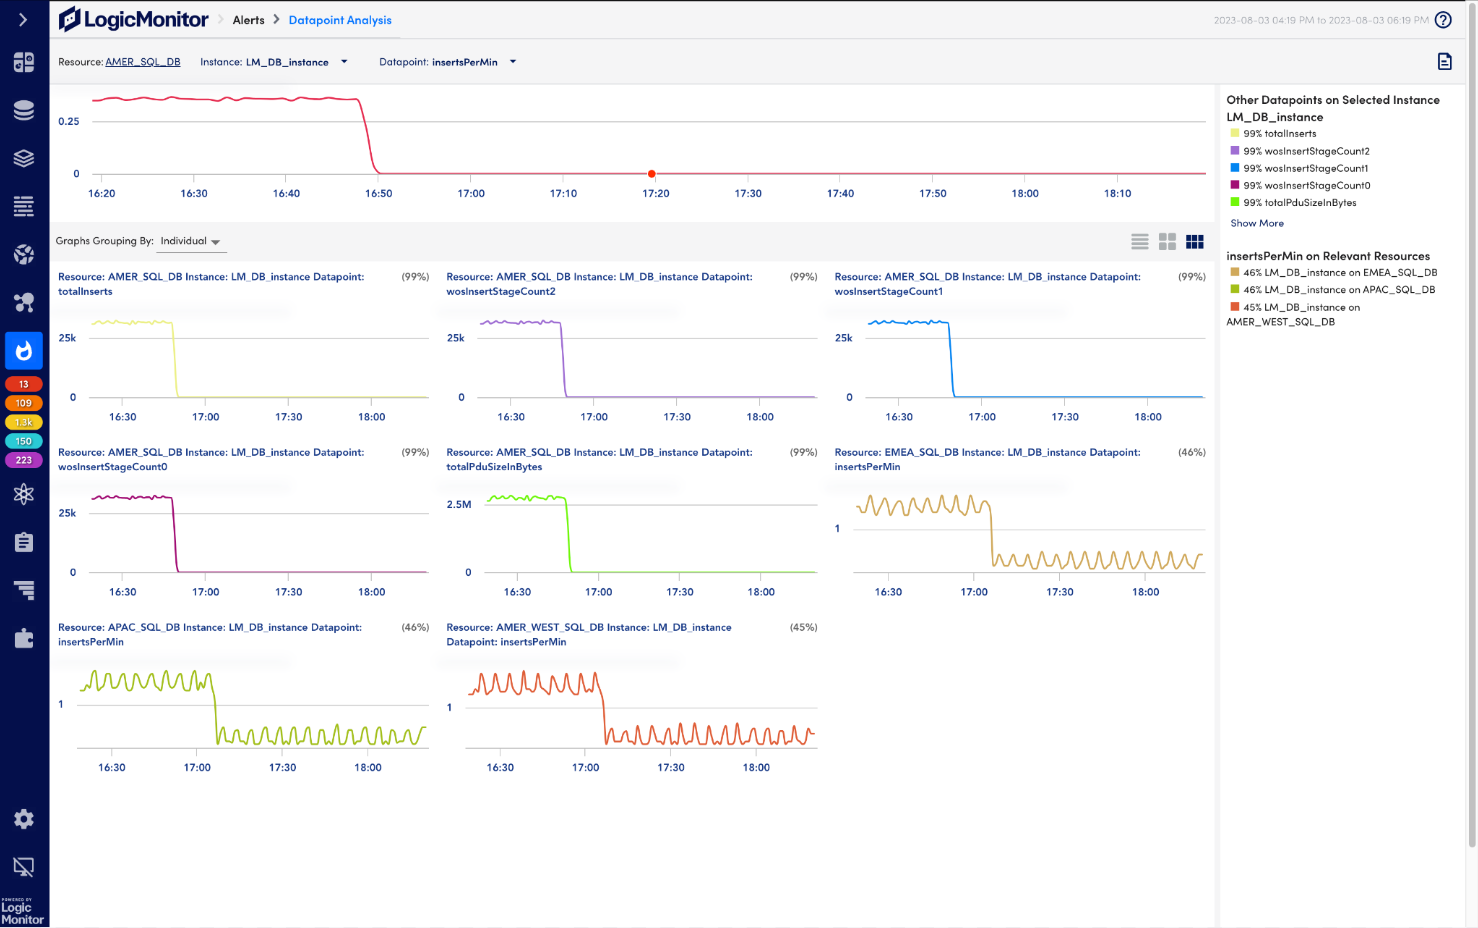
- What is root cause analysis?
Root cause analysis is the process of finding the core of an issue that caused a chain reaction effect ending in problems.
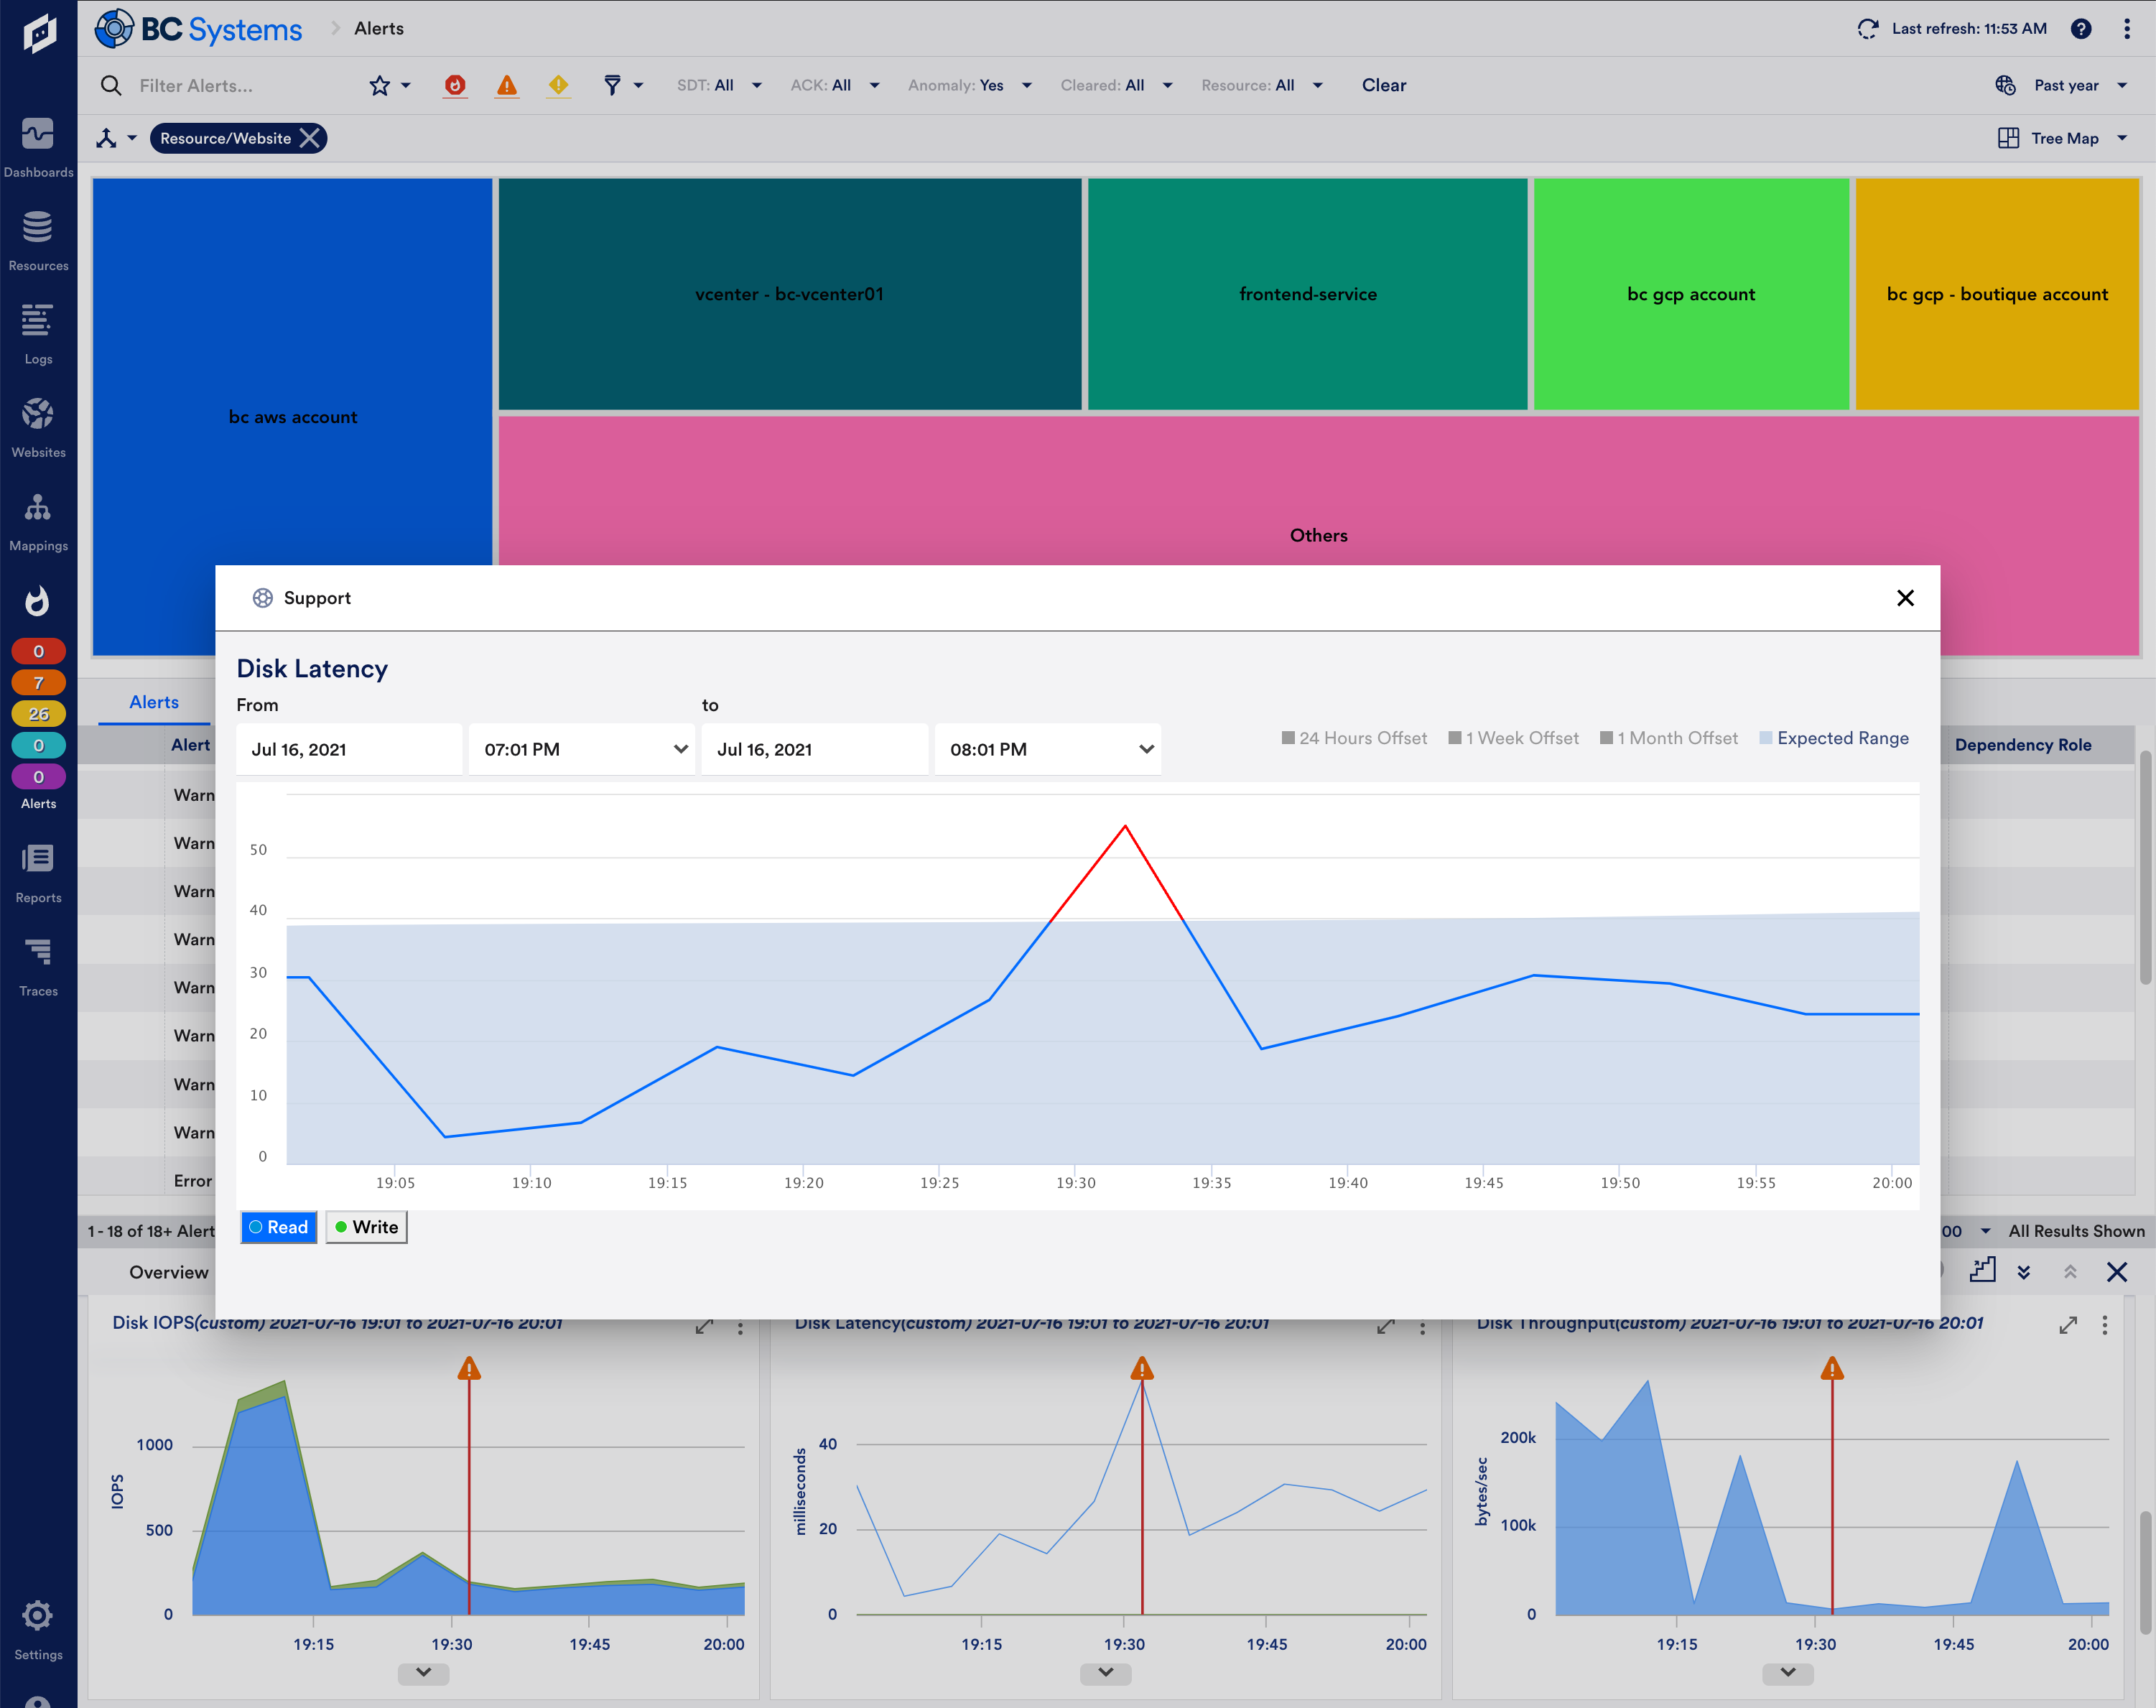
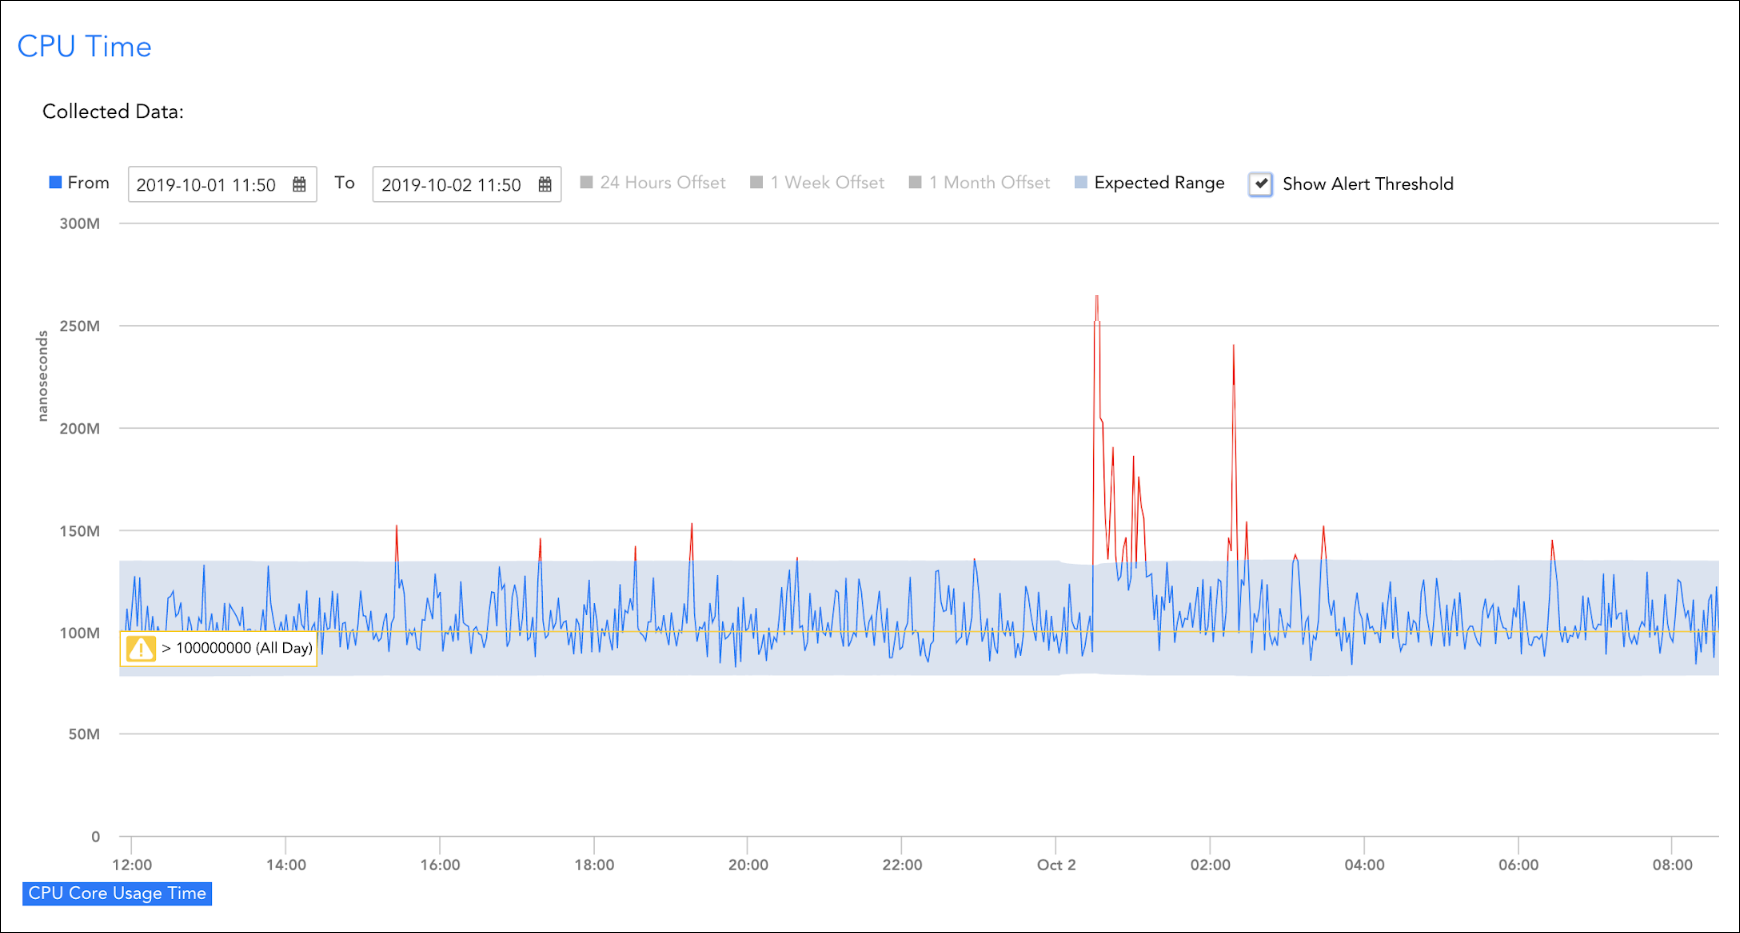
- What is anomaly detection?
Anomaly detection is the identification and notification of outliers within gathered datapoints. An anomalous datapoint is something that significantly deviates from a normal data range without reason.
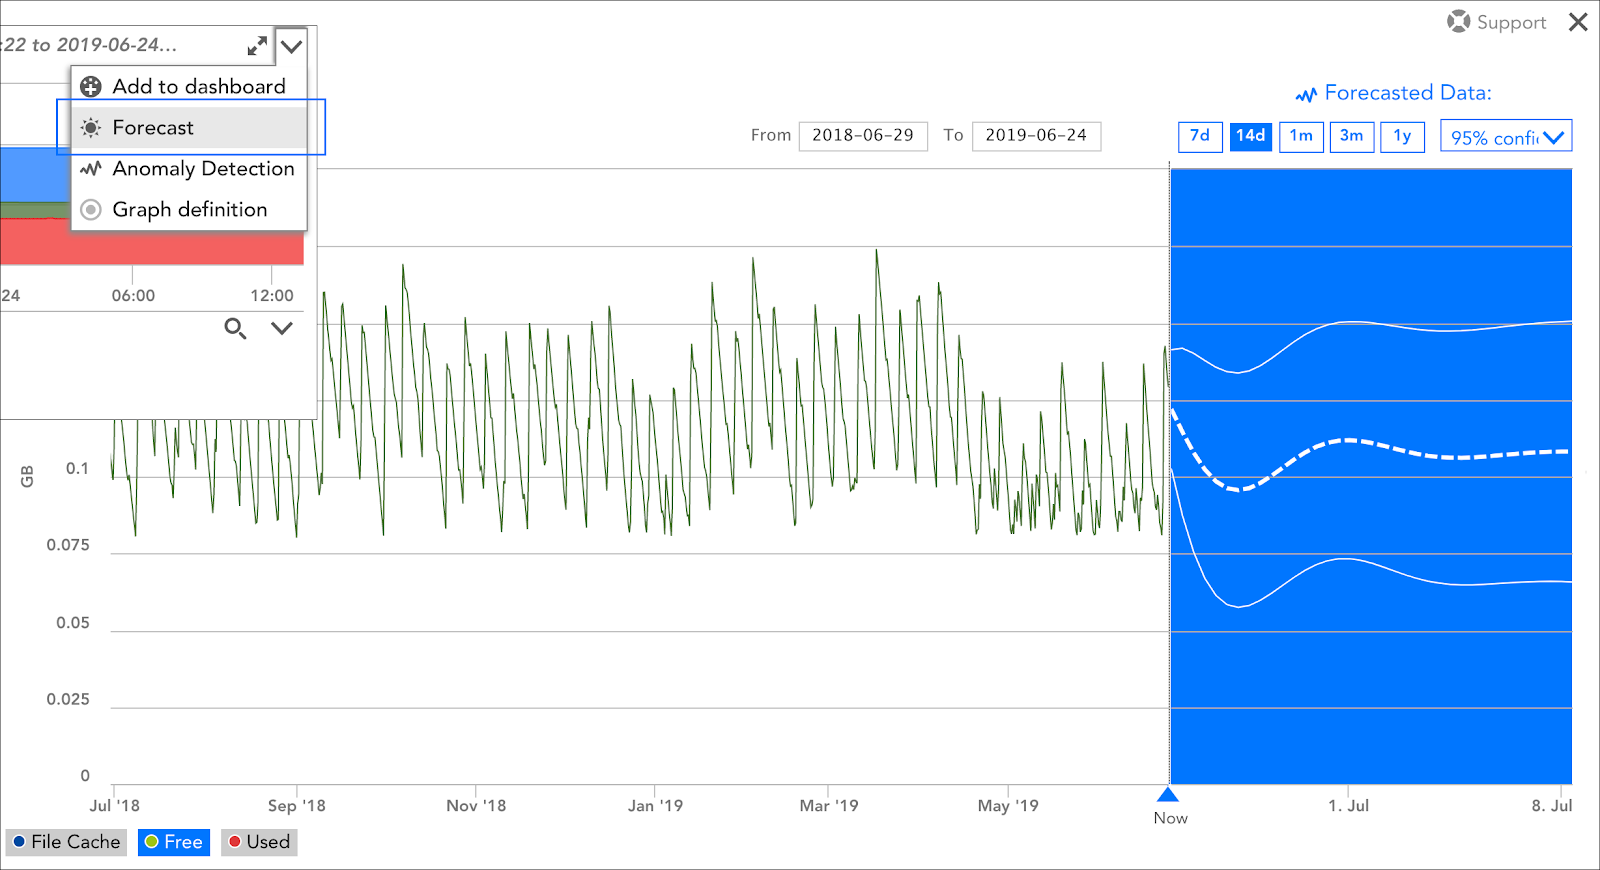
- What are dynamic thresholds?
Dynamic thresholds are dataranges that show an acceptable changing range of datapoints based on similar historical factors.
- What is machine learning?
Machine learning is the use of algorithms that improve automatically through historical analysis and experience.
- What is Dexda?
Dexda is LogicMonitor’s enterprise AIOPs event management offering. Dexda ingests events from the LogicMonitor platform and seamlessly transforms them into episodes. Advanced machine learning techniques automatically identify features in the alert data to correlate the disparate alerts into connected insights based on time, resources involved, environment, and other significant features of the enriched alert data.
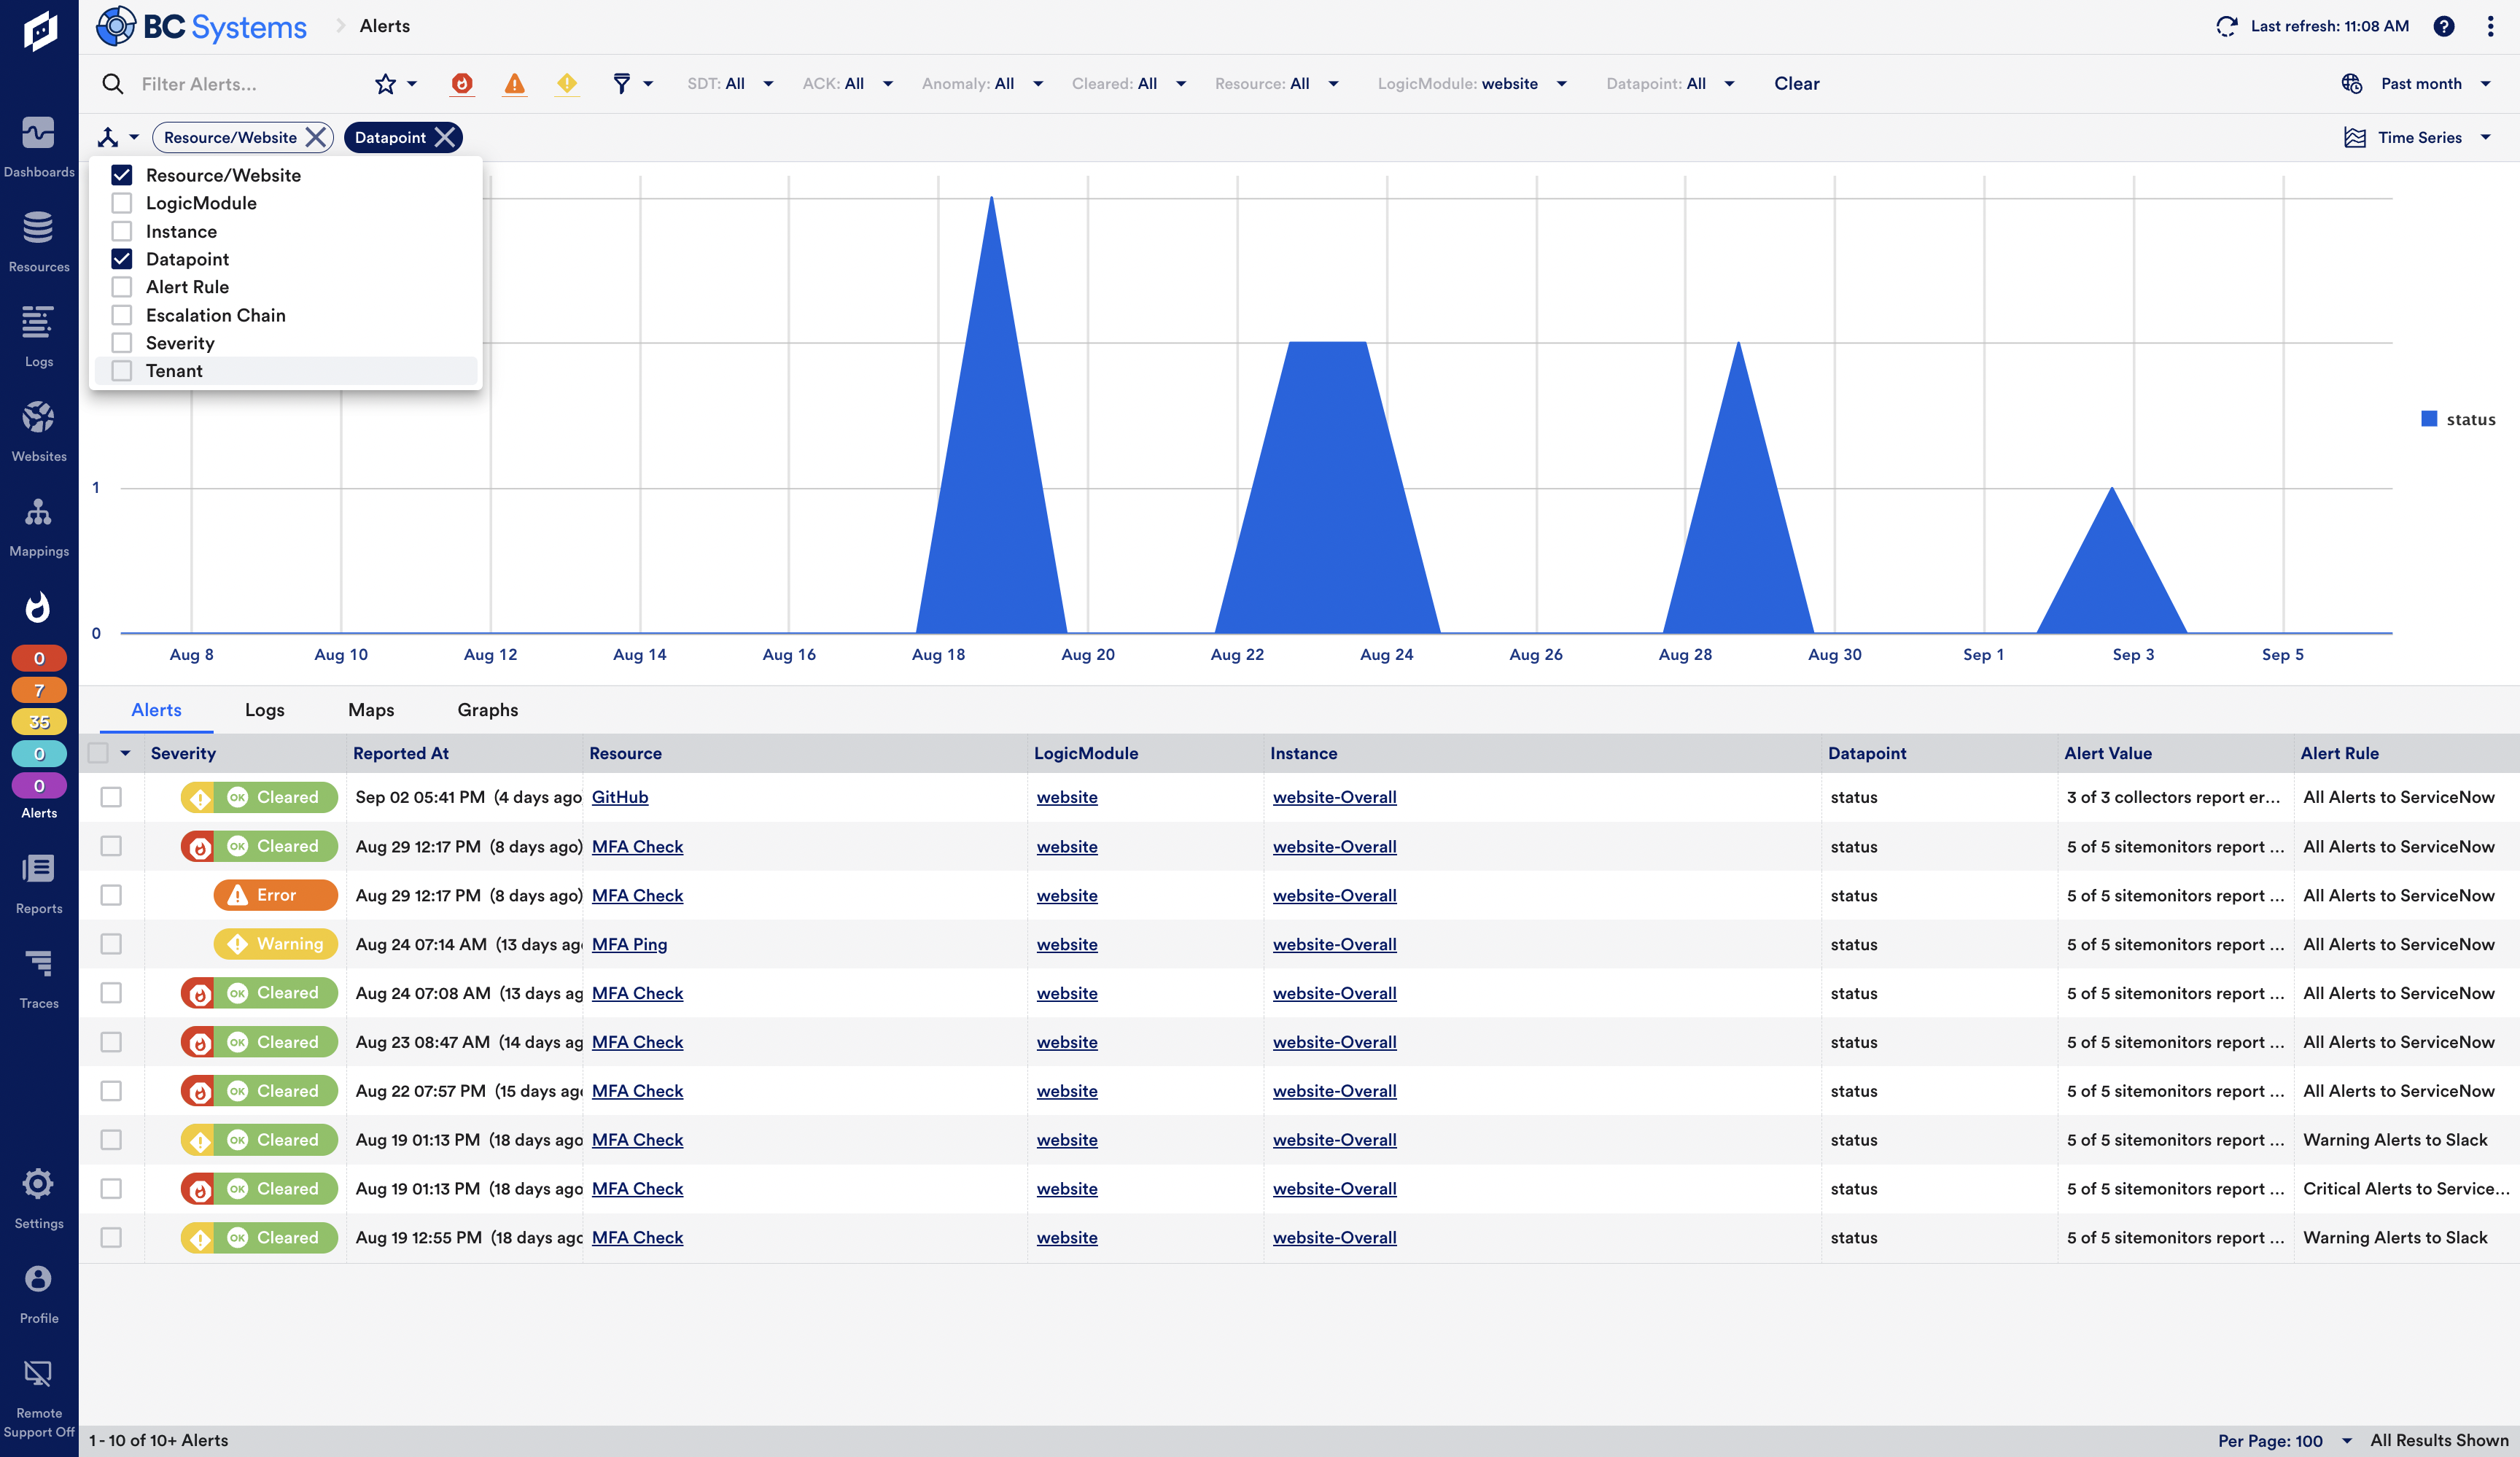
- What is event clustering?
Event clustering automatically groups event alerts in a correlation into their most succinct form, vastly reducing the time it takes for support teams to reason about the mass of alerts. Effective event clustering can reduce alerts by over 97%.