
As 2019 comes to a close we would like to take a moment to pause and reflect on the various achievements LogicMonitor accomplished over the last year. All 16 product releases in 2019 are aligned to LogicMonitor’s mission to become the most comprehensive, extensible, and intelligent monitoring platform in the industry. To guide our mission we have organized our product features into three distinct pillars – monitor, analyze, automate:
- Monitor everything. Agentless, out-of-the box visibility into traditional and modern infrastructure to stay ahead of issues.
- Analyze for intelligence. AI powered analytics that deliver contextual information to triage, troubleshoot and optimize IT.
- Automate action. API-centric design allows easy integration and the ability to trigger the right response based on trusted data.
Let’s take a moment to highlight key features we released in 2019:
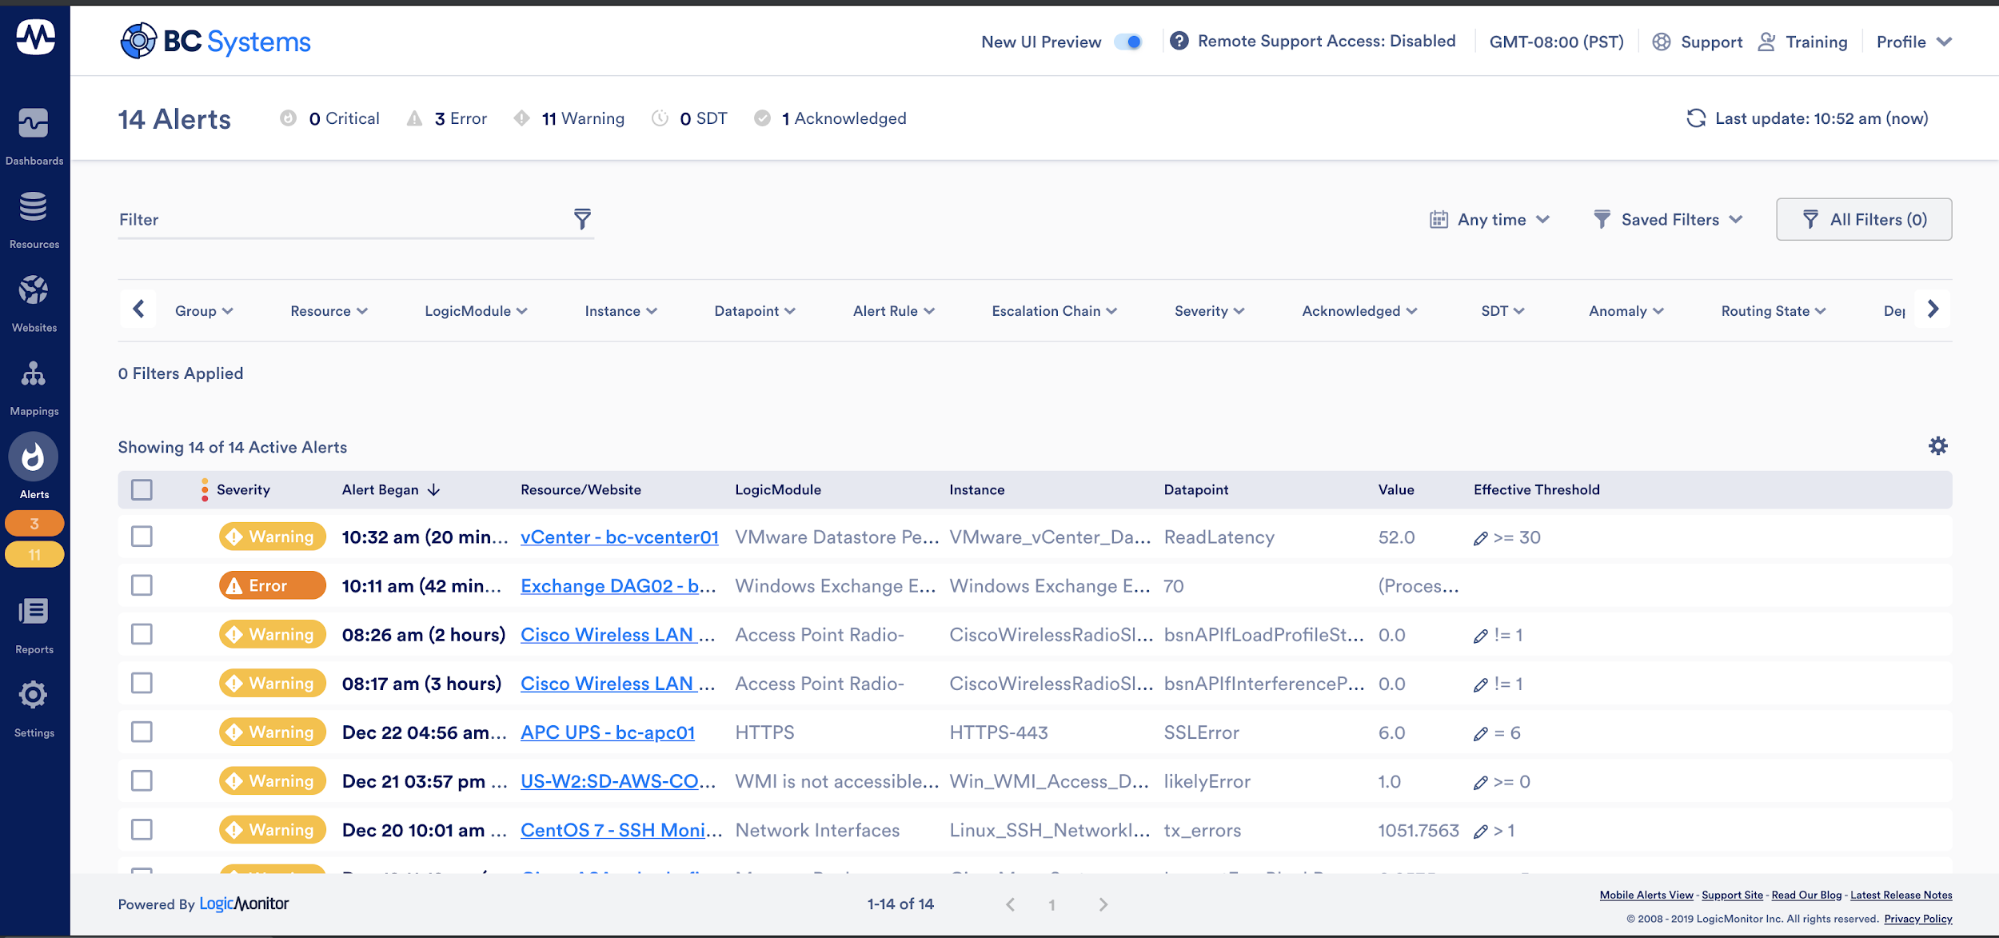
New User Experience
We started 2019 with the goal of modernizing LogicMonitor’s UI by the end of 2020. We conducted extensive research and recruited more than 60 customers to help us understand their current and future usage of monitoring workflows with the goal of optimizing detection and resolution time. Released in v.126, LogicMonitor’s new UI maintains full parity with the features and functionality you use today but will bring new functionality and enhance the user experience while adhering to basic UX principles.
Monitor Features
The goal of the monitoring pillar is to monitor everything from the network to the cloud to provide the best monitoring in the industry.
On-Premises Monitoring Coverage
In 2019 we added more than 500 LogicModules to the core platform including metric, event, configuration, and topology DataSources. A few notable capabilities released were in the domains of SD-WAN (Viptela, etc.), Unified Computing Systems, NextGen Firewalls, Remote Sessions, and Kubernetes.
Cloud Monitoring Coverage
We added coverage in v.116 for all three major cloud providers – AWS, Azure, and GCP and released billing monitoring so that you can see exactly what you are paying for and optimize cloud architectures for cost/performance/uptime benefits.
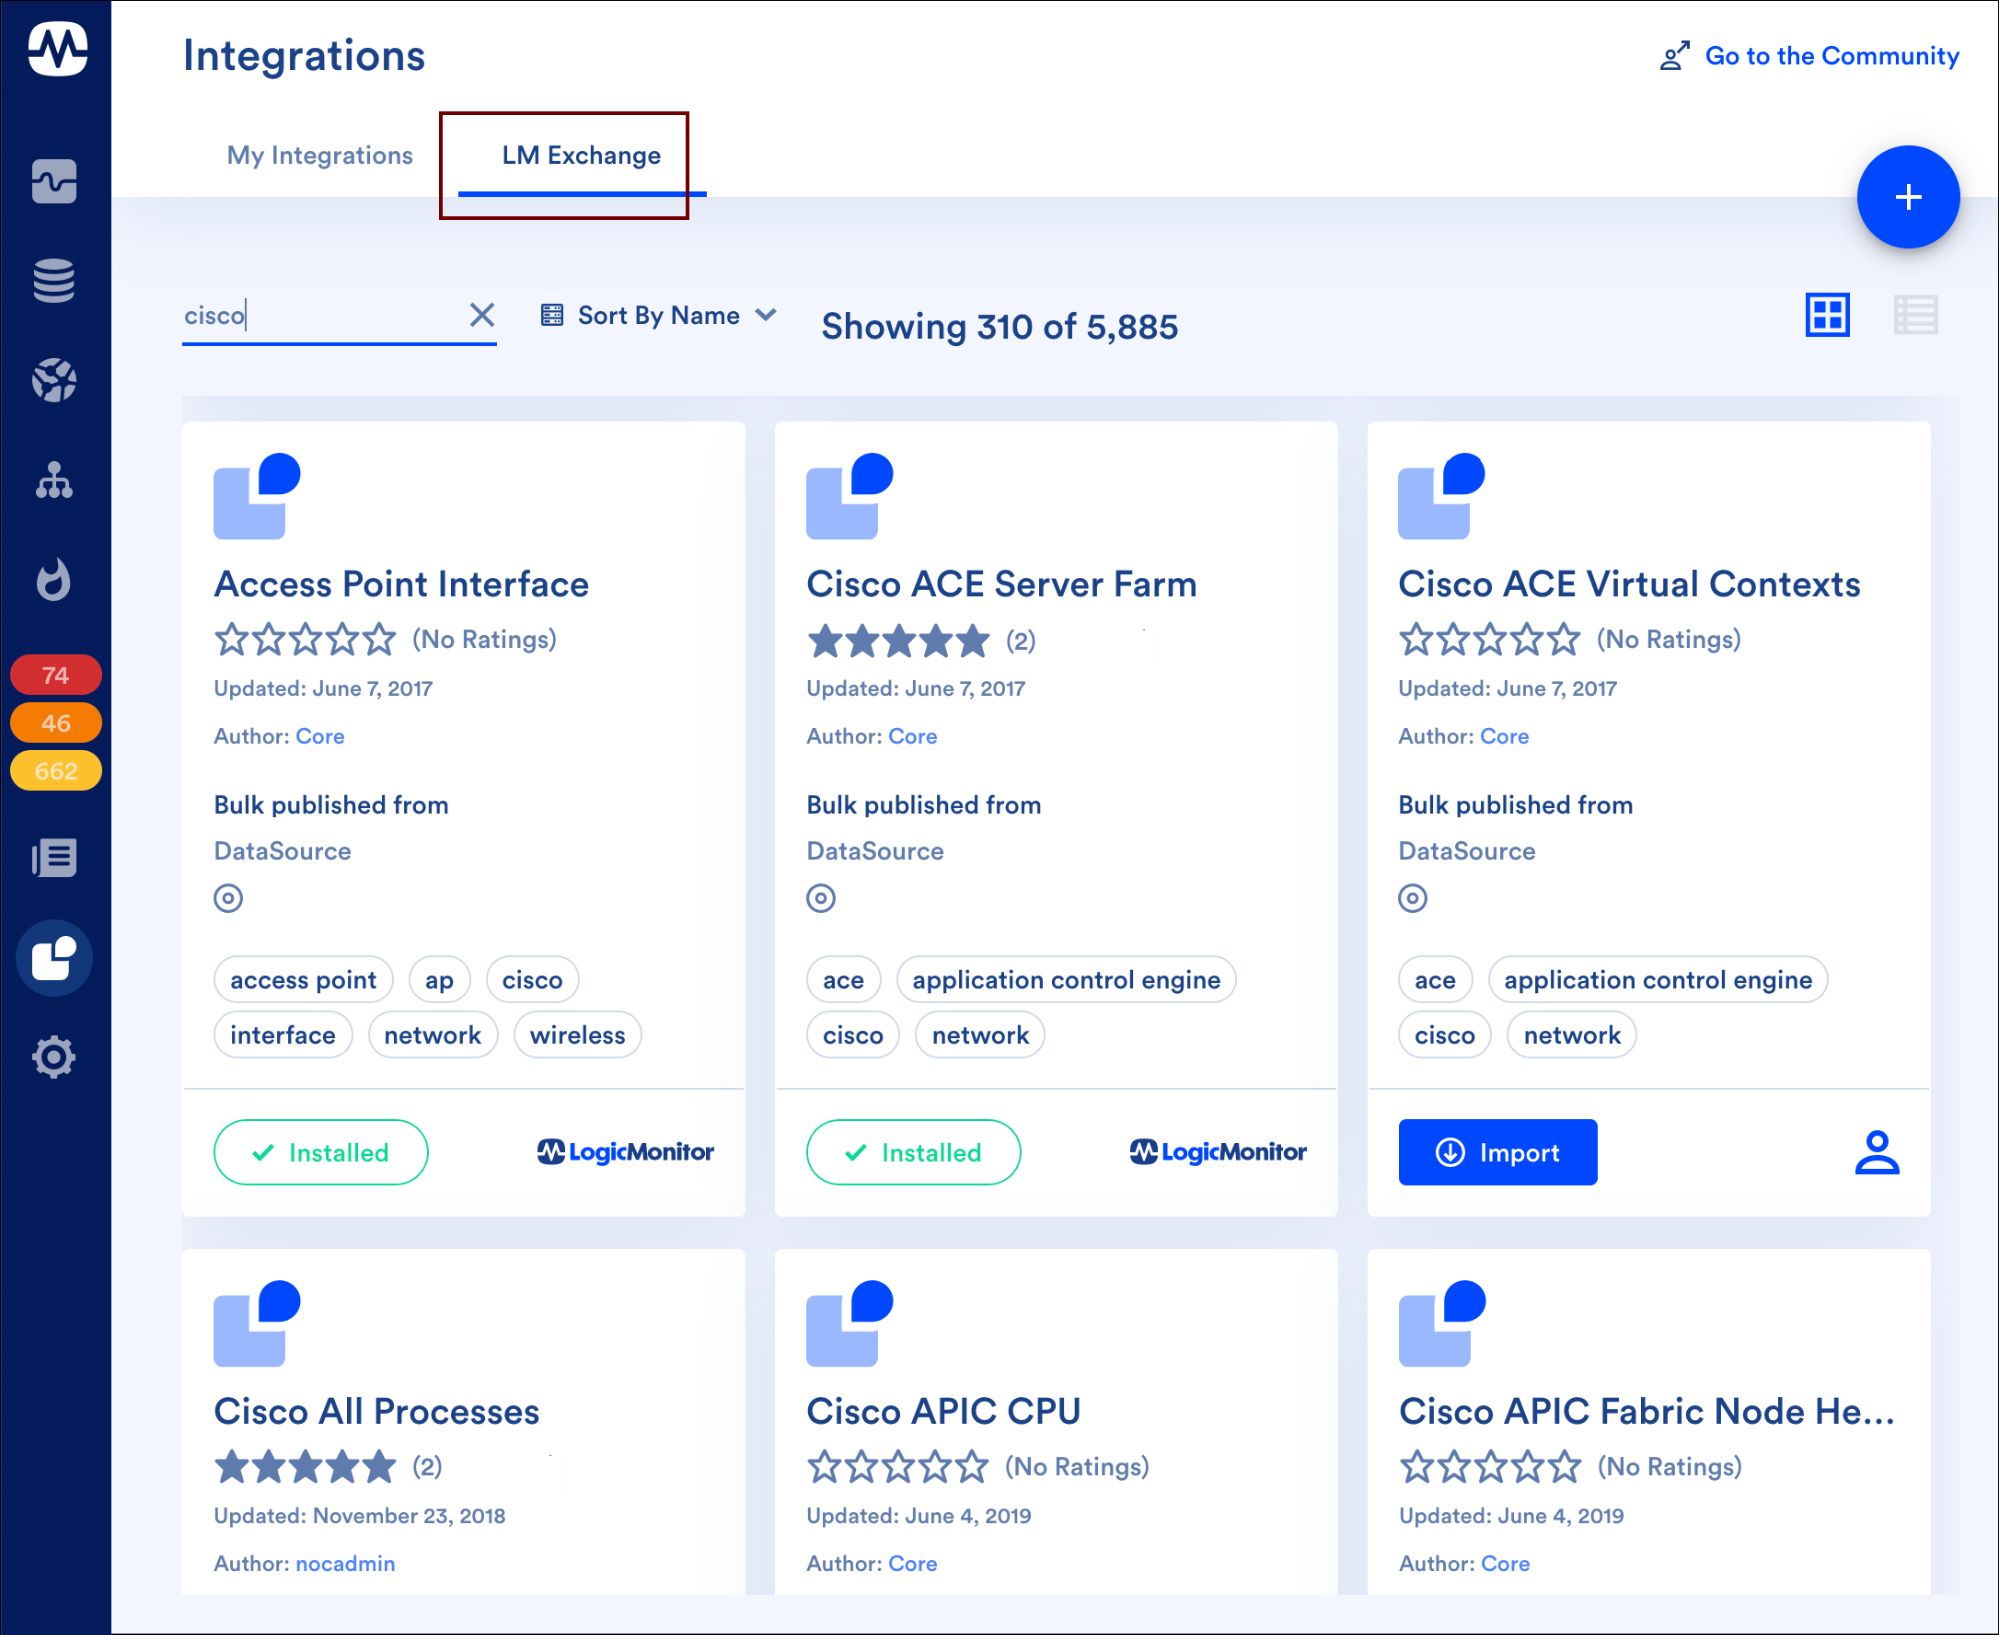
LM™ Exchange
With LM™ Exchange (currently in beta), we are building a LogicModule community where users can share their LogicModules in a marketplace-like environment.
Analyze Features
The goal of the analyze pillar is to derive intelligence from data for faster and better decision making.
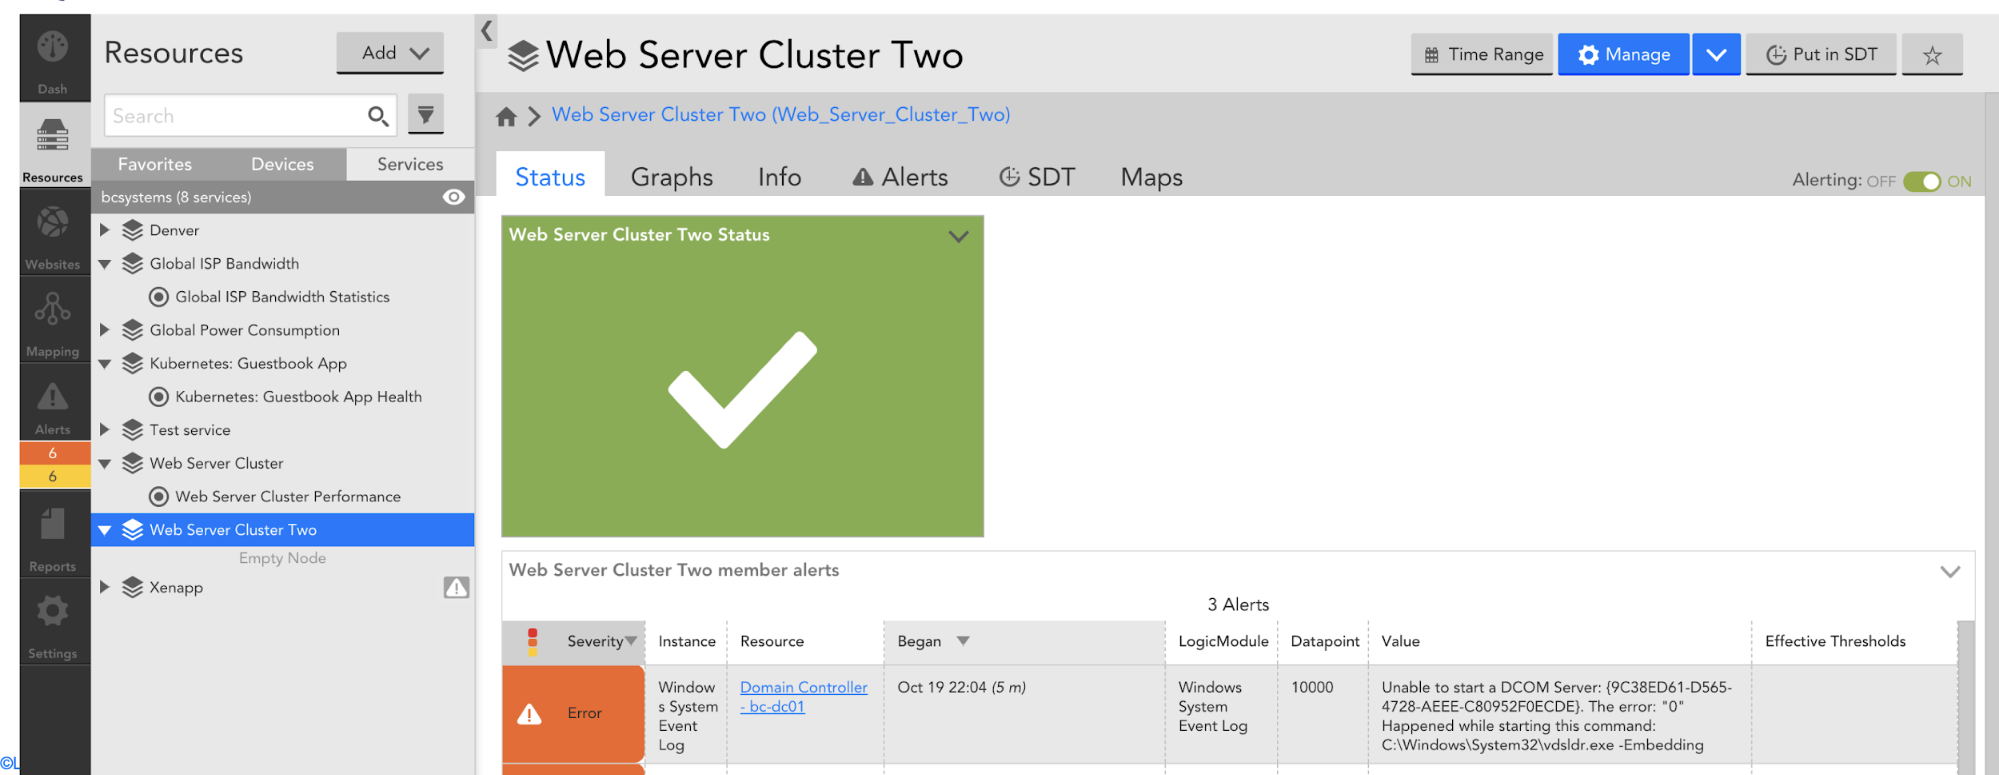
LM™ Service Insight
LM™ Service Insight, released in v.115, allows you to group together instances across one or more monitored resources (e.g. devices) into a logical “service”; aggregate service level indicators (KPIs) across these instances to obtain service level data; and monitor, visualize, and alert on this service level data.
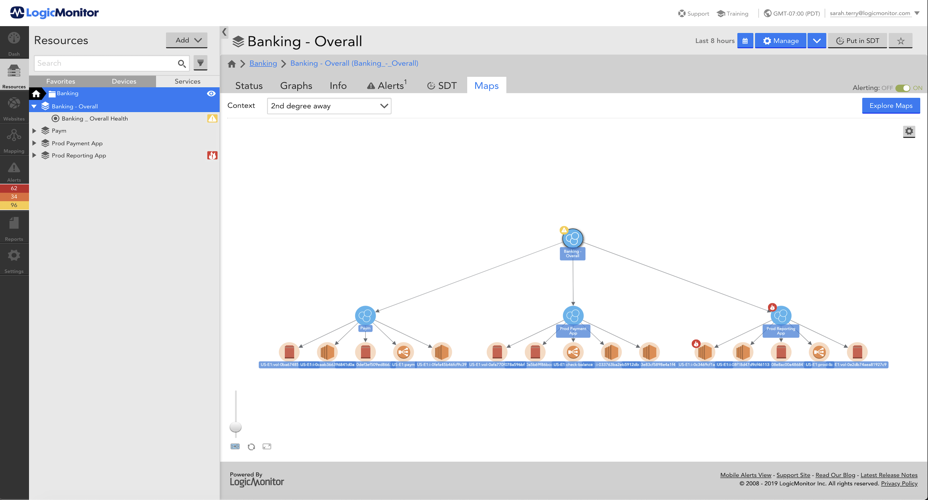
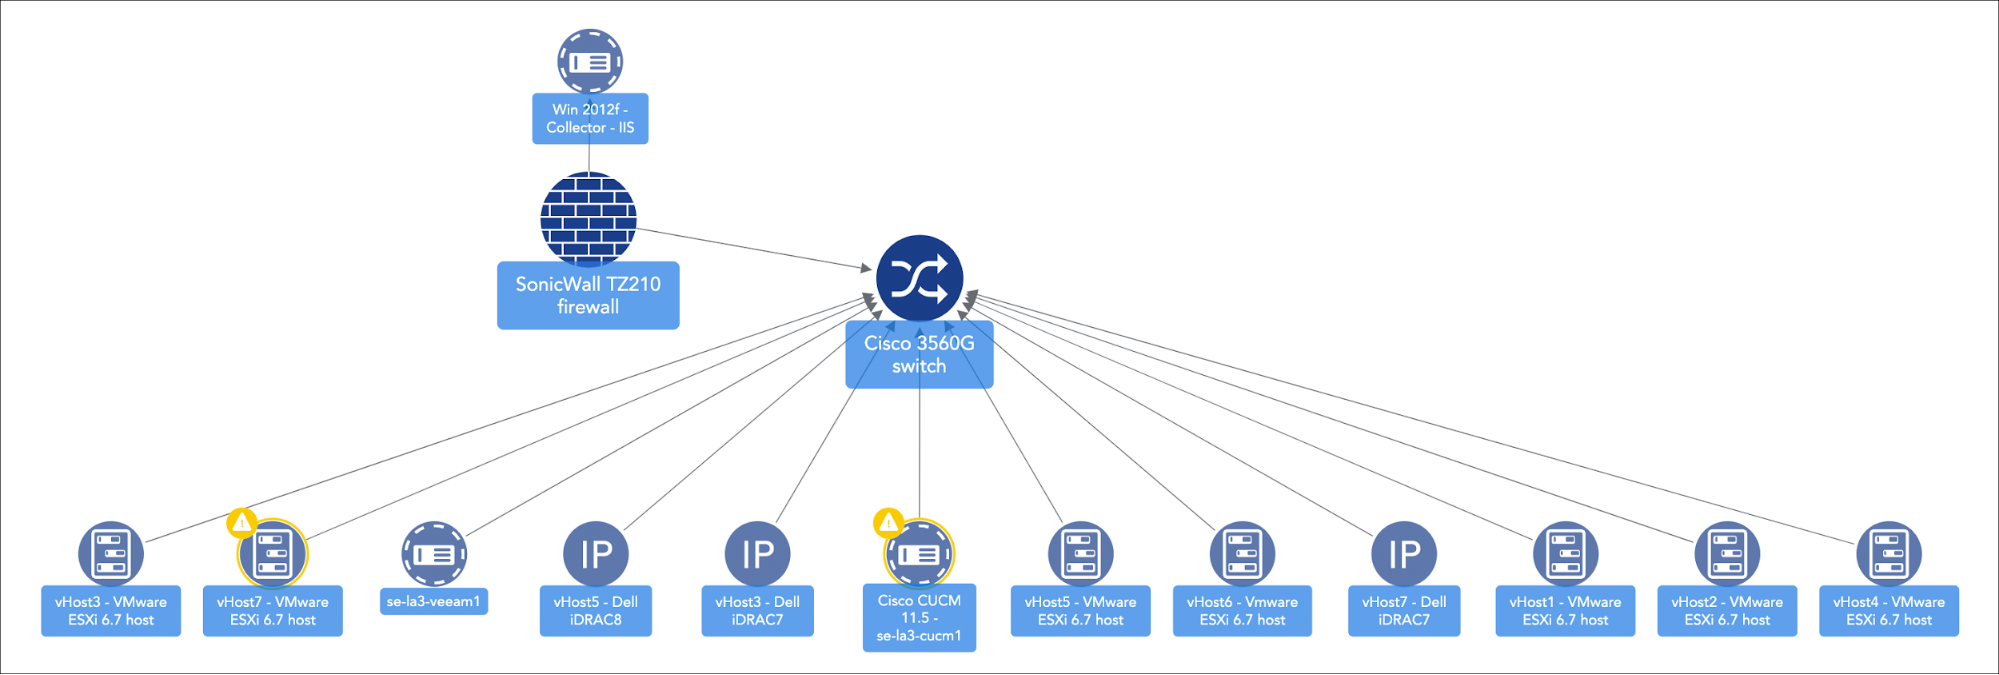
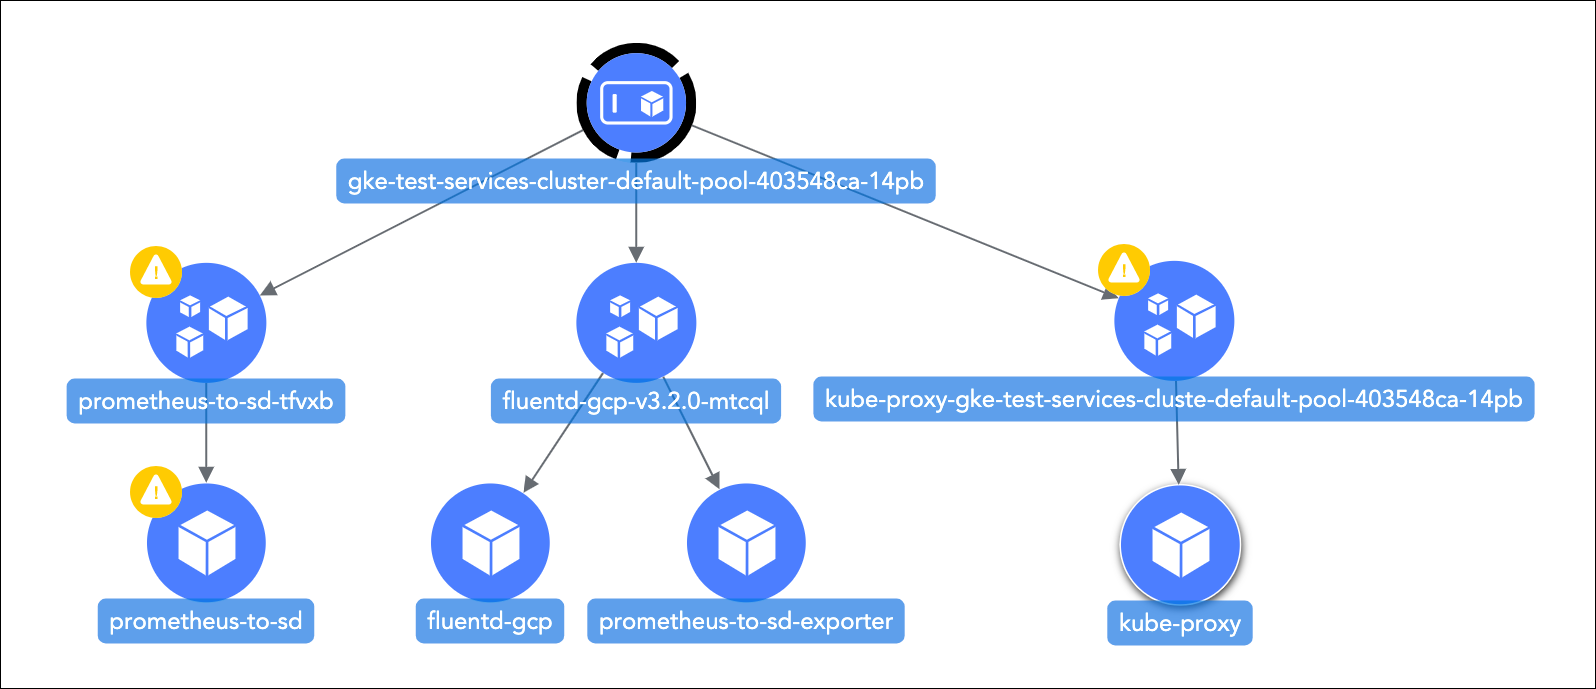
Topology Mapping
Topology mapping, released in v.125, is the visual representation of relationships among elements within a communications network. Topology maps can represent the physical location of network components, generally referred to as layer 1 mapping, or they can represent the logical relationships among elements, referred to as layer 2 mapping. LogicMonitor will continue to release additional enhancements to Topology throughout 2020.
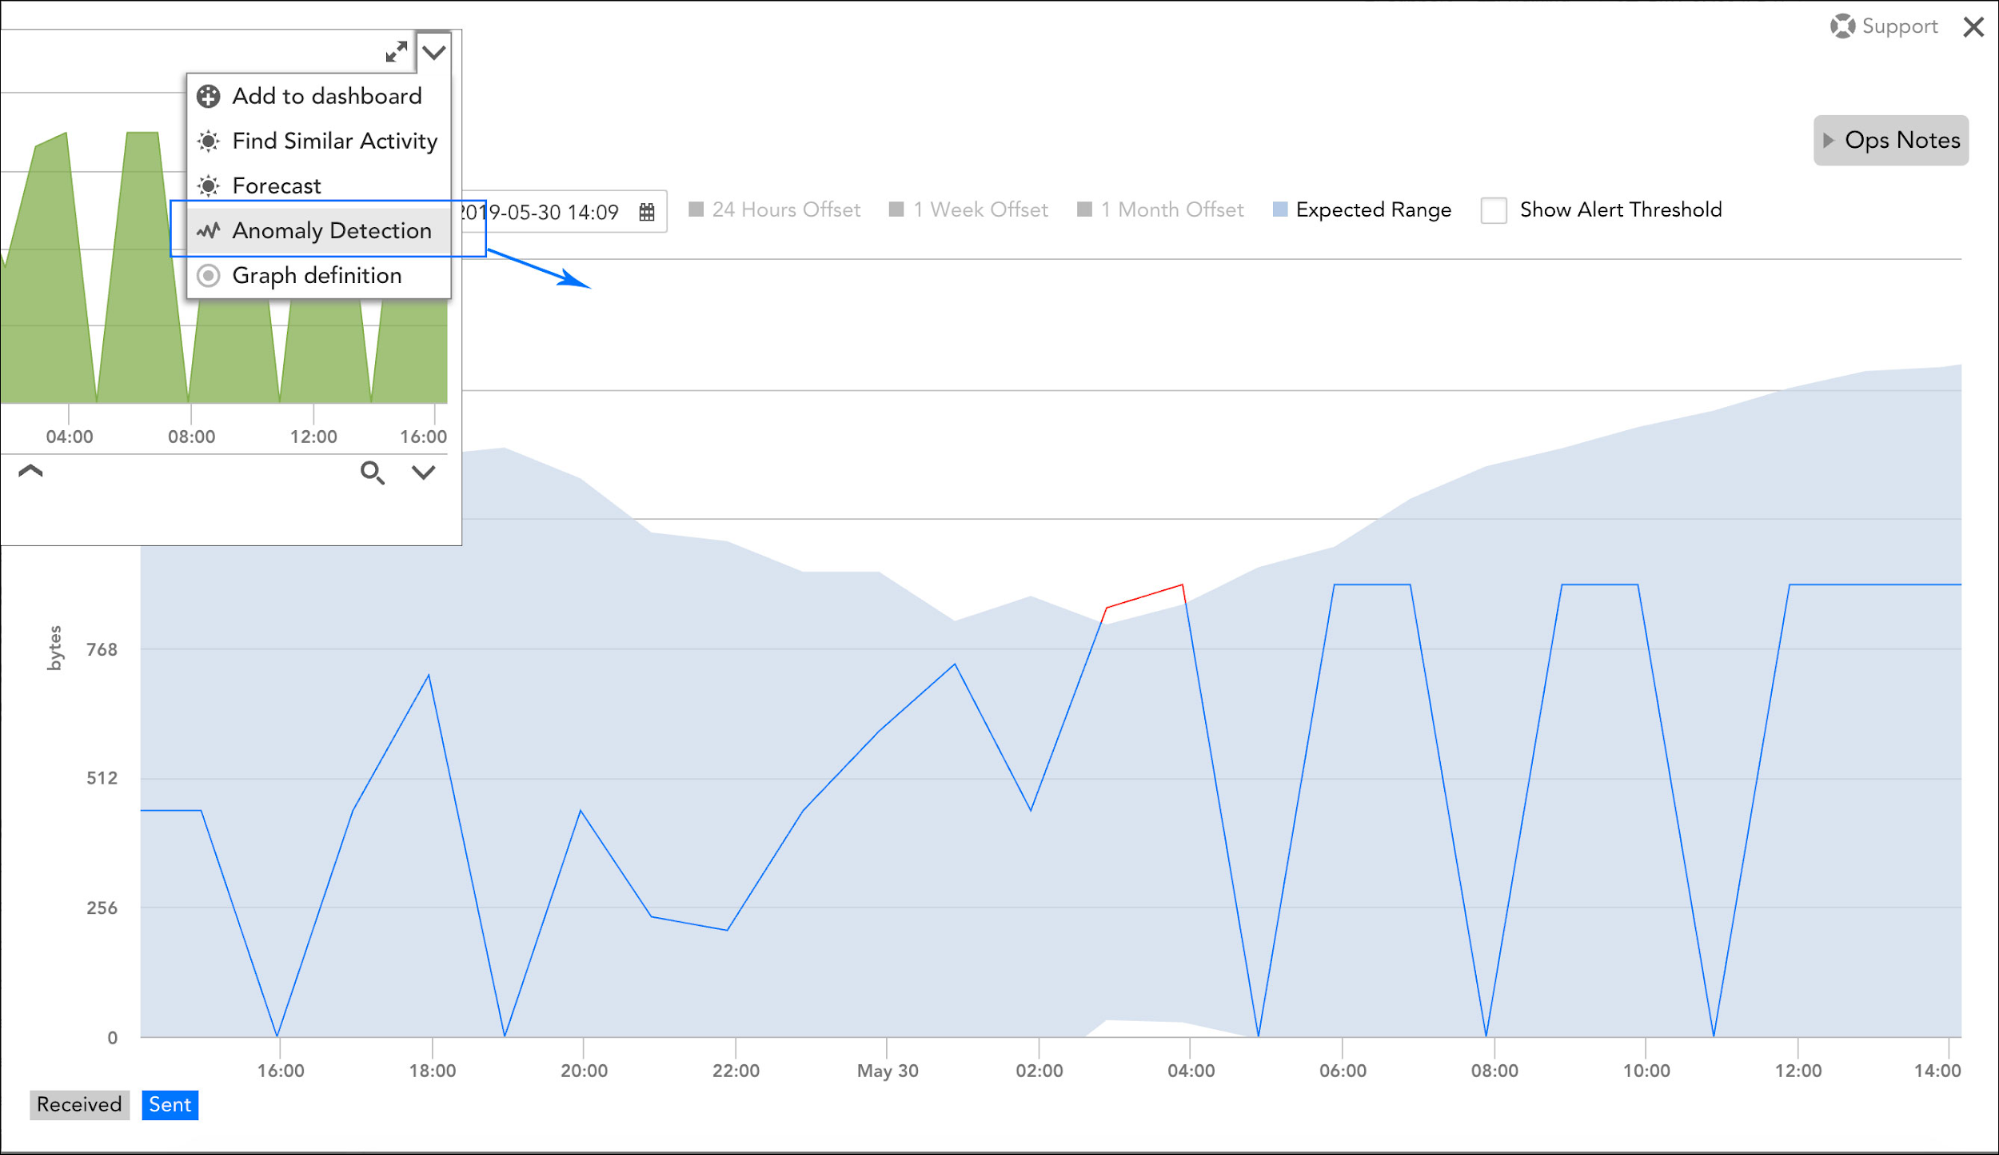
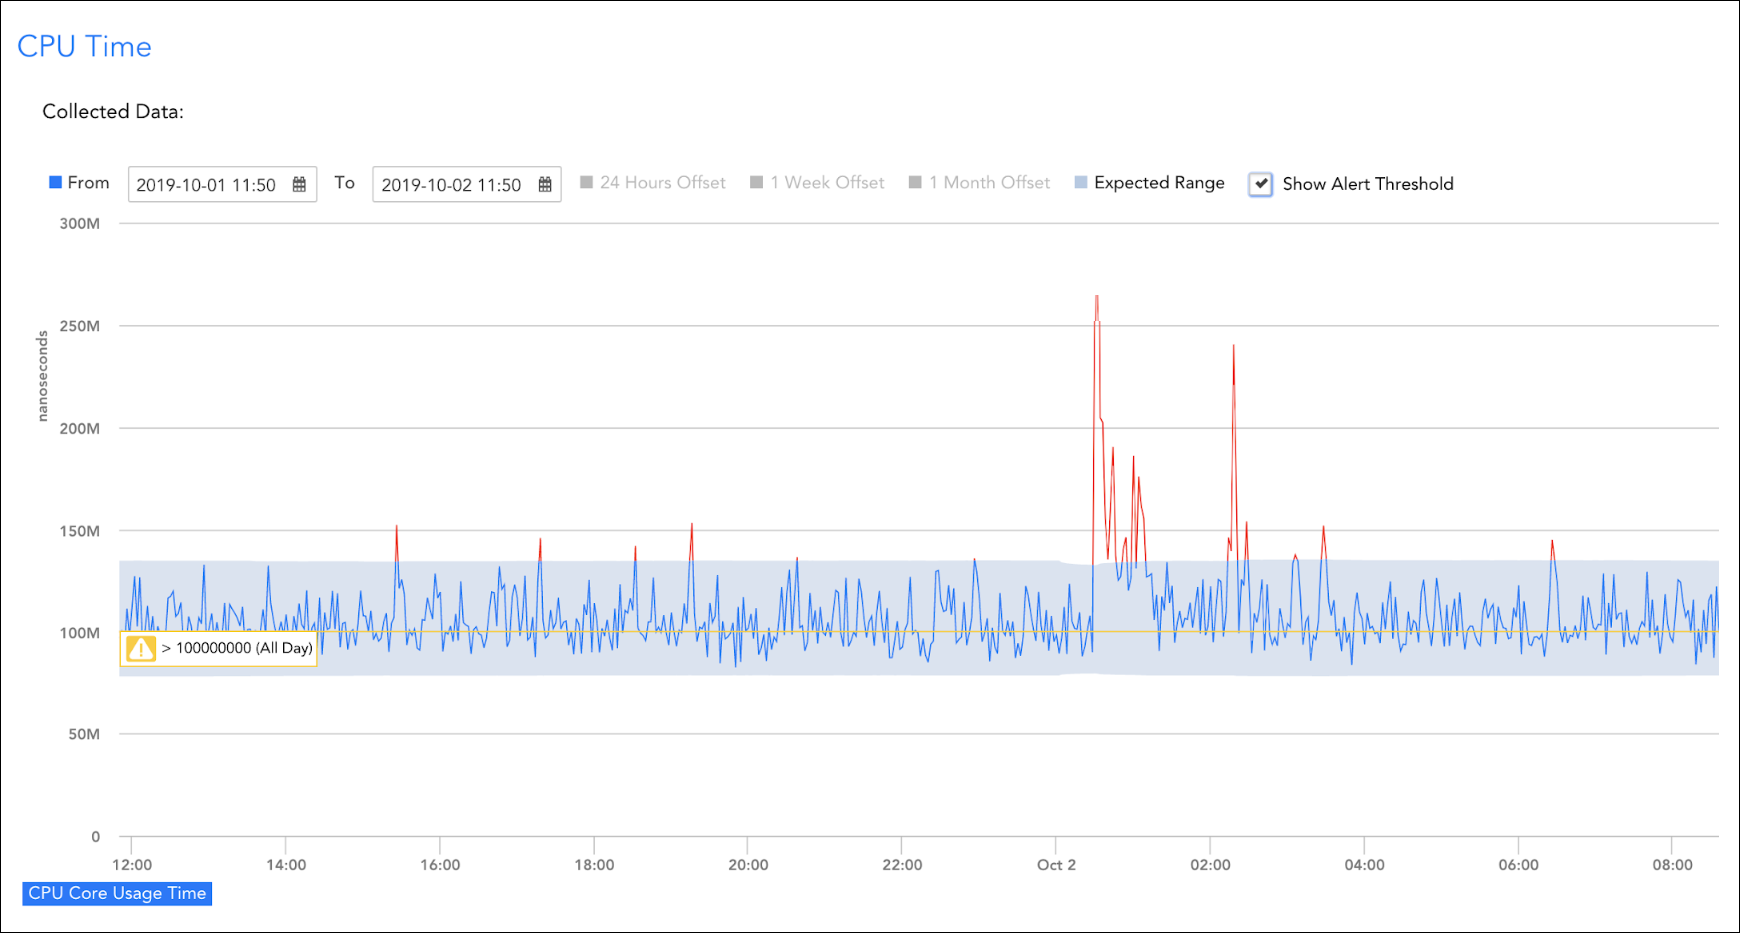
Anomaly Visualization
Anomaly visualization, released in v.121, allows you to visually identify data that does not conform to expected patterns and potentially catch issues before they escalate into more severe events.
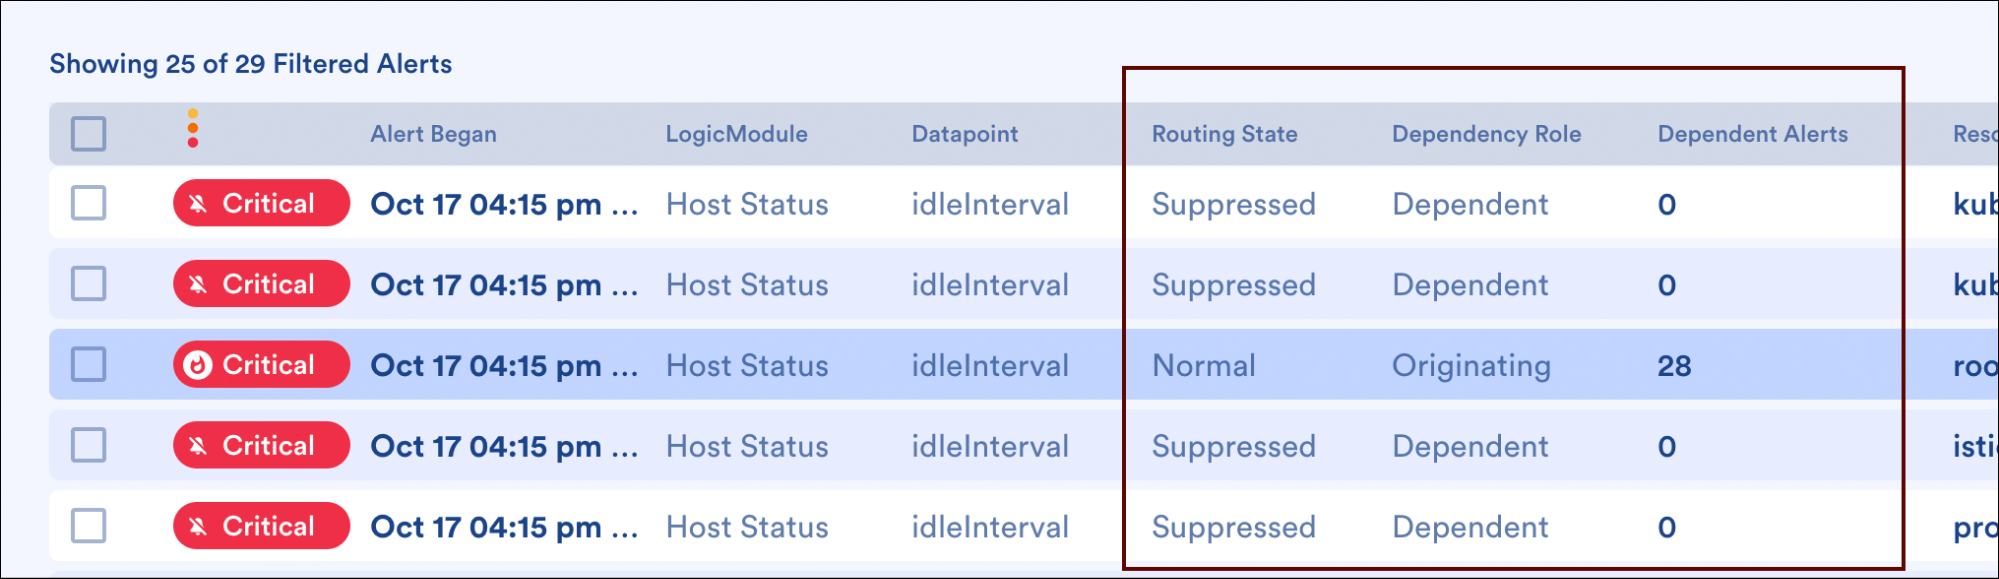
AIOps Early Warning System (Phase One)
Several of LogicMonitor’s ongoing AIOps initiatives converged in release v.128 provide sophisticated alert intelligence that reduces alert noise and allows users to focus on only those alerts that require action.
Root Cause Analysis
Root cause analysis leverages the auto-discovered relationships among your monitored resources (as discovered by LogicMonitor’s topology mapping feature) to determine the root cause of an incident that is impacting dependent resources.
Dynamic Thresholds
Dynamic thresholds represent the automatically learned bounds of an expected data range for a particular datapoint. These thresholds are based on anomaly detection algorithms that evaluate the three days of historical data immediately preceding.
Automate Features
Automate pillar enables users to integrate LogicMonitor into their enterprise ecosystem in building complete automation workflows through REST APIs and Webhooks.
ServiceNow App
In v.116, we released an out-of-the-box integration with ServiceNow CMDB (available now as an add-on feature). Key features of this new integration include bi-directional data synchronization to ensure a reliable and up-to-date CMDB, and enriched alerting data for quicker mean-time-to-resolution for incidents critically affecting business. By integrating LogicMonitor and ServiceNow CMDB, customers gain full visibility into their IT ecosystems, from infrastructure to applications. The certified LogicMonitor CMDB Integration app is available on the ServiceNow Store.
Looking Ahead to 2020
The above provides a brief review of what we released in 2019. In 2020, we will be taking the LogicMonitor platform to a whole new level by rolling out additional capabilities:
Monitor
Cloud Coverage – In 2020, we plan to significantly expand our cloud coverage in alignment with the needs of today’s complex hybrid enterprises.
On-premises Coverage – In 2020, we plan to not only continue to lead in the hybrid coverage but also enhance our Netflow Analytics.
Push Metrics – We will be adding the ability to push any metric from anywhere into LogicMonitor through an open REST API. This will help developers stream business-related metrics into LogicMonitor and get the benefit of correlating application and infrastructure intelligence in a unified platform.
Analyze
In 2020, we plan to enhance the AIOps Early Warning System by adding more sophisticated features that help detect signal from noise for faster troubleshooting. Our Data Science teams are creating and optimizing AI/ML algorithms that learn patterns in the data collected by LogicMonitor.
Automate
In the Automate pillar, we plan to add the ability to create basic rules on metric thresholds and in-turn execute a script or an already integrated API of another product from within LogicMonitor. The goal is to make it easier to automate the execution of actions from within LogicMonitor in a repetitive fashion.
To learn more about these features get in touch with our team or submit a free trial request. Have a wonderful and fully monitored 2020!

