
Modern infrastructure has evolved from traditional full stack systems in on-premisess data centers to smaller, layered services that used to make up those full stack systems, allowing for management of supporting infrastructure to be abstracted away. This is the underlying phenomenon of cloud computing.
The cloud promises infrastructure without the burden of maintenance, and scalability without the time required to build out and configure servers. Such promises exist because the burdens of management are shifted to the cloud provider. This transfer of responsibility limits visibility making monitoring more challenging.
White box vs. Black box Monitoring
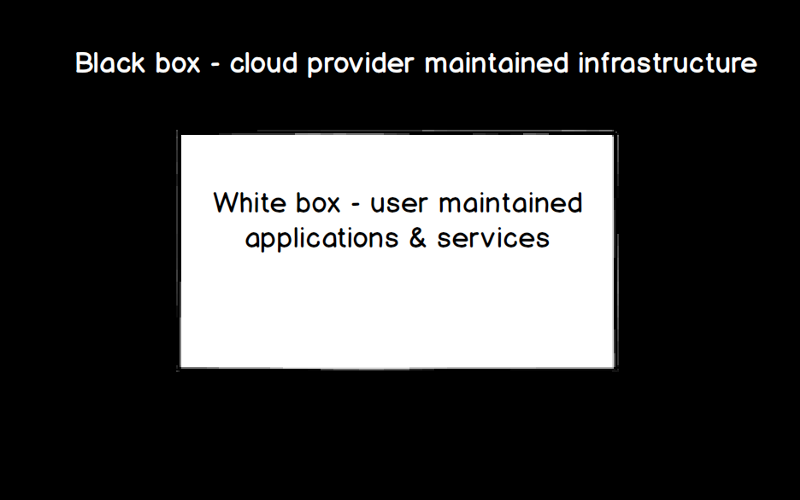
Traditionally, monitoring is classified as white box or black box monitoring. White box monitoring consists of monitoring metrics based on the system type (hardware, operating system, and/or running applications). Black box monitoring, on the other hand, involves monitoring metrics that are system agnostic.
White box monitoring isn’t always possible with cloud services, because system-specific information is not always available. For example, it’s not possible to know the details of the cloud provider-maintained system supporting your EC2 instance in us-east-1. But black box monitoring isn’t always enough, because the monitored data usually isn’t specific enough to provide a comprehensive view into service health. For example, simply knowing that your Load Balancer isn’t responding to its C Name doesn’t tell you enough to pinpoint the issue. If you then knew whether there were any backend errors or unhealthy hosts, you could identify whether the issue is with DNS configuration or the availability of backend web servers.
Cloud services can be viewed as a combination of both black box and white box systems, and therefore, complete visibility requires both:
Taking a closer look at monitoring the white box component: The performance of applications and services running in the cloud is typically the most critical to understand and monitor, as you’re likely trying to avoid a non-performant application for end users. This is resource performance monitoring, and it’s usually achieved with a white box monitoring approach, where metrics are specific to the resources they relate to. Usually the cloud provider exposes some amount of resource performance data (e.g. CloudWatch, Azure Monitor), and then sometimes there are application specific metrics collected in addition. Typically, the more your performance monitoring is tailored to the system type, the more specific alerts and performance issues will be, and the quicker you’ll be able to get to the bottom of performance issues.
Taking a closer look at monitoring the black box component: Availability of cloud-backed applications and services is dependent on the availability of the cloud provider maintained infrastructure. While not something you can likely correct for, the performance of your cloud provider can still have an impact on your application’s availability and performance as it appears to your end users. Availability can also be impacted by things like service limits or by scheduled events. This can be considered primarily black box monitoring, because we’re testing availability without knowledge of specific system details. We’re not provided immediate insight into how the cloud provider supports cloud services, and therefore don’t have access to test based on the details of that system. We can however, test the overall up/down availability of the system, for example by confirming a response to an API call.
Most of the time, there’s another monitored component: Billing. Monitoring cloud spend can be key to avoiding cloud sticker shock. While not the most pertinent to performance, there’s likely someone in your finance department that’s looking for a breakdown of cloud spend. And then there’s tracking your reserved instance offers, how well you’re utilizing those offers, and all of the other metrics needed to determine return on investment. This is probably more white box monitoring than black box, but not entirely either. A tool capable of pulling performance data via a cloud provider’s API should also be able to provide you with billing data exposed by the cloud provider.
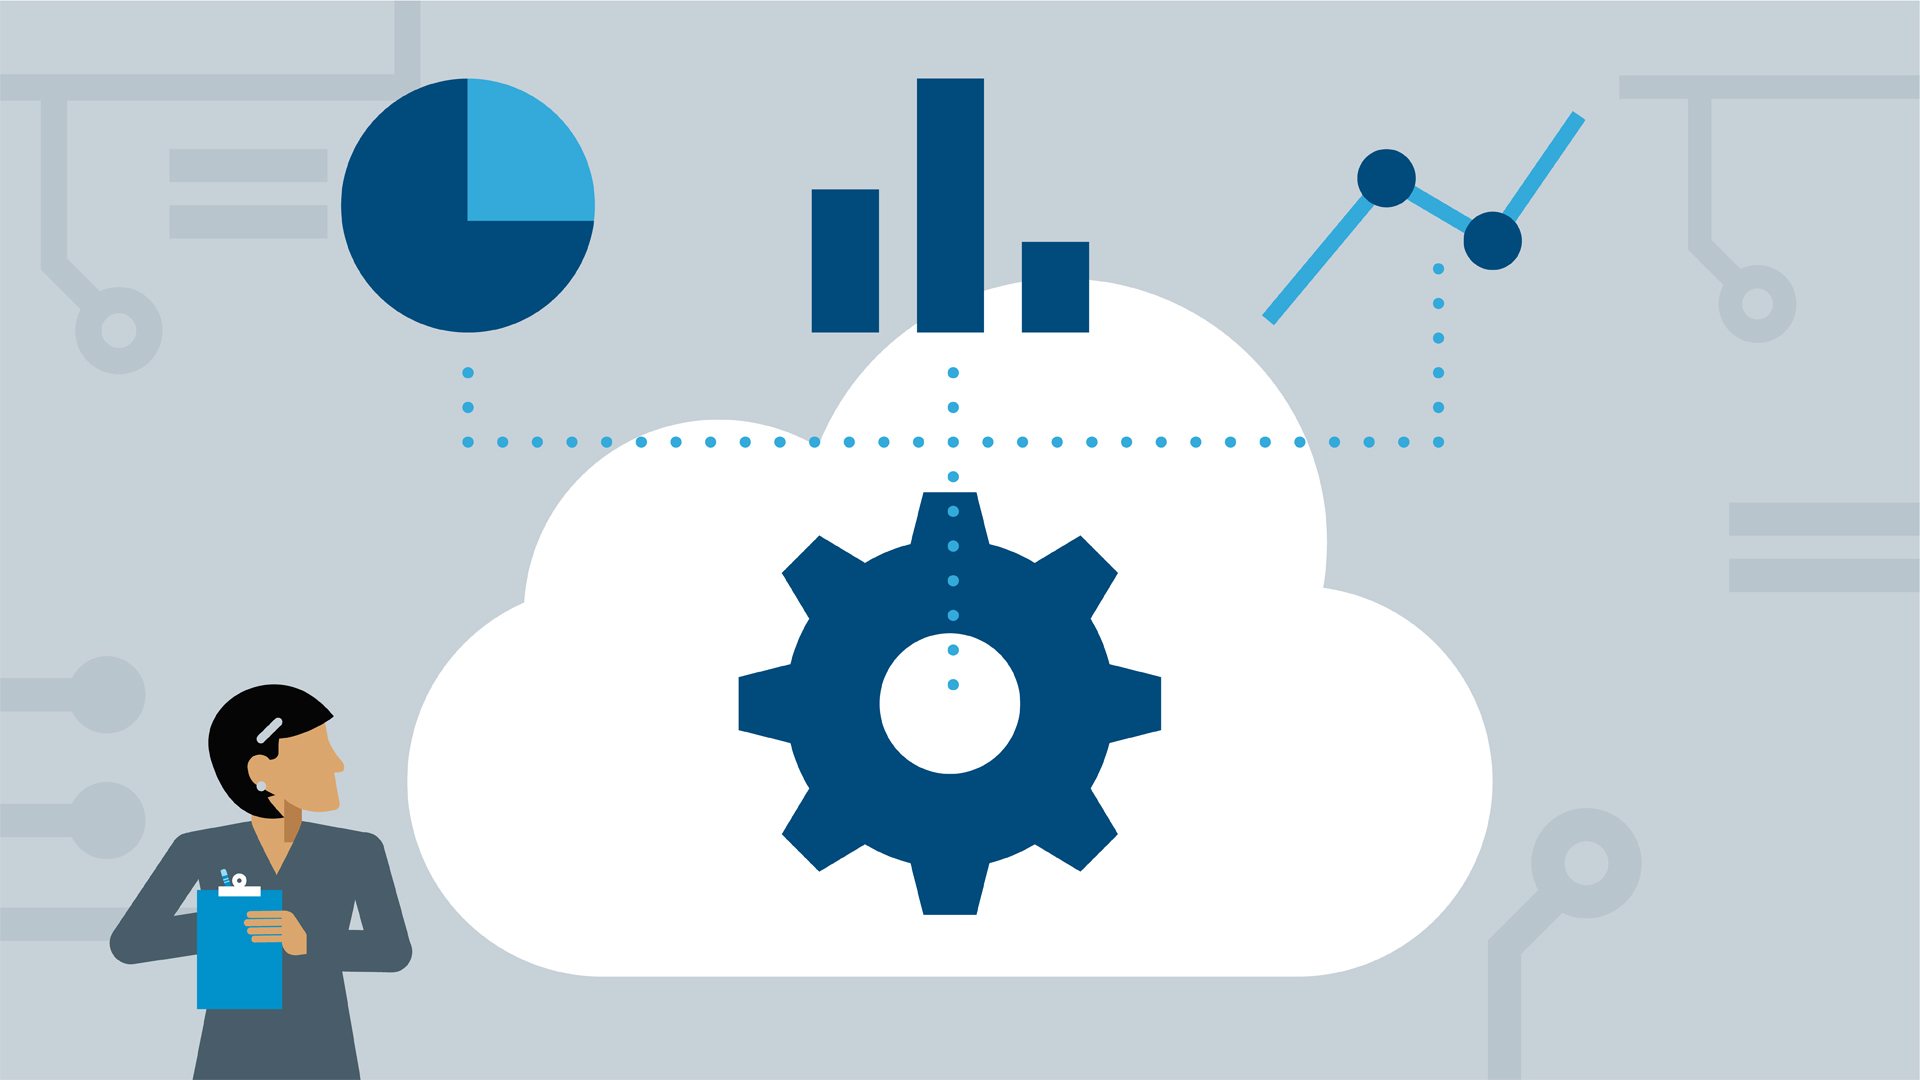
Here at LogicMonitor, we have a hybrid infrastructure with some applications running in the cloud. We saw a need for monitoring more than just the basic performance metrics reported by the cloud provider — we wanted to be notified for upcoming EC2 scheduled maintenance events, see how close we were to our service limits, and track when our reserved instance offers were set to expire. We built LM Cloud to provide comprehensive visibility into cloud, multi-cloud and hybrid environments with a monitoring strategy that focuses on the three primary components identified above: resource performance, cloud provider availability, and ROI. Initially released with support for AWS and Azure, here’s a breakdown of what specifically we’re looking at for each monitored component:
1. Resource Performance — LogicMonitor collects data via CloudWatch & Azure Monitor in most cases (e.g. basic compute metrics for EC2 instances and VMs), and additional data via service-specific APIs in some cases (e.g. ECS API to get running task counts and Azure Resource Health API to get VM status information). A LogicMonitor Collector can additionally be leveraged to get OS level metrics and performance data for traditional applications such as Apache, Tomcat, Zookeeper, Kafka, etc. — we have a library of 1000+ templates that can be used for such data collection out of the box. Event data can be overlaid on performance data graphs via LogicMonitor’s Lambda blueprint or an Azure function, to enable correlation between events that occur in your cloud environment and the performance data you’re monitoring. These pieces come together to provide complete resource performance monitoring for cloud services.
2. Cloud Provider Availability — LogicMonitor alerts on any availability issues reported by AWS and Azure, and a LogicMonitor Collector can additionally be leveraged to check basic service availability via the cloud provider’s SDK. This availability information can be presented alongside monitored resource performance data, so you know when an issue is stemming
from a configuration issue on your end and when it’s an issue with your cloud provider. We also monitor service limit utilization and upcoming scheduled events, and our built-in alert thresholds help ensure you’re notified ahead of time when an issue needs your attention.
3. ROI — LogicMonitor monitors cloud spend by service, region, operation, account, and tag (assuming tags are defined). Reserved instance offers are auto-detected and monitored as well. With LogicMonitor’s powerful dashboarding and reporting capabilities, this data can be sliced and diced to your heart’s desire. You can involve internal stakeholders by customizing out of the box dashboards and scheduling them for regular delivery via email.
Monitoring of the above three components includes both white and black box monitoring approaches to achieve complete visibility into cloud services.

