
LogicMonitor’s topology mapping functionality provides users with a scalable mapping solution that operates on an additive approach for establishing topological context (this means we only show what is necessary for your current viewing purposes).
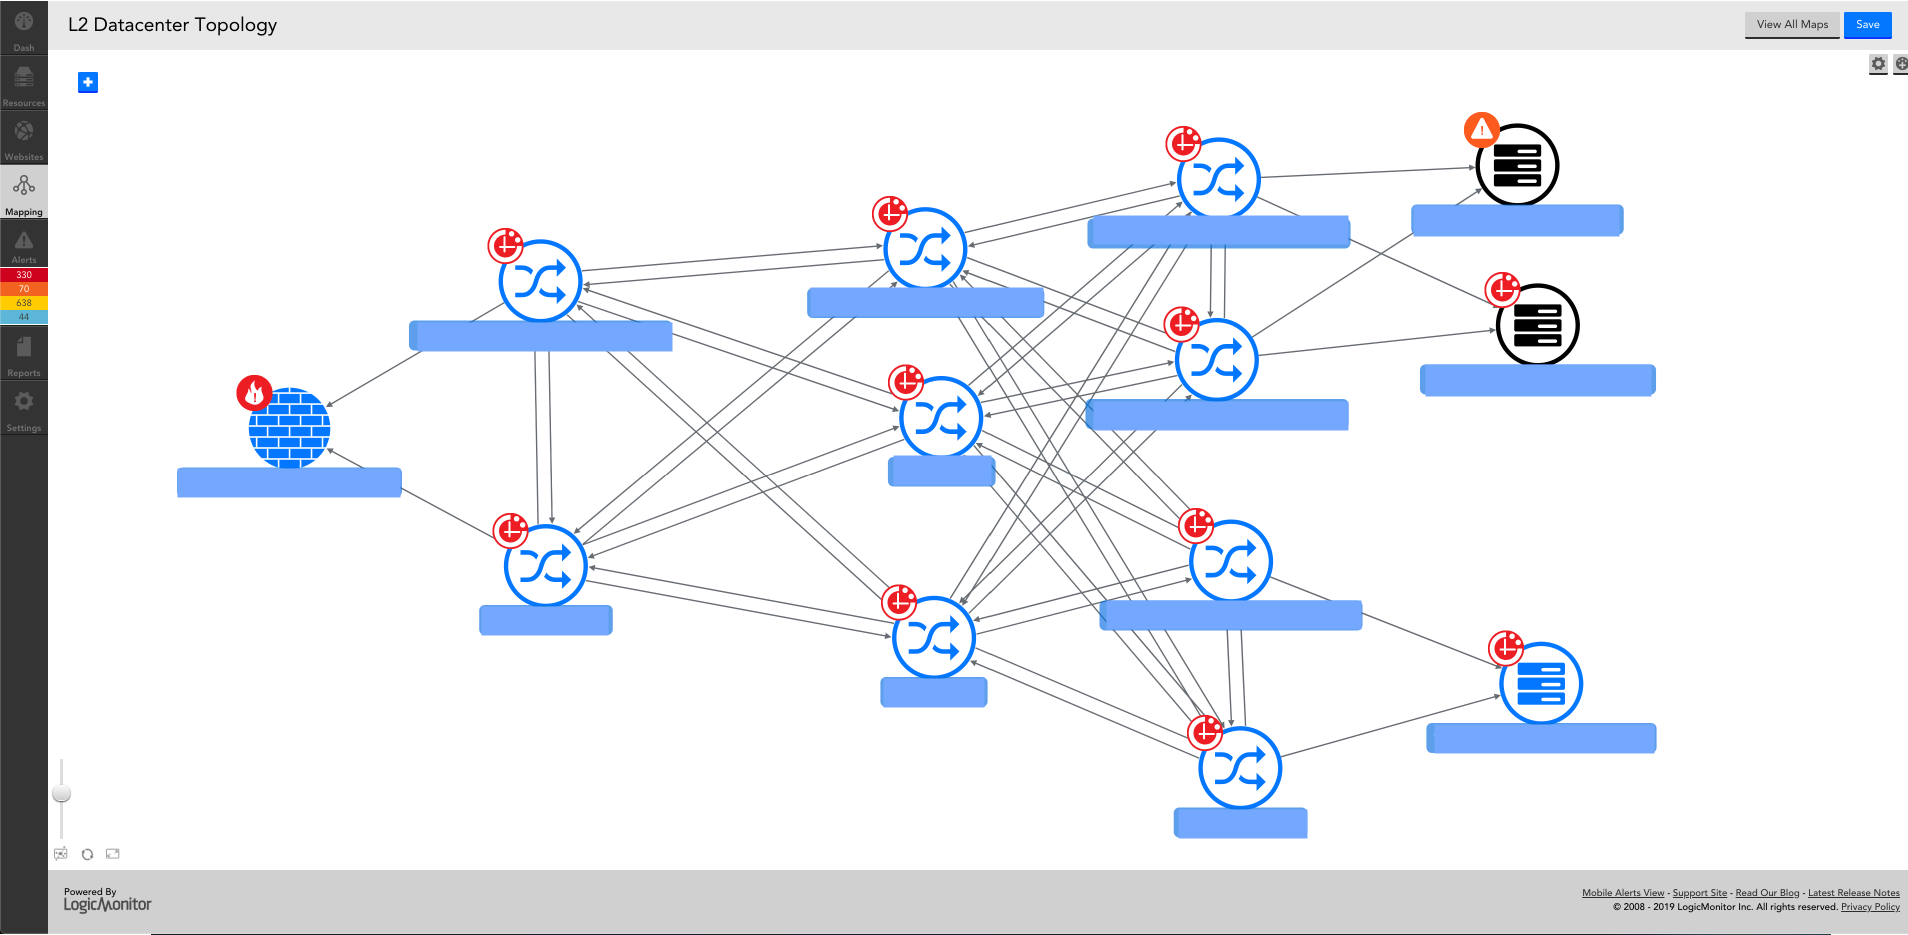
LogicMonitor leverages a LogicModule called a “TopologySource” to connect resources that are currently under monitoring. For network infrastructure, our TopologySource coverage includes support for CDP and LLDP enabled devices. This TopologySource is capable of connecting switches, routers, firewalls, and hosts which is possible by indexing the global device ID, as reported by the CDP and LLDP device ID, and connecting the resources to their connected neighbors. The networking topology is primarily focused on Layer2, since we are leveraging MACs as identifiers and destinations of TopologySources. However, we will be expanding coverage to include other network relationship types and resources, such as Layer3 and SAN infrastructure as the feature progresses and matures.
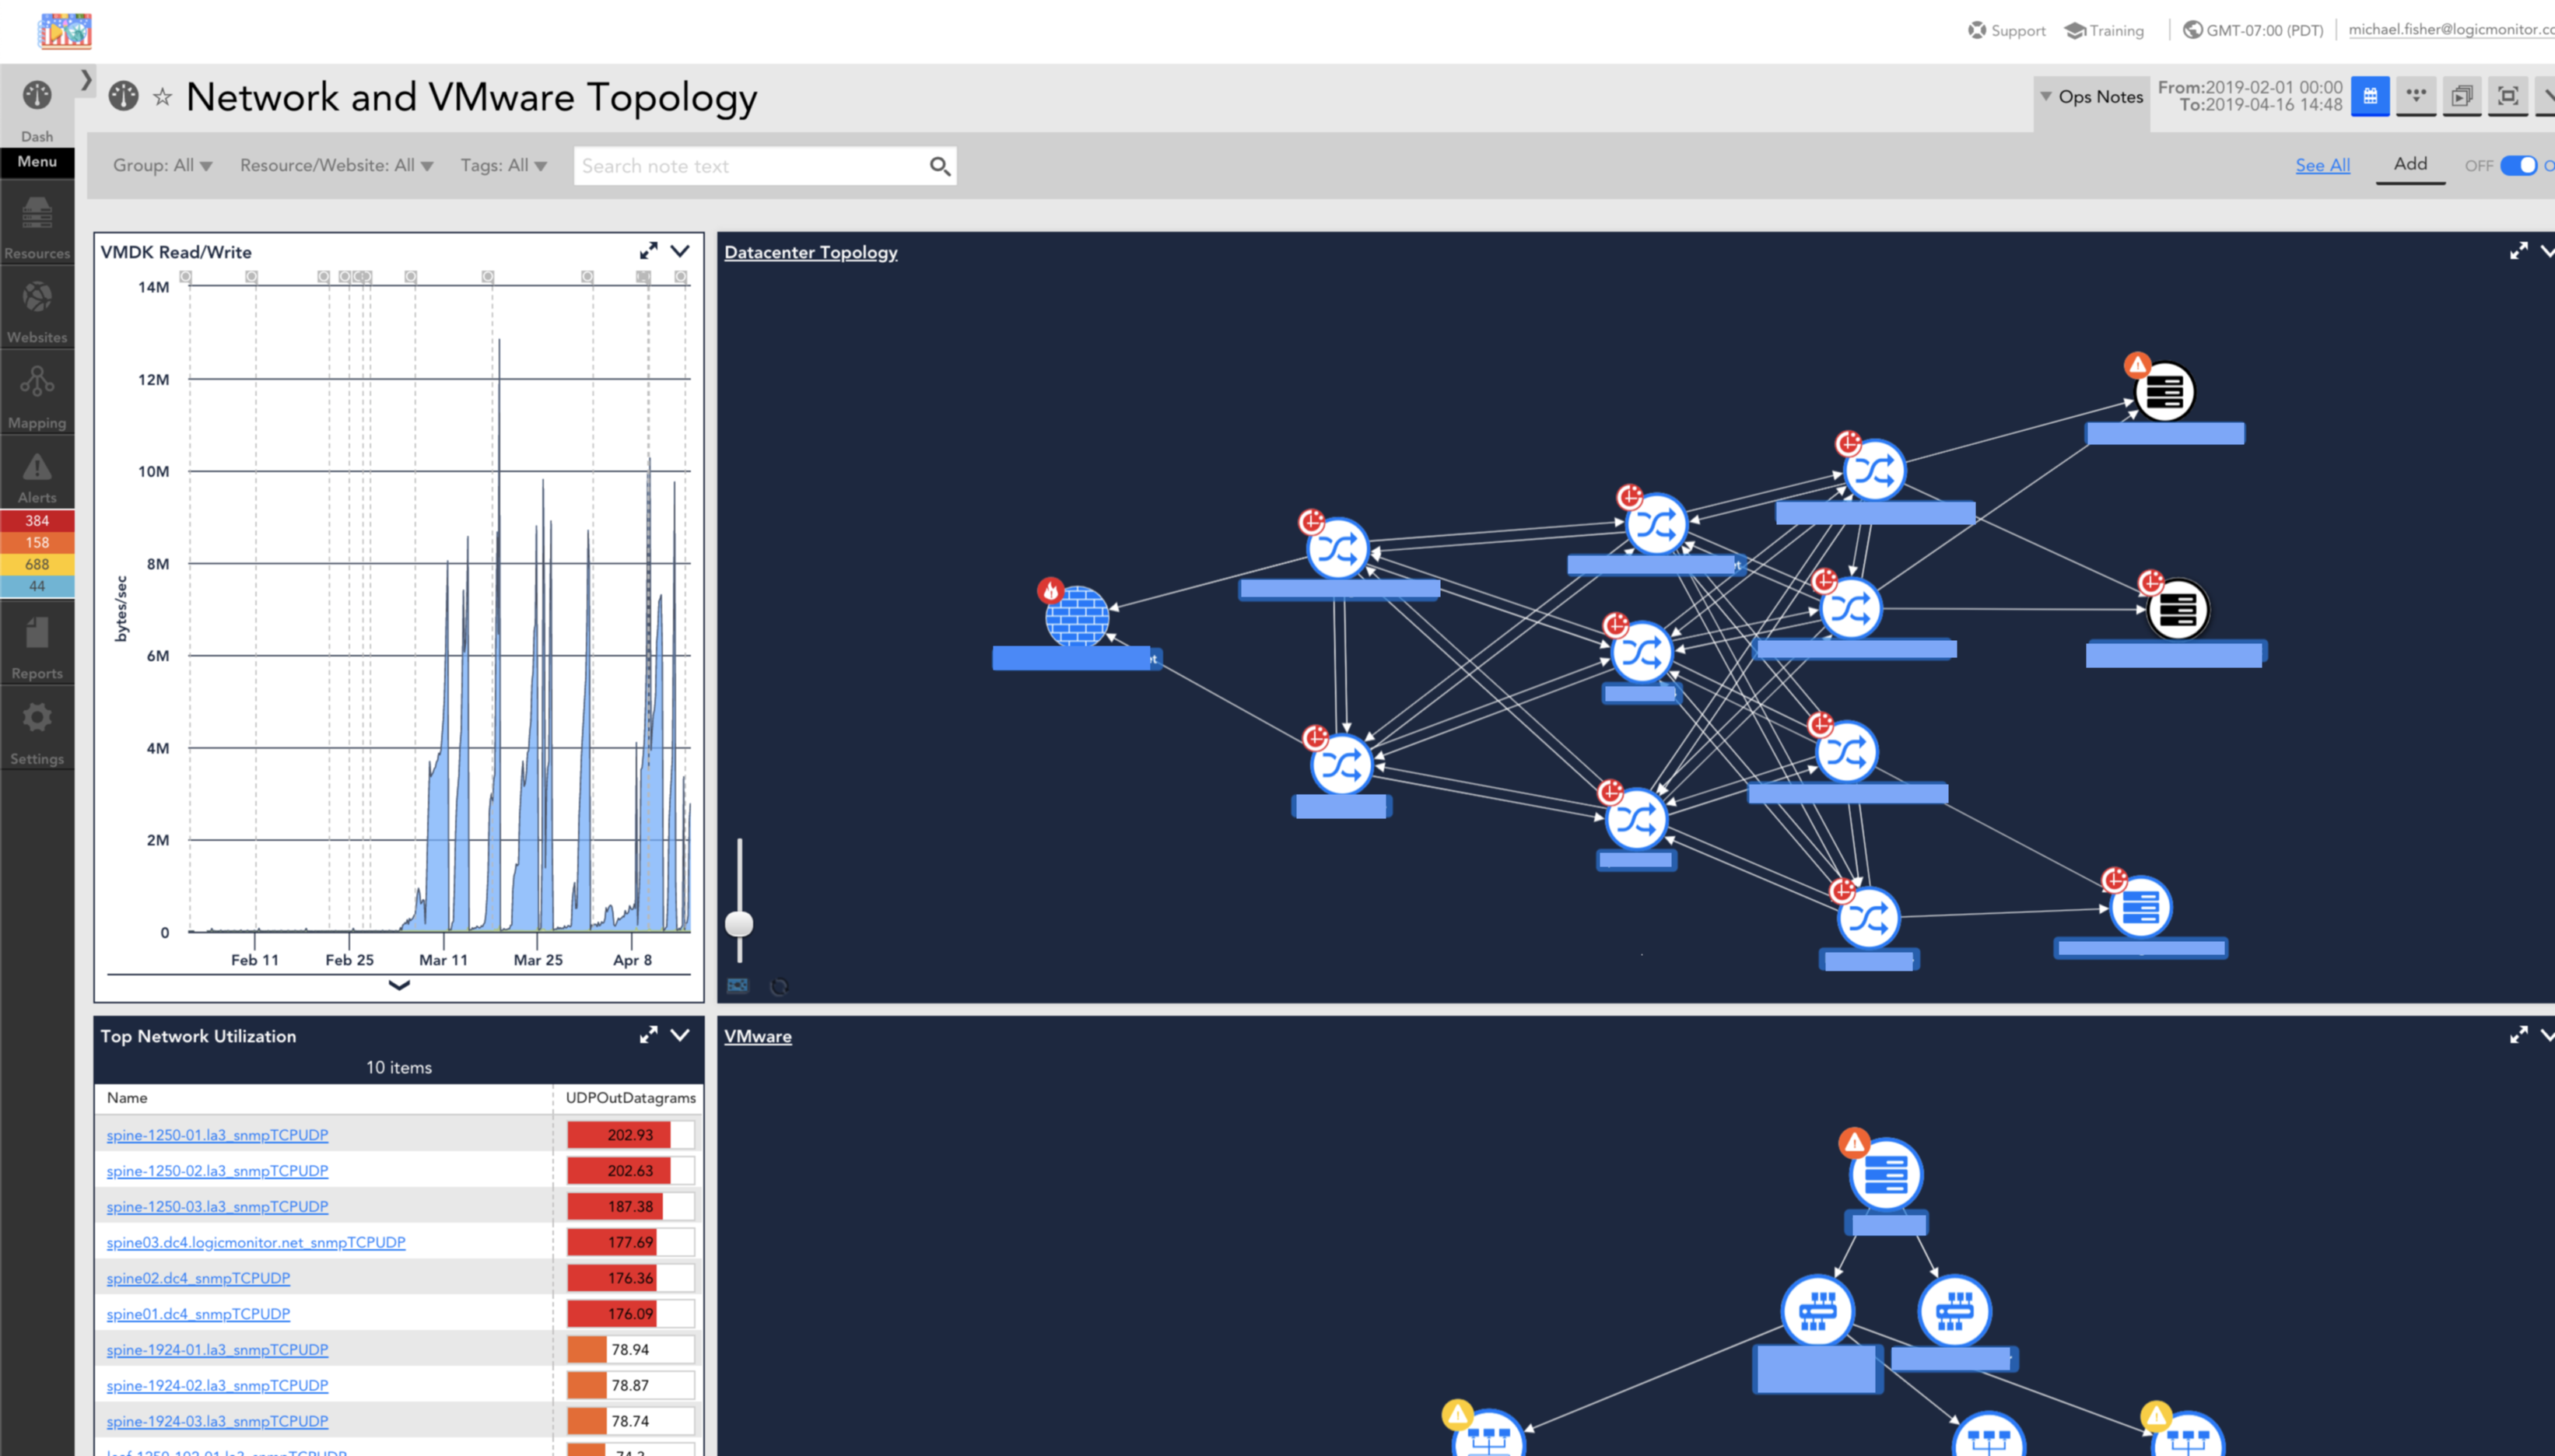
For compute infrastructure, we have TopologySource coverage for VMWare, Linux, and Windows hosts. Upon successful execution, users will be able to trace the path from core switches, to distribution, to access switches, and all the way down to the edge compute, or VM. For VMware, our TopologySources leverage the VCenter API in order to determine relationships. This TopologySource is capable of modeling the VCSA appliance to its clusters, hosts, and all the way down to the datastores that a VMDK writes to. In the future, we will be launching coverage for other HyperConverged vendors, such as HyperV.
On top of our relationship coverage, our topology functionality comes out of the box with the ability to:
- Visualize any alert or alert status of a resource (vertex) participating in mapping
- Create topology dashboards and include maps in reports
- Go directly into a resource through the interactive topology map
- Create ad-hoc maps in response to alert generation
- Change the layout of the map in order to create meaningful contexts
- Save and share frequently used maps
LogicMonitor’s topology functionality enables greater insight into the complex relationship structure present within modern IT infrastructure environments. Visually understanding how infrastructure is connected not only allows you to intuitively navigate based on the relationships, it allows ITOps professionals to retire out-dated static diagrams in exchange for dynamically updating topology maps. This enables better communication of critical topology information while reducing the time it takes to manually draw network diagrams.
The topology data being captured will be foundational for other AIOps powered functionalities that we are actively working on now, such as alert suppression by dependency and alert grouping. To learn more, please see our support page or reach out to your Account Manager.

