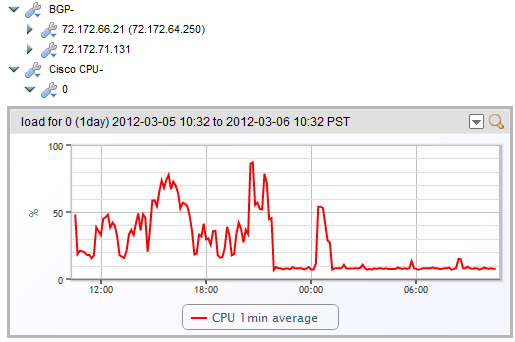
Last night our ops team (of which I am a member) got paged about the CPU load on a Cisco 3560 switch in a new datacenter, late at night. My initial reaction was “We don’t need this alert escalated to pagers or phones- 3560’s switch and route in hardware, so CPU load doesn’t matter.” Once I’d woken up a bit more, the corollary – that there is no possible way that this switch should be at a CPU level to trigger an error alert – occurred to me.
Luckily, about that time I got an automated follow up page from LogicMonitor’s escalation system that someone else had acknowledged the issue and was taking ownership, so I went back to reading.
The member that dealt with the issue gave me the resolution – that this switch we’d deployed in a new datacenter had been repurposed, and had been set to “sdm prefer vlan” – which supports zero unicast routes, and punts routing decisions to the CPU.
This is one of those funky IOS commands that do not show up in a “show running config” command, so wasn’t obvious when the switch was being reconfigured for datacenter use. As this switch had some BGP sessions and was actually performing layer 3 routing, virtually all the traffic was hitting the CPU. And as we were bringing accounts online in this datacenter, the thresholds for CPU utilization were hit.
So after a quick reconfiguration and reboot of this switch (with all traffic flowing over a redundant switch) – the sdm template was reset appropriately, reducing CPU to expected levels:

Just another example of how intelligent monitoring (default thresholds, appropriate alert escalation) prevented an issue were we would have run into packet loss and degraded service in this datacenter. And because of the great members of our ops team, and LogicMonitor’s alert escalation and acknowledgement systems, I didn’t have to respond myself. 🙂
