
At the recent Amazon re:Invent show, LogicMonitor demonstrated its new AWS integration and monitoring. (We also announced another set of free tools – JMX Command Line Tools – but more on that later.)
“Why”, you may be asking, “is this interesting? Doesn’t Amazon provide monitoring itself via CloudWatch? And in any case, aren’t there many ‘cloud centric’ companies that do this?”
Good questions.
At this point in time, most companies have a substantial investment in their own hardware, on which they run the bulk of their applications. This is not going away anytime soon – but companies are, for reasons of agility, embarking on exploratory forays into the public cloud, building some applications, or parts of an application, on IaaS or PaaS services.
There are several things unique about the LogicMonitor offering for such enterprises:
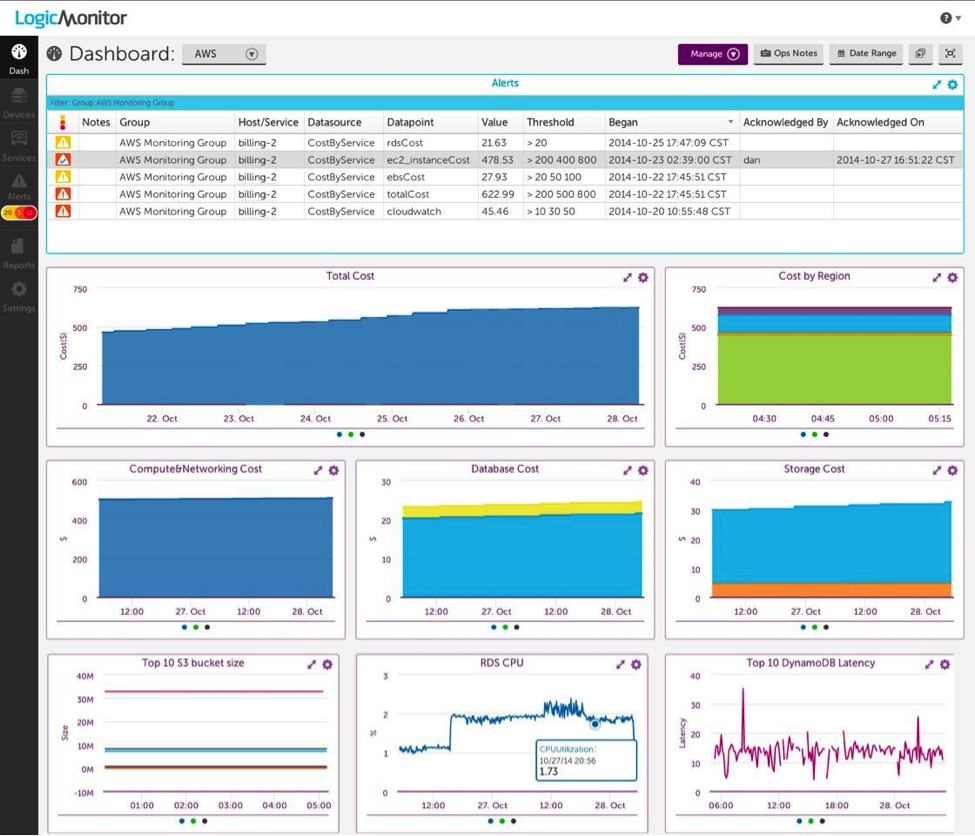
- Pulling in AWS Cloudwatch data into the same monitoring used for all the other components of the application (MongoDB, Tomcat, ESX servers, etc) running in on-premises datacenters makes viewing the application as a whole, and investigating performance issues to resolution, much easier. Not to mention that LogicMonitor will trend a years worth of CloudWatch data (instead of the AWS default of 2 weeks.)
- Viewing Cloudwatch data in the same screen as native (Linux or Windows) performance data gives a much more cohesive view of an entity’s infrastructure. CloudWatch by itself does not provide comprehensive metrics about applications (MySQL, Nginx, IIS, .NET) on a server – but seeing the metrics it does provide, including cost, in the context of the OS and application level work being done by the entity, can provide new insight into the utility of systems.
- LogicMonitor’s integrated use of the Amazon SDK means that it measures application performance not just from Amazon’s point of view, but from the perspective of the servers accessing the Amazon services. e.g. the enqueue time for an SQS queue, when accessed by a server in your Minneapolis data center, may be very different from the time when accessed from a server in the same AWS region as the queue. Measuring the performance from where it is being accessed is far more meaningful, and lets you isolate network issues from AWS issues.
- Use of the SDK also allows LogicMonitor to pull metrics out of AWS Services – query DynamoDB for business level information, such as the number of customer sign-ups per minute, for example – and trend these metrics over time or alert on deviations.
LogicMonitor’s mission is to make life easier for I.T. professionals. Having a tool that will automatically discover all the AWS services you are using; provide visibility of their performance along with all the other systems and applications you use in one place, measure the performance from where it matters to you; and allow easy extraction of business level metrics from these services – that goes a long way to easing the path to the cloud.
Want to see more? LogicMonitor will be allowing customers and prospects to sign up for the Beta of the AWS integration starting in mid December and we will post a link to that here when it is available.
Whether you are moving to the cloud for the agility of infrastructure, or to free up valuable space in your own datacenters for strategic initiatives, with Amazon’s announcements of further security certifications; better developer tools; and more services available – now is a good time to test out the cloud. And now you don’t have to sacrifice application visibility to do so.
We’ll be opening up the beta of the AWS monitoring in December. If you want to see it in action before then – just ask, and we’ll be happy to give you a demo.