
Amazon Web Services are great for quickly enabling agile infrastructure – but this can lead to difficulty with cost control or predictability. Unfortunately, monitoring of AWS resources can exacerbate this problem of unpredictable costs, as the very act of querying AWS data can be more expensive than the cost of the monitoring service.
Any AWS monitoring tool worth its salt will pull in data via the CloudWatch API, because for certain resources, it is the only data available. However, AWS charges for requests to this API, which means that AWS monitoring will come with associated CloudWatch costs – and the API costs alone can be expensive if you don’t pay attention to how your monitoring is done.
To avoid blowing your budget on CloudWatch costs alone, it is important to ensure that your monitoring tool requests CloudWatch data as efficiently as possible. Similarly, you should make sure that your monitoring tool gives you the flexibility to adjust how CloudWatch data is requested, so that you have the option of optimizing it for your environment. With LogicMonitor, Collector-based monitoring and flexible polling intervals make it easy to minimize your CloudWatch costs while still maximizing the value of your monitored data.
AWS requests to the CloudWatch API are restricted to one request per metric. This means that ultimately, CloudWatch cost for monitoring is directly proportional to the number of metrics monitored. Each AWS Service exposes a different number of metrics via the CloudWatch API, so the cost will vary across these services. For example, Elasticsearch publishes 12 metrics to CloudWatch by default, while Lambda only publishes 4. Assuming the same request frequency, this makes Elasticsearch 3 times as expensive to monitor as Lambda, if you monitor all the metrics possible.
CloudWatch cost is also directly proportional to the frequency of requests. While requesting more data at less frequent intervals is possible, it can prevent real time alert evaluation, reducing the value of the monitored data. Based on their purpose, certain services warrant more frequent data collection, like ELB, while longer collection intervals are acceptable for other services, like S3. LogicMonitor’s AWS DataSources have default collection intervals set with this in mind.
Given that CloudWatch API requests cost $.01 per 1000 requests, we can actually calculate the prices for different services, based on the datapoints and collection intervals in the default LogicMonitor AWS Datasources. To illustrate the point, here are the three most and least expensive services to monitor, respectively:
Top three:
ElastiCache: $10.35 per Memcached cluster/ 30 days, $9.50 per Redis cluster/ 30 days
RDS: $6.90 per RDS instance/ 30 days
Auto Scaling (aggregate & group metrics): $6.50 per Auto Scaling group/ 30 days
Bottom three:
Lambda: $.35 per Lambda function/ 30 days
SNS: $.34 per SNS topic/ 30 days
S3: $.02 per S3 bucket/ 30 days
Given the above information, here is how LogicMonitor can help you get the most bang for your buck:
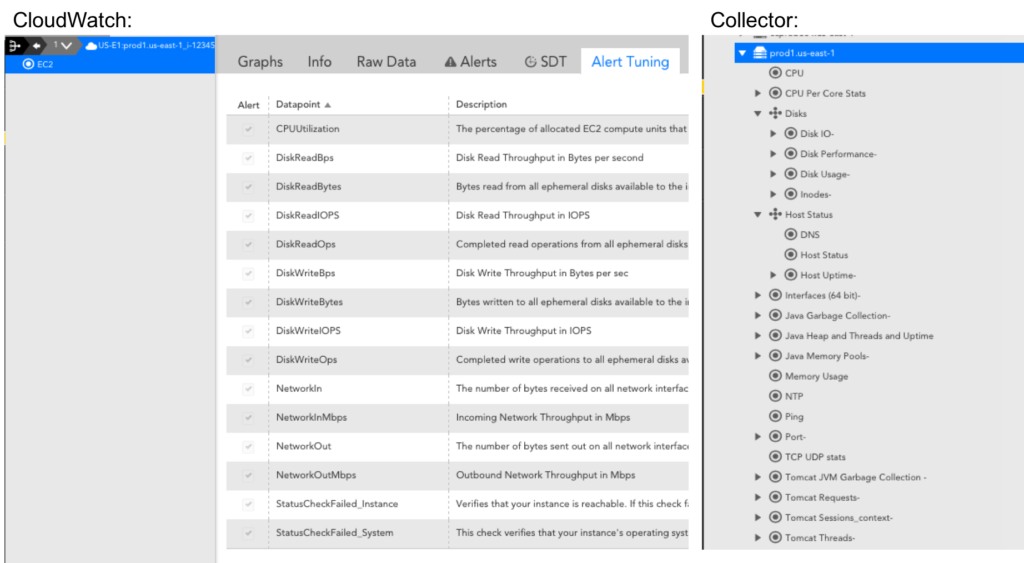
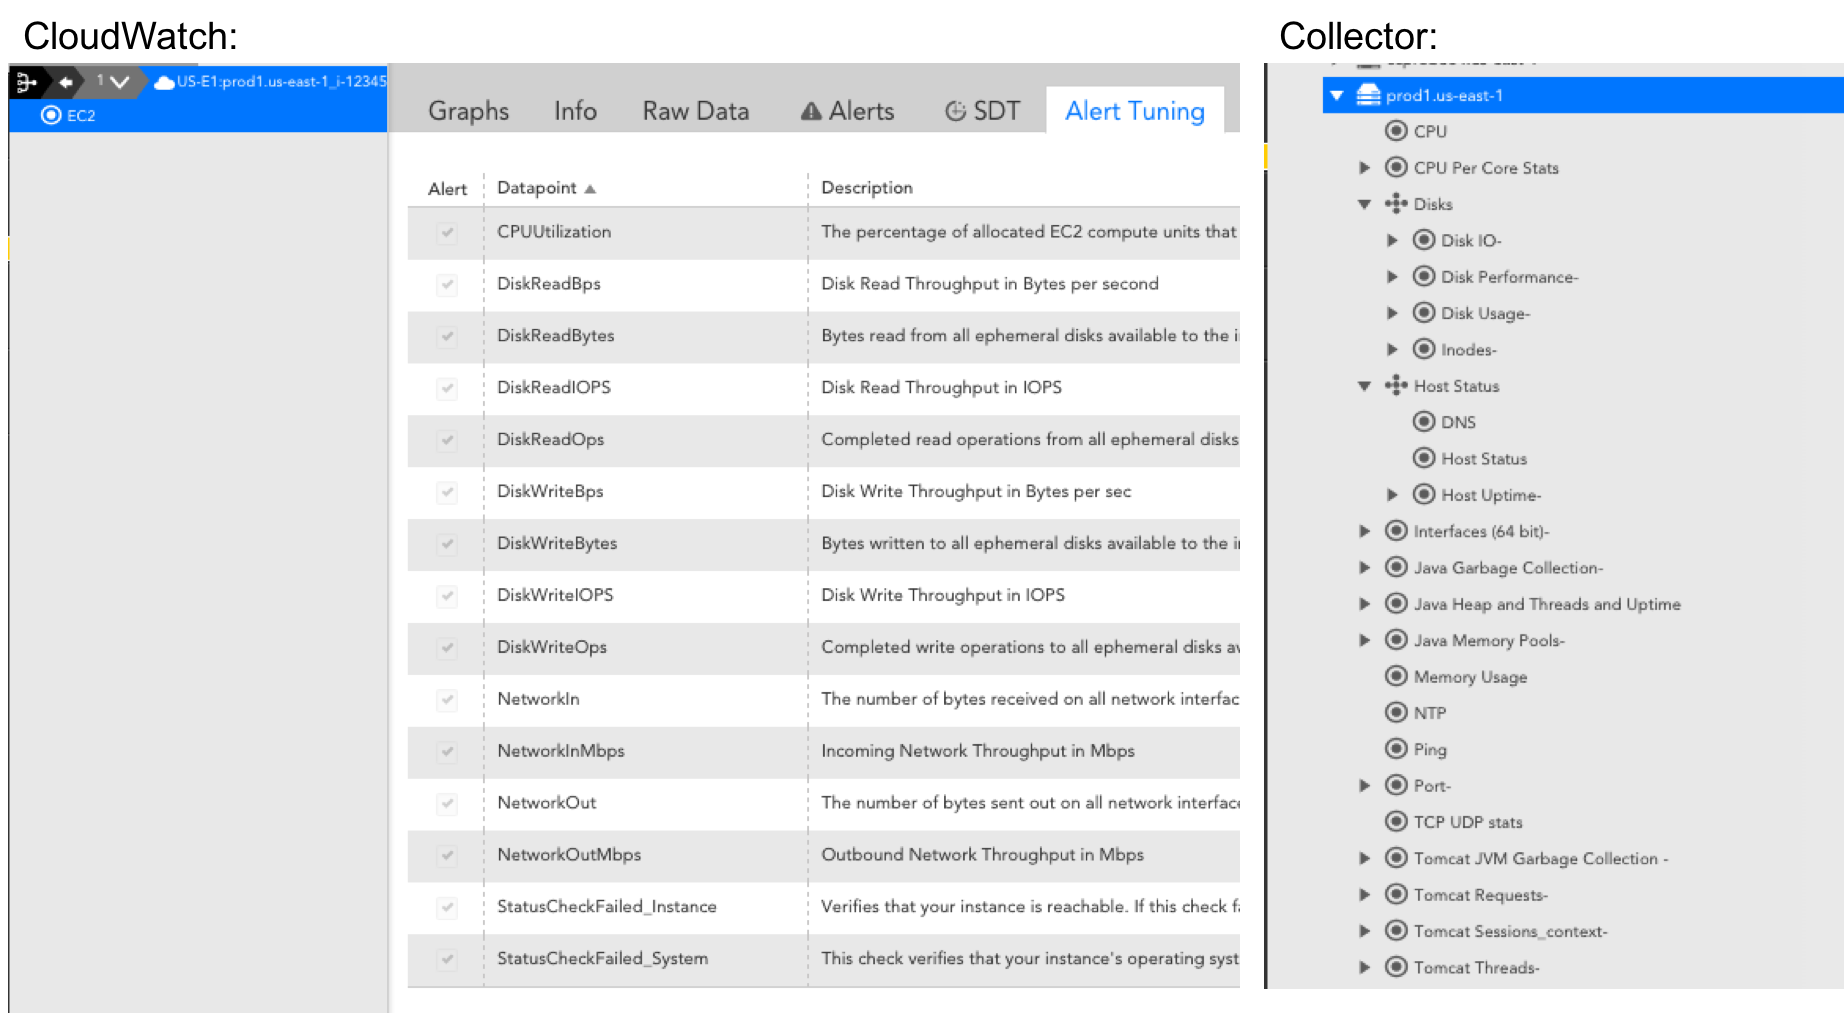
- Use a LogicMonitor Collector to monitor EC2 instances instead of using EC2 metrics exposed via CloudWatch. LogicMonitor’s server Datasources provide more depth than CloudWatch does for EC2 instances. Here’s a side-by-side comparison of an EC2 instance monitored via Collector (right) and monitored via CloudWatch (left):
The default AWS_EC2 Datasource that collects metrics once every five minutes only costs about $1/ 30 days for each EC2 instance. If you have detailed metrics enabled, you may have adjusted your AWS_EC2 CloudWatch Datasource to collect as frequently as once per minute, which costs about $4.75/ 30 days for each EC2 instance. With hundreds or thousands of instances, this can add up. We recommend disabling the AWS_EC2 Datasource if you already have a Collector installed in your AWS environment, which will save you money without having to sacrifice monitored metrics. If you have custom CloudWatch metrics, consider creating a separate CloudWatch Datasource to capture those. - Use a LogicMonitor Collector to monitor RDS instances in favor of the RDS metrics exposed via CloudWatch. This is similar to recommendation one. With the exception of Aurora RDS instances, LogicMonitor Collector metrics offer more comprehensive database performance and health metrics than those CloudWatch reports for RDS. Because RDS instances are ultimately running on a server maintained by AWS, CloudWatch also reports memory and storage metrics for RDS. As there is no direct access to the server, you can only get these memory and storage metrics via CloudWatch. The database performance and health metrics, however, can be monitored via LogicMonitor Collector DataSources. The default AWS_RDS DataSource collects metrics every minute, and with around 16 datapoints this will cost you almost $7/month per RDS instances. If you have a LogicMonitor Collector in your AWS environment, we recommend only relying on the AWS_RDS DataSource for underlying server metrics like memory and storage, and using our MySQL, Microsoft SQL Server & PostgreSQL DataSources for database performance and health metrics.
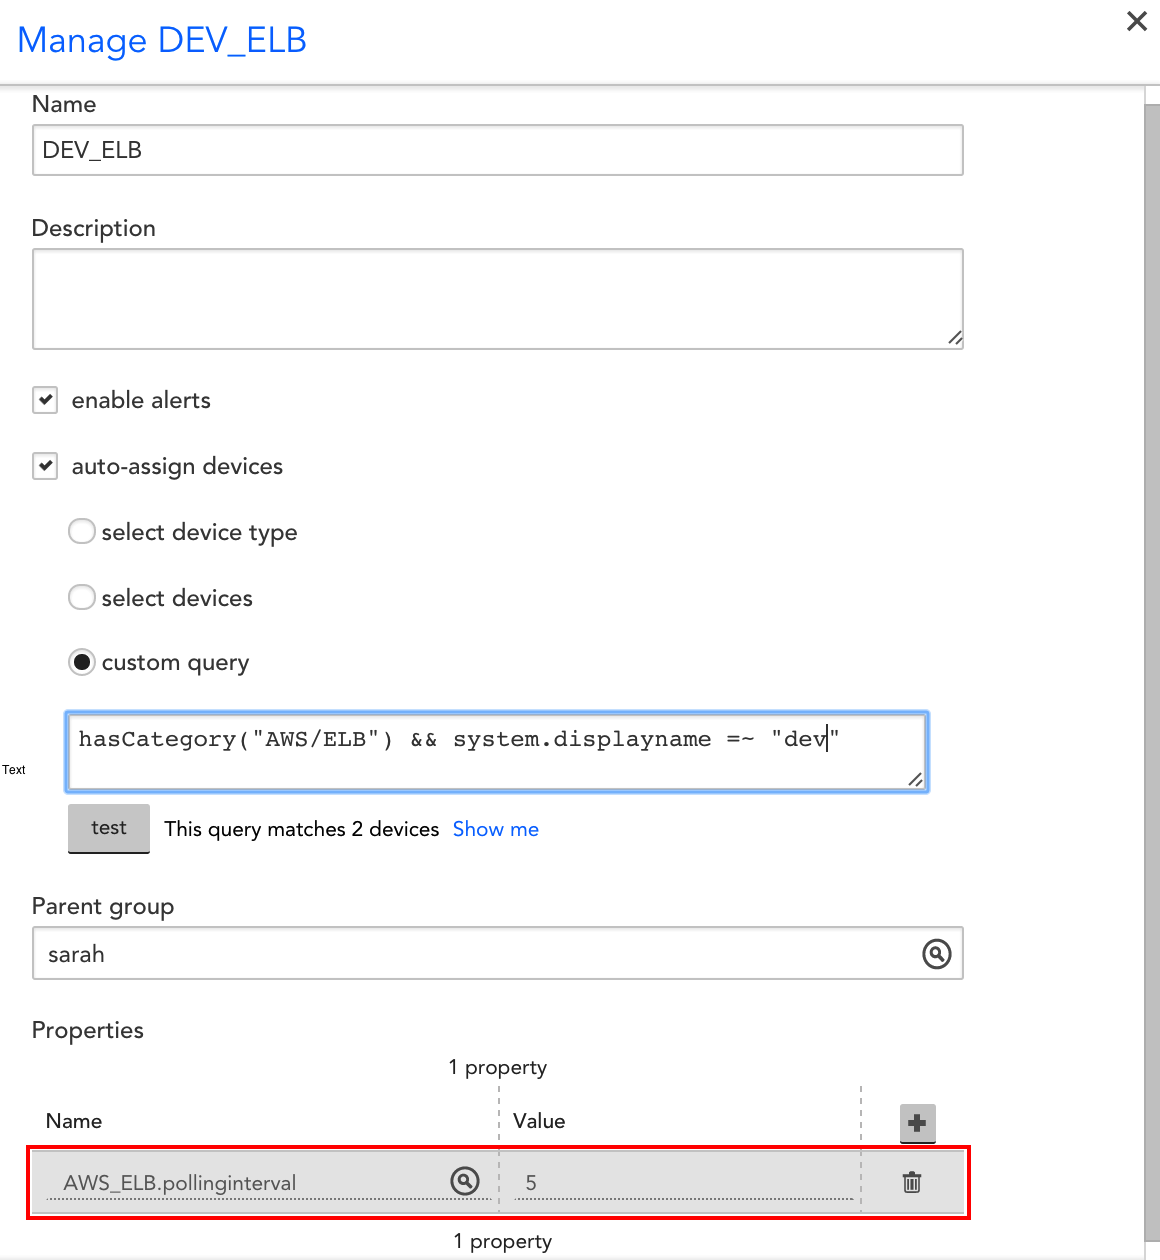
- Increase polling intervals where possible. There may be some resources that don’t need one minute granularity. For example, you don’t need as much granularity for Dev and QA environments as you would your production resources. You can set the polling interval at the global level in the DataSource definition, but you can also customize it for specific groups and/or devices with a custom property. E.g. this specific group has a 5 minute polling interval for all AWS_ELB metrics, which overrides the polling interval set in the AWS_ELB DataSource definition:

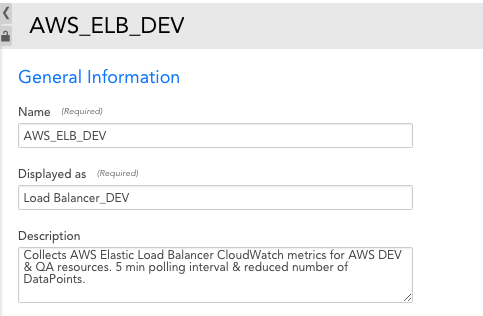
- Trim datapoints where possible. You can utilize LogicMonitor’s Complex datapoints to get rates and other calculations based on CloudWatch data. You don’t have to pay for Complex datapoints, because they don’t involve requests to CloudWatch. This means that you should establish all rates and calculations as Complex datapoints, instead of pulling them directly from CloudWatch. We do this where possible with our default AWS DataSources, but it is especially important to consider for custom metrics. There also may be cases where certain datapoints reported by CloudWatch aren’t valuable for some resources. For example, maybe you don’t need to know latency for your Dev / QA resources. In that case, you can clone the DataSource and have a Dev / QA version that only has a subset of the original datapoints, like this:
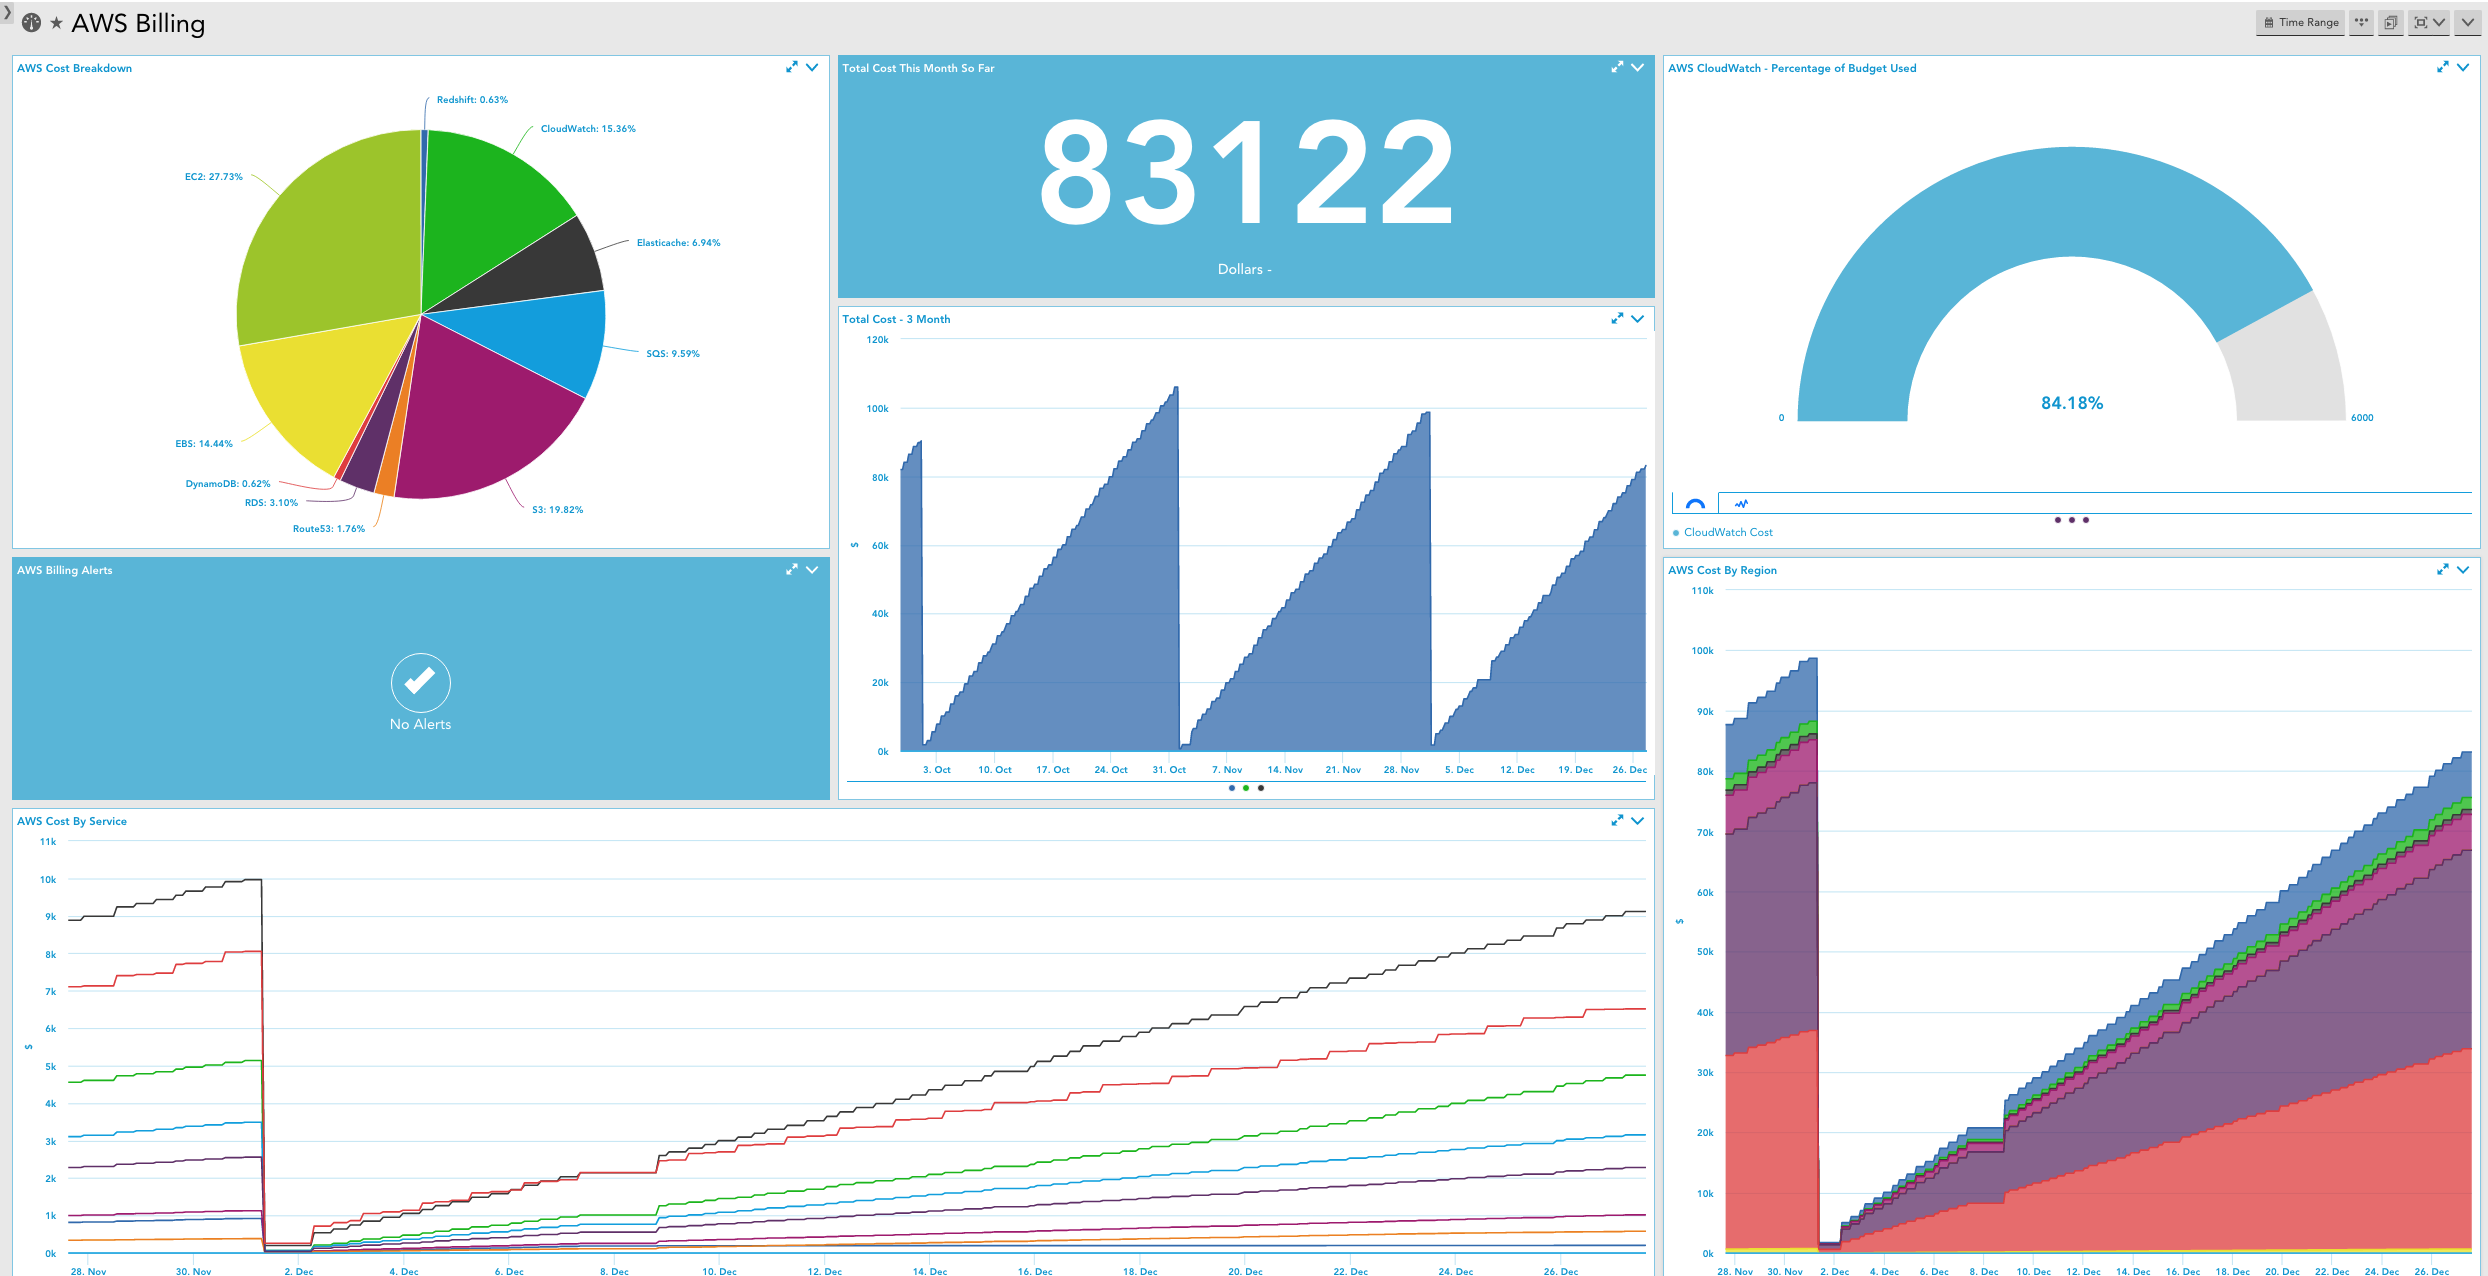
In addition to optimizing your AWS monitoring to minimize your bill, we recommend that you monitor AWS billing data itself in LogicMonitor. You should use the AWS billing per region, service and tag Datasources in LogicMonitor, and set thresholds for billing metrics such that you will receive alerts for excessive and/or unusual billing values. Consider setting up a dashboard or report that you can review on a daily or weekly basis. This will enable you to react to and better manage your CloudWatch expenses, so you ensure that you’re minimizing your spend while maintaining the value of monitored performance data for your AWS environment.
While retrieving data from CloudWatch for alerting and long term trends is great – make sure your monitoring tool doesn’t eat your whole cloud budget with unnecessary API calls!

