
Earlier this year, LogicMonitor held its first-ever Dashboard-a-thon Charity Challenge. Dashboard functionality has always been important to our customers and over the years we’ve seen some pretty unique dashboards. For the challenge, we asked our customers to send us their most eye-catching, innovative, or just plain wacky dashboards. The customers who submitted the three most interesting dashboards won a premium swag bag and a donation to the charity of their choice on behalf of LogicMonitor.
Here are the three winning dashboards:
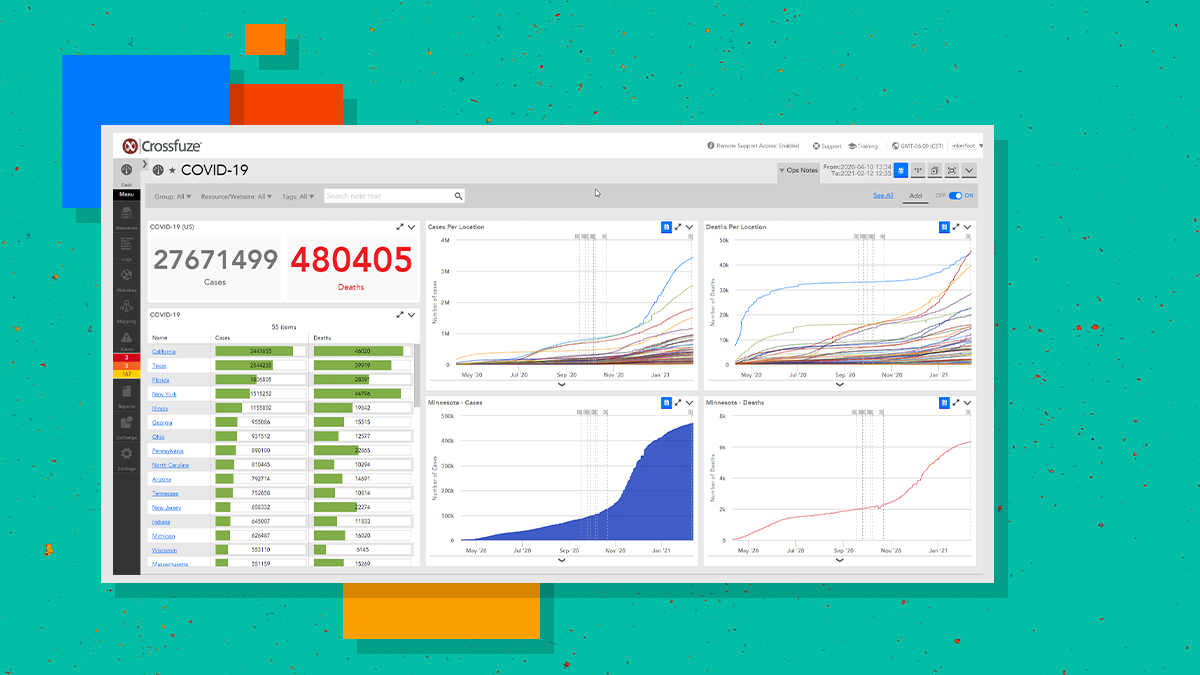
COVID-19 Dashboard
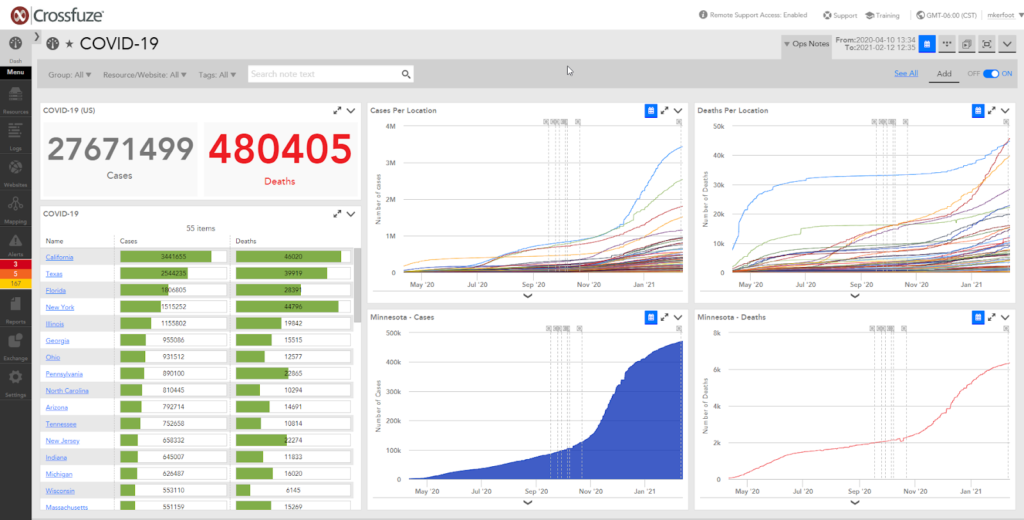
Matt Kerfoot, an Infrastructure Engineer at Crossfuze, created the COVID-19 tracker shortly after the pandemic hit. Word about COVID-19 started spreading at the beginning of March 2020 and his whole company was asked to start working from home. Matt thought it would be interesting to track and monitor the number of cases and deaths per US state. The COVID-19 tracker dashboard is a great example of thinking outside the box and using LogicMonitor dashboards in a creative way. When asked what inspired him to create the dashboard, Matt explained, “If it can be monitored, it is worth monitoring!”
Datacenter Air Conditioning Dashboard
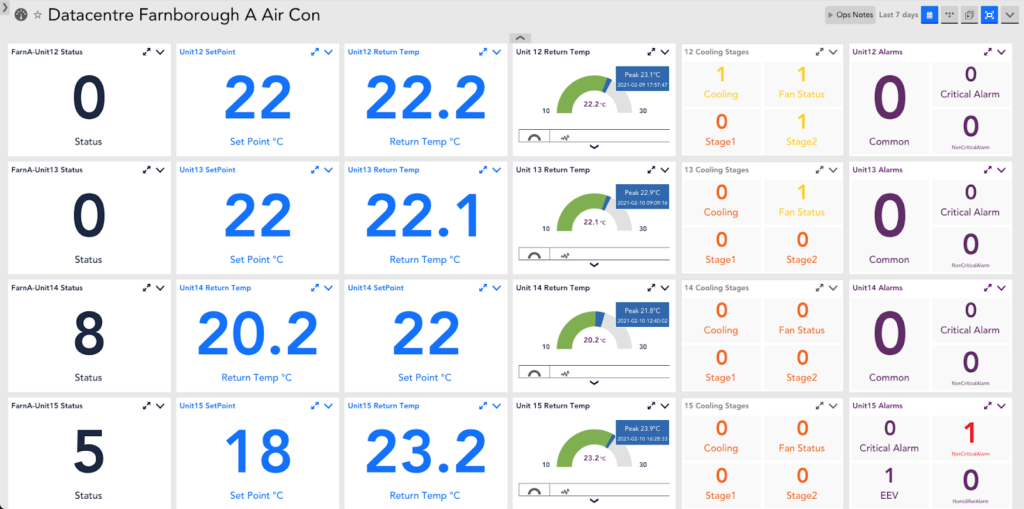
Arafat Aman, a MAS Lead Consultant at Aurora, created a dashboard that monitors the air conditioning in Aurora’s datacenters. The dashboard was created just over a year ago to address the need to monitor the datacenter air conditioning units, rack temperature, humidity, and power usage. DataSources were created to get the metrics for the air conditioning units and then a dashboard was created for each datacenter location. The datacenter air conditioning dashboard is viewed by the datacenter teams on a daily basis to get an overview of the environment. Not only is this dashboard visually appealing, but it is also informative and adds value to the whole team.
Enterprise Overview Dashboard
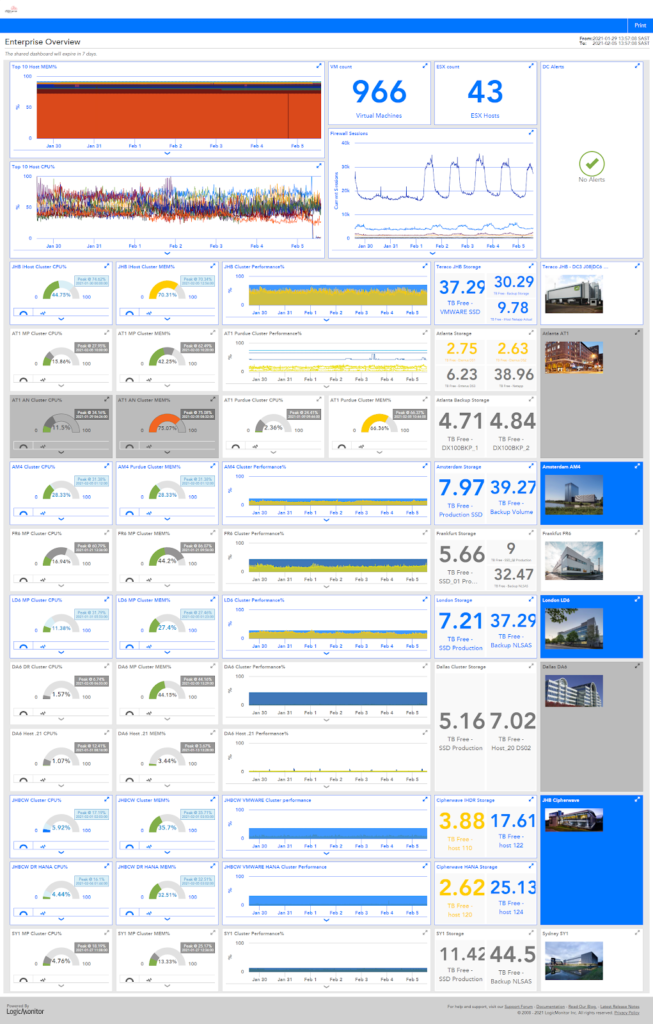
Ekard Dicks, a Cloud Engineer at iSphere Cloud, created an enterprise overview dashboard that assists with capacity planning and performance monitoring. Ekard realized that there were many different components to monitor for capacity planning, so he created a visually appealing dashboard that shows everything in one place. The dashboard provides a single pane of glass view of all global data centers and is used for daily checks and budget planning. The right side of the dashboard shows images for each building, making it easy to understand at a glance. “LogicMonitor has become part of our environment team,” said Ekard. “We no longer look after our monitoring solution, it looks after us!”
Honorable Mention
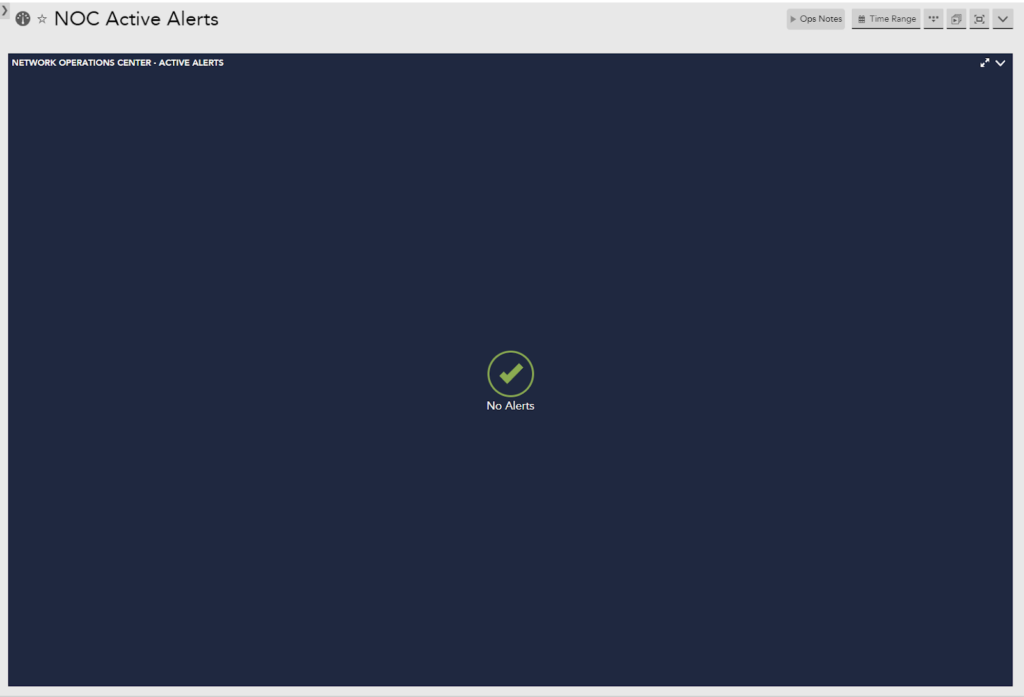
Lastly, we wanted to give an honorable mention to Leo Milanovic at Itaito for his active alerts dashboard. Sometimes, it’s okay to keep it simple! Is there anything quite as satisfying as a dashboard with no alerts?