

OK, Elvis may have actually sung, “All this aggravation ain’t satisfactioning me,” but if he’d been referring to data aggregation, we’d be able to satisfy the King.
We’re announcing something that our developers have been working on for a long time – the use of our own proprietary Time Series Database (TSDB) to store our customers’ time series data. Why should you care? Because this means we never have to aggregate or roll up your data, ever again. If data is collected at one minute intervals and you look at a graph of that data for the last three months, then drill down to an hour from two months ago, you will see every individual data sample.
Previously, like almost all other products, we stored data in a round-robin style database (RRD), which had predefined roll-up intervals after a day, week, month, and so on. So when you look at data from a few months ago, you might only see one data point representing the average of each 6 hour period. Usually this doesn’t matter that much. When you look at longer time frames, you are typically interested in the trends, rather than the individual data points.
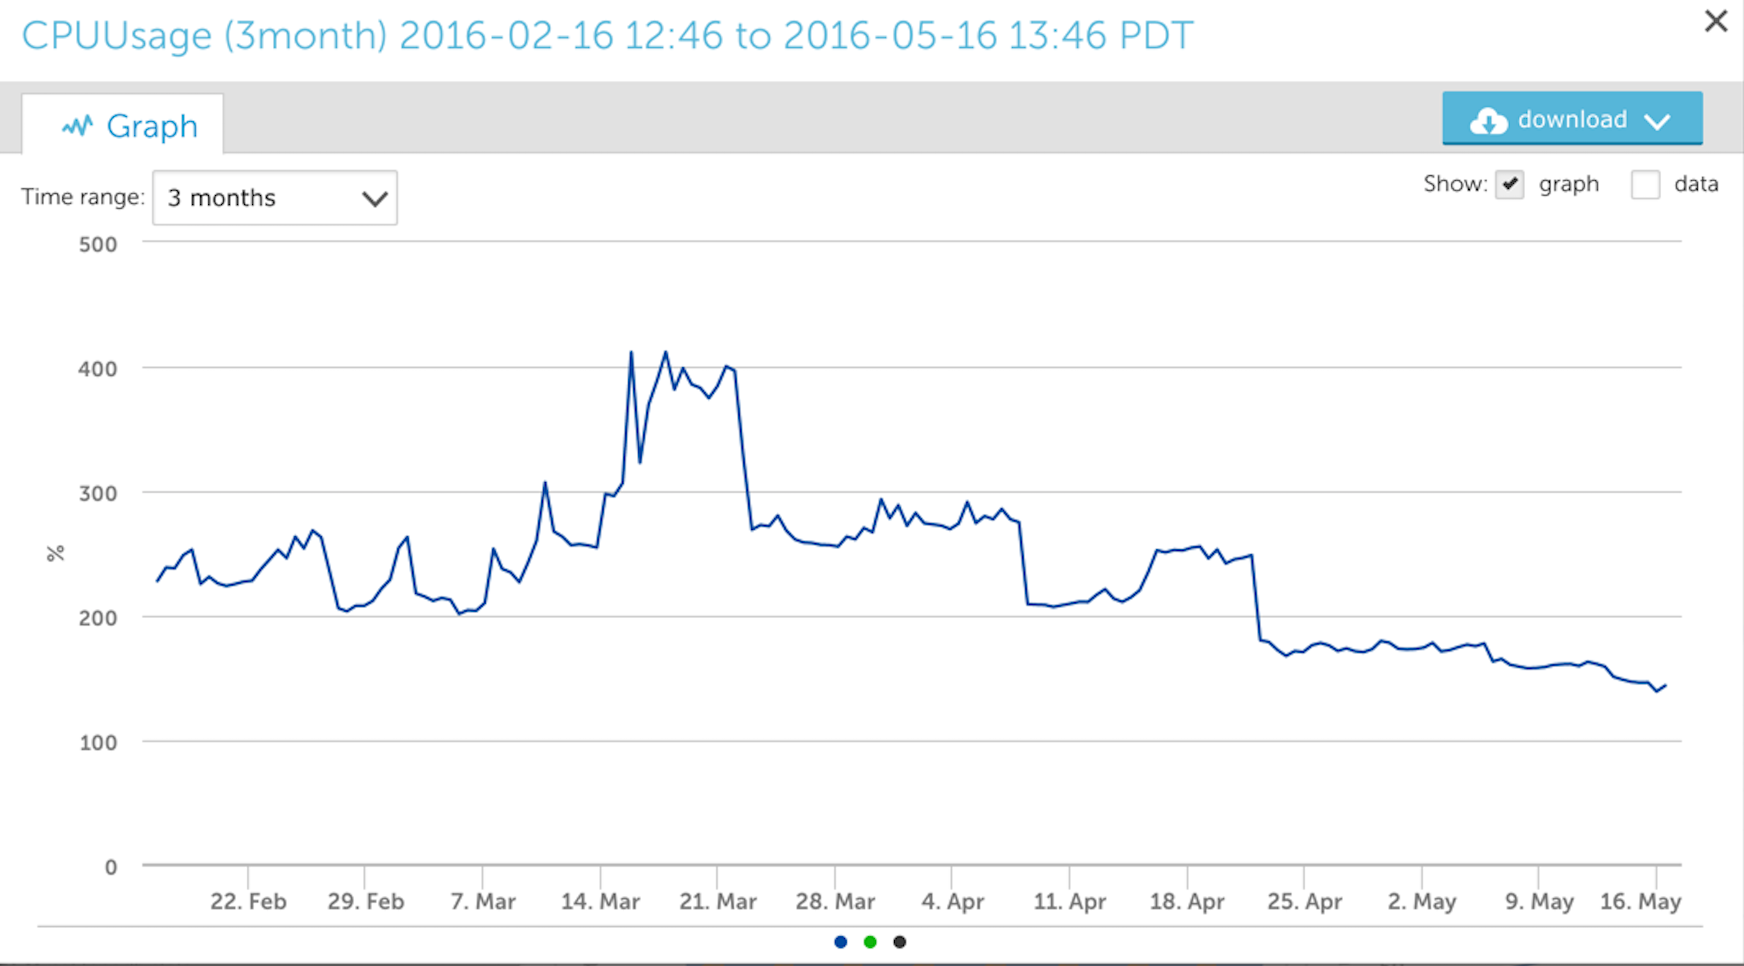
Consider the following two images of three month views of CPU core usage by a Java process.
First from the old RRD style:
And then from the new TSDB system:
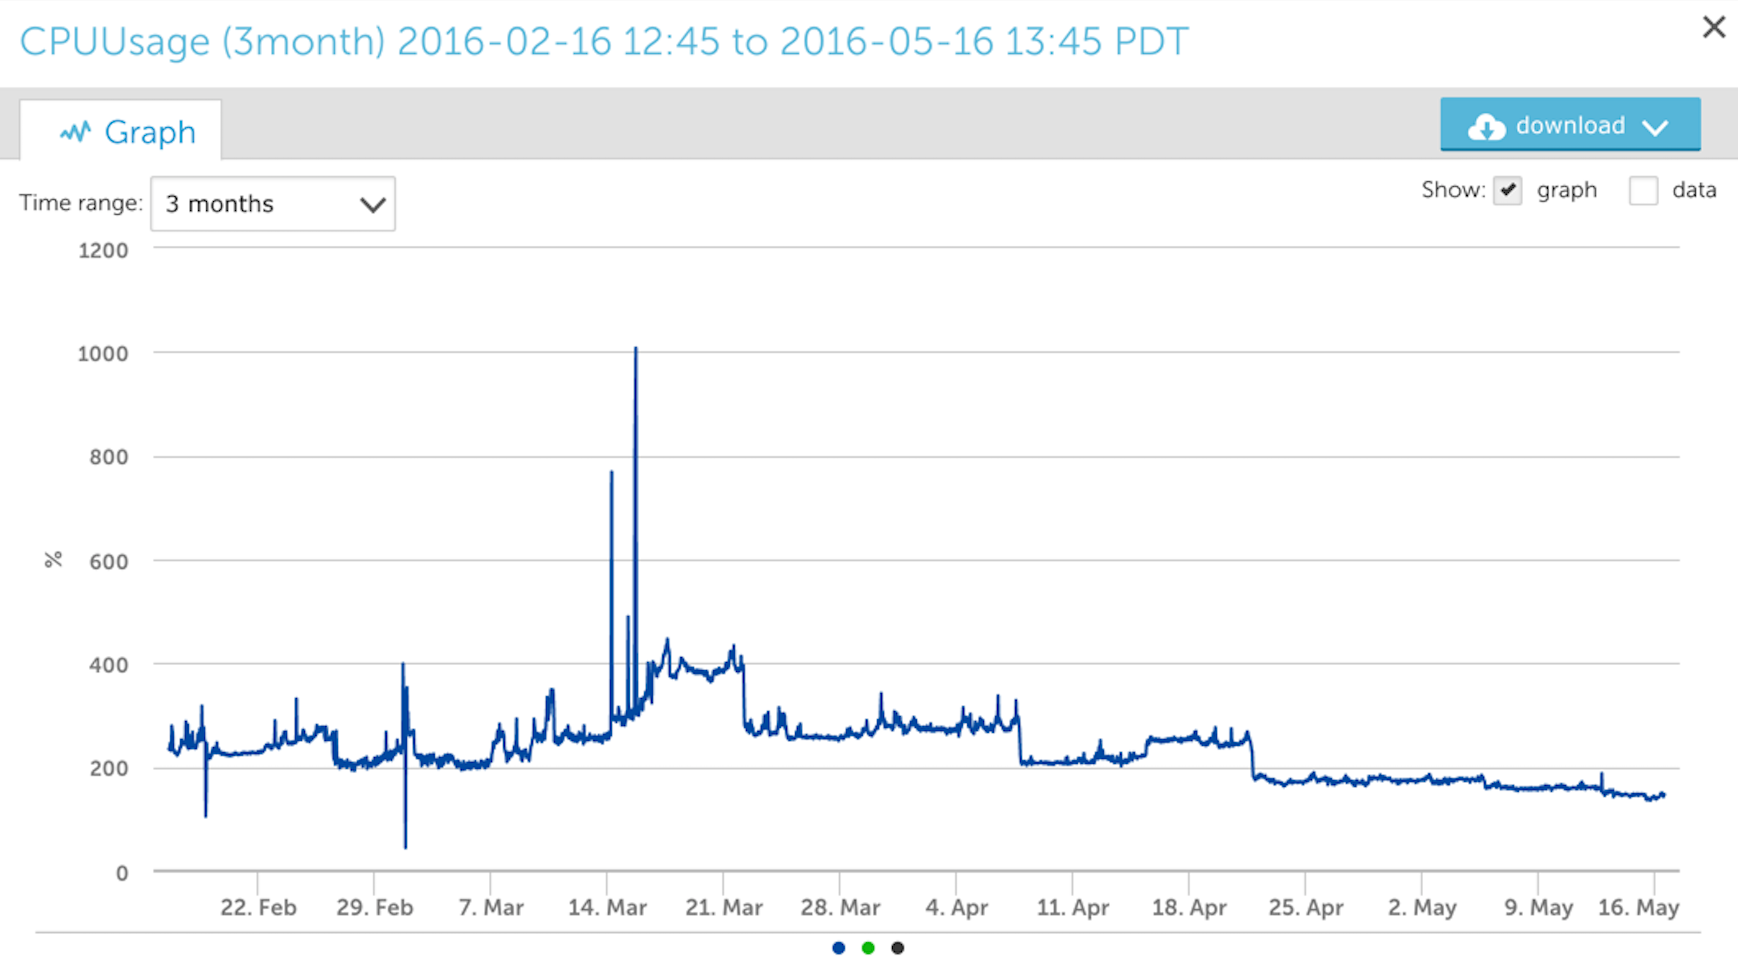
Although both graphs are similar in shape, the new TSDB graph is not as “smoothed out” as the RRD style graph and the TSDB one is a better representation of the data peaks. You can see a much bigger difference between the two when zooming into a smaller period of time.
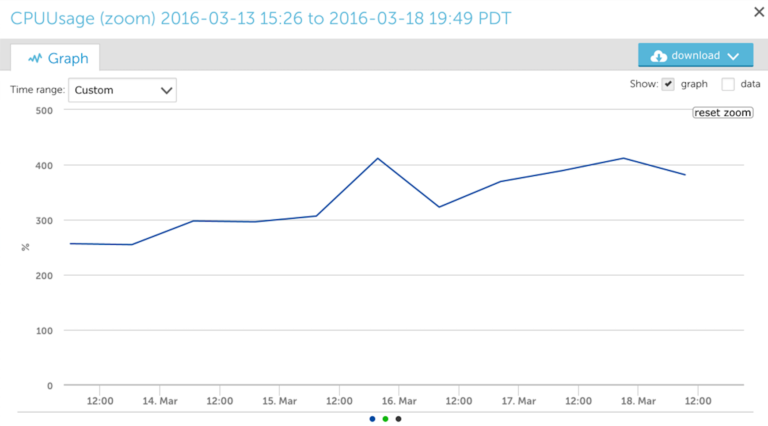
When you zoom in on the RRD data, we only see a datapoint every few hours:
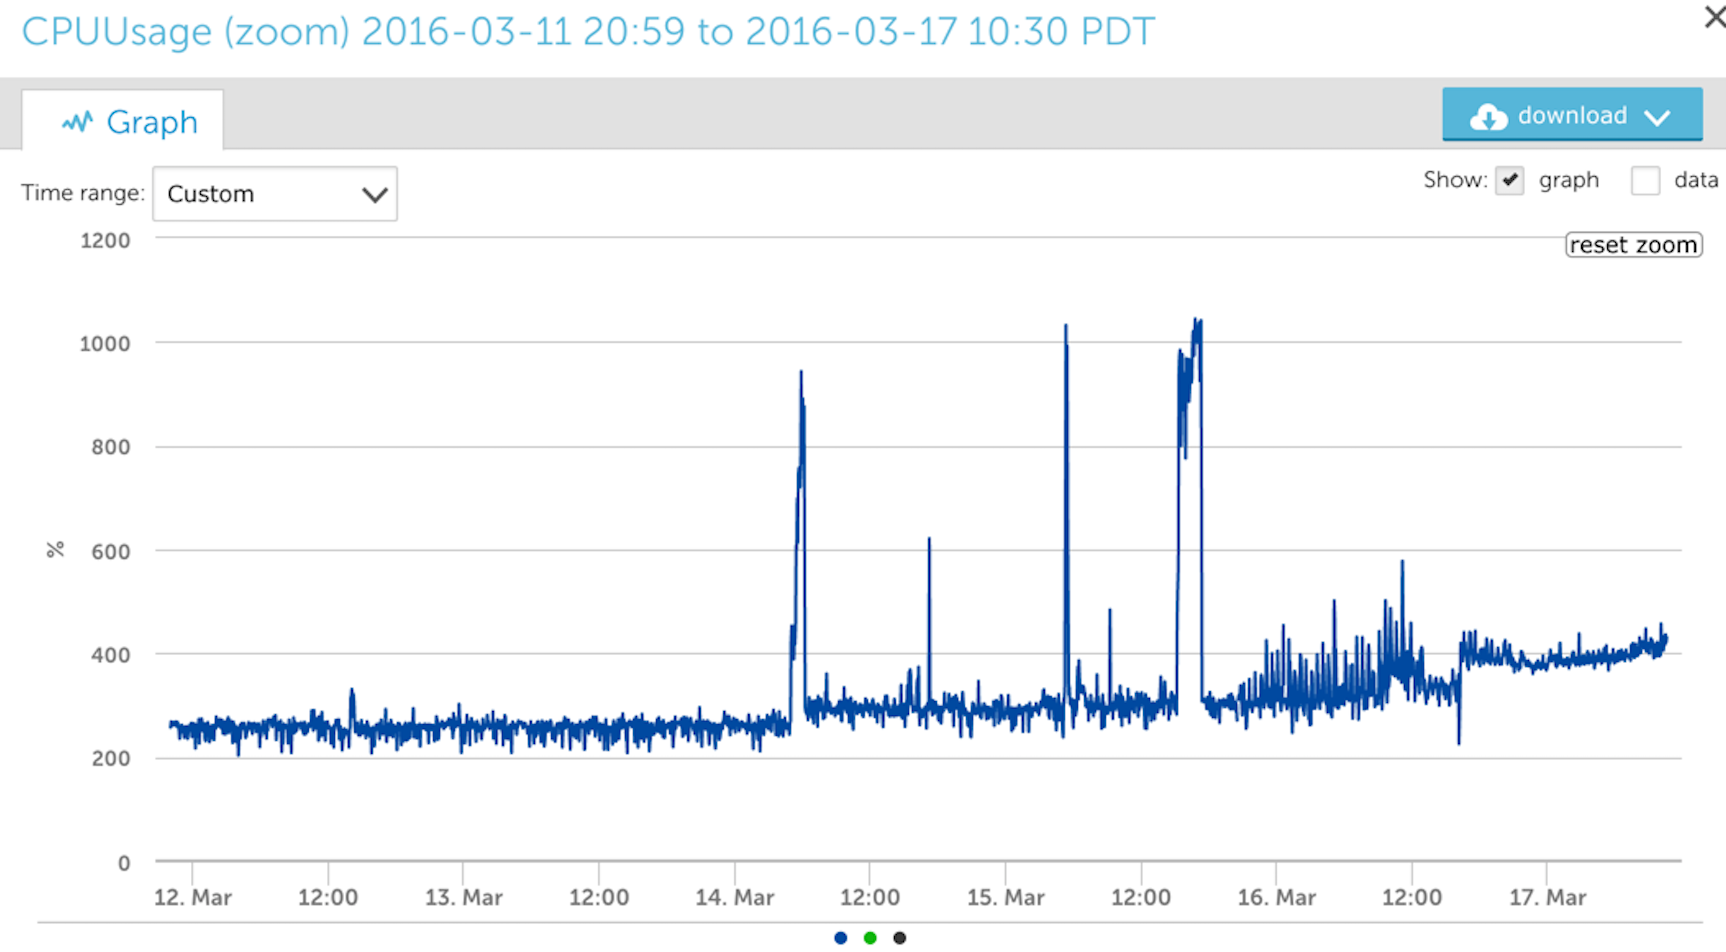
However with the new TSDB, we can see the underlying granularity of the data in a given time frame:
In addition to allowing you to drill down to see the raw data in any time period, our TSDB system is also the foundation for other impressive functionality that we’ll be rolling out, including correlation and different visualization methods.
For those interested in learning about why we wrote our own Time Series Database, instead of using an existing open source project, the answer is that with TSDB, we are able to achieve far greater performance targeted to our needs than we could otherwise. Stay tuned for further information on High Scalability architecture coming out soon, but some initial highlights are:
- Columnar-oriented datastore, supporting complex schema operations
- Supports 800K inserts/second on a single node
- 10:1 compression ratio
Having such a performant system to run in our clusters enables us to keep scaling our infrastructure efficiently, as our customer base scales dramatically.
TSDB is a great foundational advance, allowing for loss-less data storage for up to two years (for our Enterprise plans). It is also the foundation for many more exciting announcements in the future. More to come!