Our digs here at LogicMonitor are cozy. Being adjacent to sales, I get to hear our sales engineers work with new customers, and it’s not uncommon that a new customer gets a rude awakening when they first install LogicMonitor. Immediately, LogicMonitor starts showing warnings and alerts. ”Can this be right or is this a monitoring error?!”, they ask. Delicately, our engineer will respond, “I don’t think that’s a monitoring error. It looks like you have a problem there.”
This happened recently with a customer who wanted to use LogicMonitor to watch their large VMware installation. We make excellent use of the VMware API which provides a rich set of data sources for monitoring. In this instance, LogicMonitor’s default alert settings threw several warnings about an ESX host’s datastore. There were multiple warnings regarding write latency problems on the ESX datastore, and drilling down, we found that a singular VM on that datastore was an ‘I/O hog’ that was grabbing so much disk resource that it was causing disk contention among the other VMs.
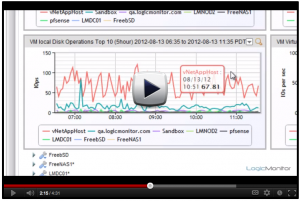
Finding the rogue host was easy with LogicMonitor’s clear, easy to read graphs. With the disk IO of the different VMs plotted on the same graph, it was easy to spot the one whose disk operations were significantly higher than the rest.
We’ve seen this particular problem with VMware enough that our founder, Steve Francis, made this short video on how to quickly identify which VM on an ESX host is hogging resources: (Caveat: You must be able to understand Austrailian)
All our monitoring data sources have default alerting levels set that you can tune to fit your needs, but they’re pretty close out of the box as they’re the product of a LOT of monitoring experience. This customer didn’t have to make any adjustments to our alert levels to find a problem they were unaware of with potential customer-facing impacts. The resolution was easy, they moved the VM to another ESX host with a different datastore, but the detection tool was the key.
If you’re wondering about your VMware infrastructure, sign up for a free trial with LogicMonitor today and see what you’ve been missing.
– This article was contributed by Jeffrey Barteet, TechOps Engineer at LogicMonitor

