We received some alerts tonight that one Tomcat server was using about 95% of its configured thread maximum.
The Tomcat process on http-443  on prod4 now has 96.2 %
of the max configured threads in the busy state.
These were SMS alerts, as that was close enough to exhausting the available threads to warrant waking someone up if needed.
The other alert we got was that Tomcat was taking an unusual time to process requests, as seen in this graph:
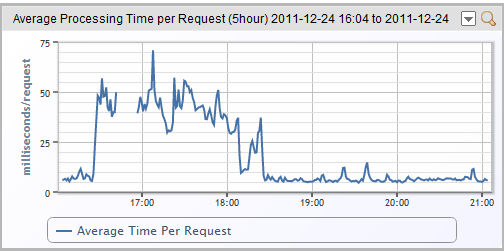

Normally we process requests in about 7ms, so 40 ms is a significant degradation.
Nothing was obviously wrong – our internal metrics showed the system processing no more data feeds, nor an unusual number of requests, nor were the disks or CPU any higher utilized than normal.
But as we trend all sorts of metrics, one did jump out, even though it was not alerting:
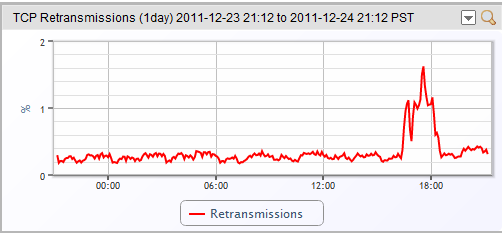

Turns out there was some minor packet loss between this datacenter and some customers in an upstream ISP. Nothing enough to trigger any network alarms. No loss or discards on our hosts or networks. But enough that some connections to Tomcat were subject to some loss, which meant re-transmissions, which meant connections were taking longer to complete than usual, which meant the server had to deal with more concurrent connections simultaneously, and was in danger of running out.
So, the simple fix: increase the supported max connections in Tomcat. We have plenty of resources available. You can see the max threads was increased at 16:48 to deal with the longer sessions, giving a bit of headroom. (It was a conservative increase, as it hadn’t been thoroughly tested – we’ll be testing and rolling out bigger max limits soon, just to give more space.)
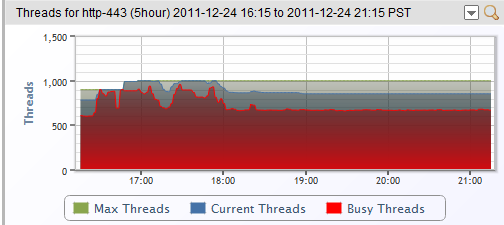

That allowed Tomcat enough spare threads to remove our alerts and any danger of refusing connections, and soon enough the upstream ISP resolved the loss issue, so session response time – and thus active threads – dropped to normal for this server.
Without LogicMonitor watching our own servers – well, we probably would have been ignorant of Tomcat getting close to exhausting the maximum available threads, and not alerted at all. Which may have led to a more peaceful Christmas Eve, but may have led to angry customers as they couldn’t have accessed their monitoring, or reported gaps in data after the fact – when we would have had no idea what the issue was, or how to prevent it. Even if we had been alerted by customers while the issue occurred, without the TCP retransmissions indicating what the underlying cause was – we’d still have been in the dark.
Just an example of why we call LogicMonitor disruptive InTelligence. With LogicMonitor, we avoided an outage, and had the information to diagnose the issue within a few minutes, which let us get back to family time. That’s disruptive – in the best way.
Happy Holidays.
