
A couple weeks ago we had a company Hackathon where employees hacked, or attempted to hack, various objects that expose data (think smart lights, drones, a Tesla, etc.) and integrate the data into LogicMonitor. Because LogicMonitor is a very customizable monitoring platform, you can write a custom datasource to monitor and alert on just about anything that reports data. The highlights below summarize some of the projects.
Jimmy Fallon and a Casual Tesla by Perry Yang
At LogicMonitor, not only do we use our own product to ensure IT uptime for ourselves and our customers, we take pride in the fact that our monitoring solution is robust enough to monitor, well, just about anything. Let me explain.
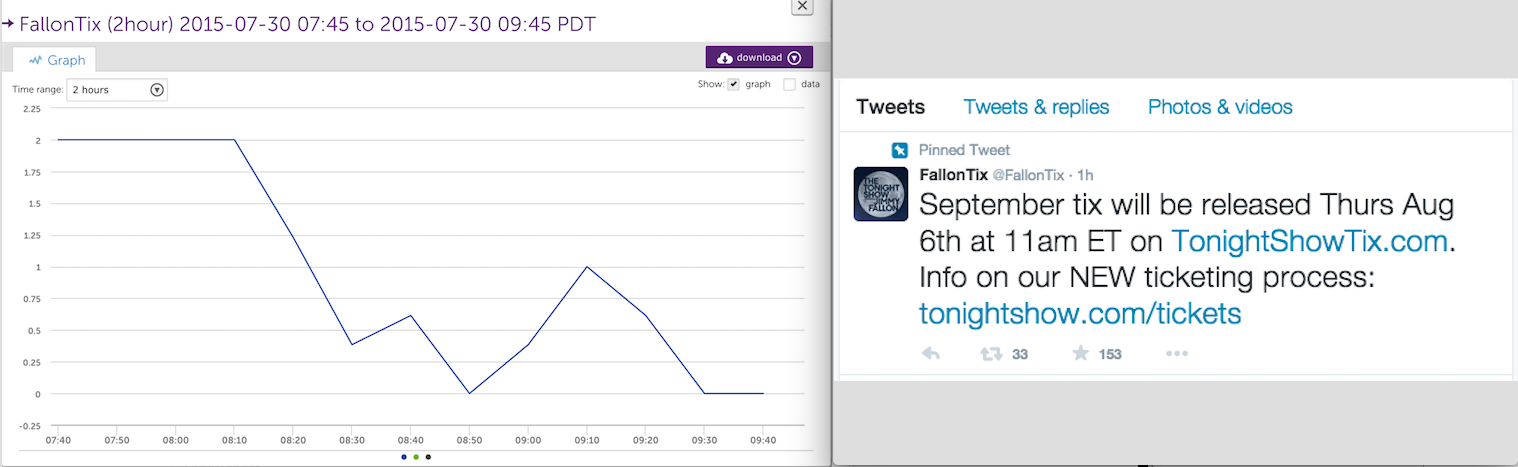
Recently I made a trip to New York City. Home of Broadway, the Statue of Liberty, rooftop bars that serve popsicles in champagne glasses, and the Tonight Show with Jimmy Fallon. This was my first time going to NYC, so seeing Fallon in action was pretty much the top of my list. However… Fallon tickets are not easy to come by. If you’re unfamiliar with the process, tickets to the highly coveted show are free, but their availability is first announced via twitter. As you can imagine, supply is low but demand is high. On my first trip to The Big Apple, I didn’t really want to check Twitter every day hoping for a ticket announcements. Side note: I don’t even have a Twitter account. So to avoid the hassle, I wrote a LogicMonitor datasource instead.
Using LogicMonitor’s robust script datasource utility, I wrote a program to use the Twitter API (by the way, their API documentation was harder to get through than a Steven Segal movie), added the script to a collector and had LogicMonitor graph out and alert on the latest number of tweets that contained the words “Ticket” or “September”.
LogicMonitor’s data collection options is only one of its many features. It is what you do with the data you collect that makes it stand out. Complex datapoints for example, use scripts or arithmetic to compute the data to be stored. They can use the output of other datapoints, or process datapoints through scripts.
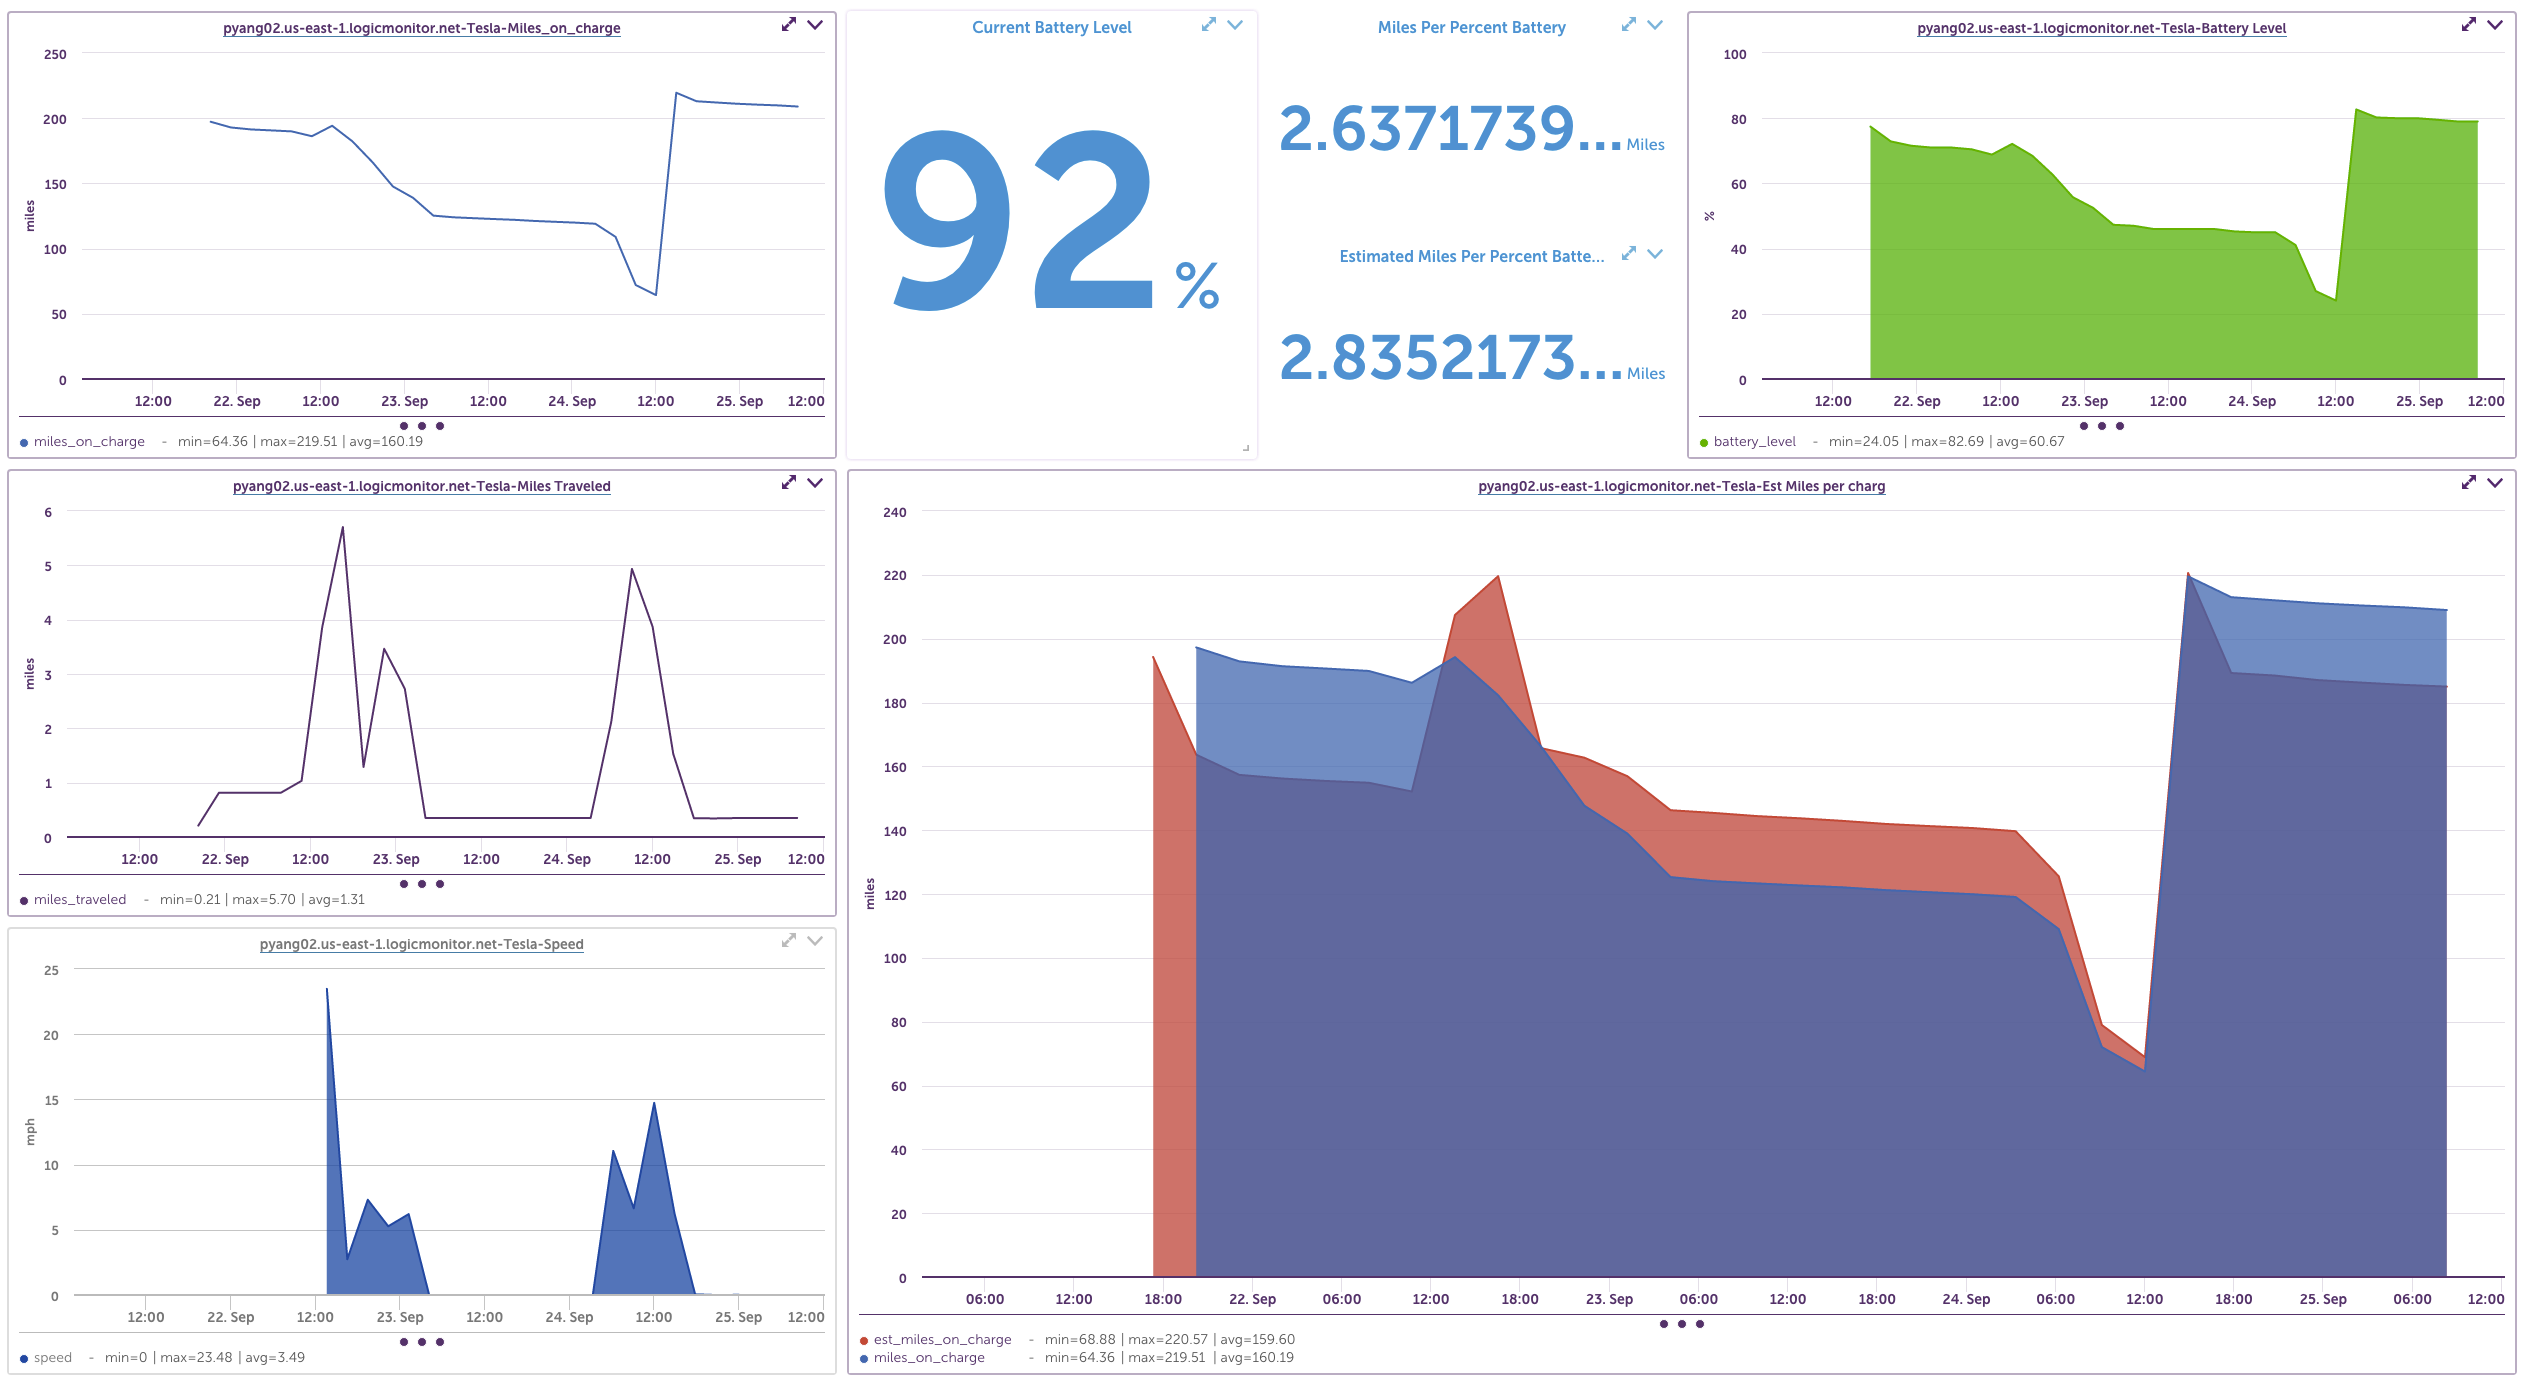
The datasource I wrote alerted me correctly to the release of the tickets – but in the end, I didn’t end up seeing Jimmy Fallon (sore subject). But shortly after I returned, LogicMonitor held a company-wide datasource creation competition to see what ways we can integrate or expose metrics into LogicMonitor. Casually, I decided to work on a Tesla that we rented. Tesla uses a REST API that not only allow us to do things such as honk the horn or start the car, but we can grab metrics that expose car speed, battery level, longitude/latitude, etc.
With complex datapoints, you are not restricted to just the raw data offered by the API. For example, instead of graphing total miles and the current battery percentage, you are able to use these numbers to calculate how many miles traveled per percent of battery. Similarly, you can use longitude/latitude output in the script to calculate distance travelled per collection time (a.k.a “speed”) and the distance of your overall trip.
So…. to all you operations guys out there who also happen to be Taylor Swift aficionados…the next time you want tickets just remember…the LogicMonitor “Try It Now” button is just a click away.
____________________________________________
Solar Panels by Sarah Terry and Ethan Culler-Mayeno
One of the things that makes the LogicMonitor platform so powerful is the fact that it is so customizable. You can create custom datasources to monitor pretty much anything that reports data. Given the popularity of solar energy, we decided to write a script datasource that uses the SolarEdge API to collect data from a SolarEdge inverter in a residential solar power system.
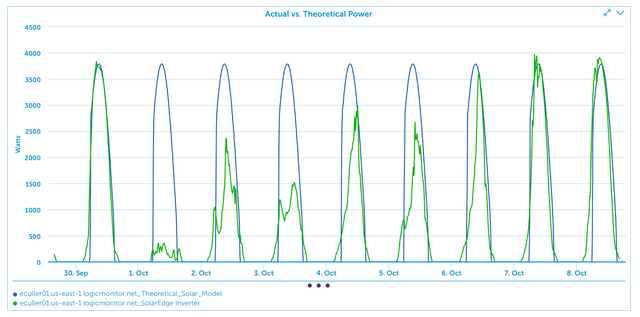
By itself the datasource enables us to comprehensively monitor the power production for the system, but ideally we’d have something to compare our monitored data to. So we decided to write another script datasource that calculates the theoretical power production based on day of year, number of solar panels, the normal vector of those panels, and couple of other parameters. The two datasources together allow us to compare the actual power produced by the system to the theoretical power that should be produced, and therefore assess the performance of the solar panels in the system.
It is in the best interest of homeowners and solar companies to know when system performance is degraded. Once they know that their power production is below the theoretical mark, it is pretty easy from there to figure out if the low production values are due to weather patterns (you’d expect to generate less power on a cloudy rainy day). If it isn’t the weather, under-performing solar panels could be an indication that trees need to be trimmed, solar panels need to be cleaned, or that other maintenance is required.
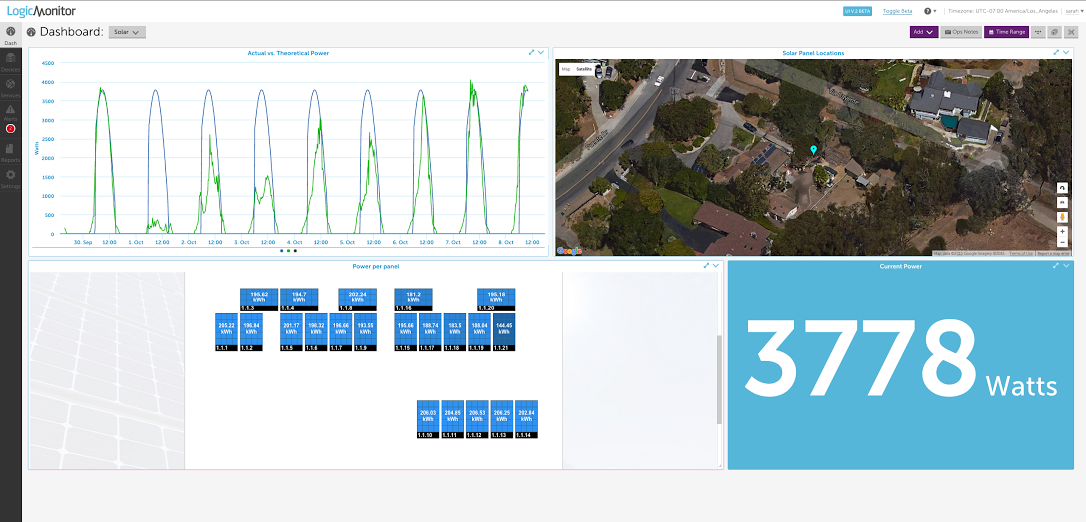
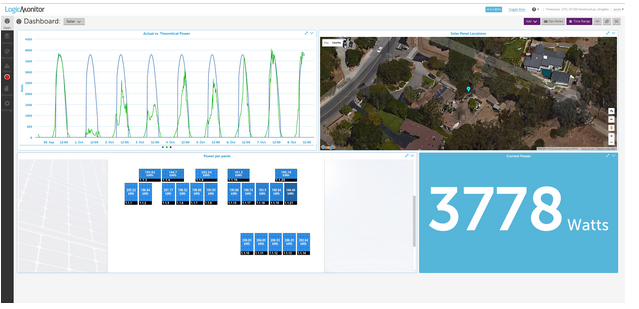
LogicMonitor’s robust Dashboards enable you to present different pieces of meaningful information together in one strategic view. We built the following dashboard to provide a referenceable overview of our monitored residential solar power system, including actual versus theoretical power, a satellite view of the panels themselves, the power produced per panel and the current power for all panels:
Many monitoring solutions are so painful to extend that they are only utilized for the most critical tier of metrics. Here at LogicMonitor, we believe that every system has metrics which should be monitored. Granted, solar metrics aren’t going to be useful for your average IT professional. However, whether you are working at an environmentally conscious startup who brags about “going green”, or a local solar provider who wants to ensure that their customers have the best experience possible, understanding the
performance of your infrastructure lets your company outshine the competition.
____________________________________________
Drones! Close but No Cigar by Sylvia Lowden
There’s one in every crowd. The use of personal drones has snowballed over the last several years. This growth has increased the problems caused by irresponsible users. Now the government is getting involved, particularly where public safety is concerned (around airports, public/political institutions, etc.). To protect these areas the concept of the “geofence” has emerged. This is essentially a virtual boundary beyond which a drone is prohibited from flying. While the technology still needs refinement, the basics exist and some drone manufacturers already accept their responsibility in keeping our airspaces safe.
The nice thing about these public spaces is that they don’t really change. Once a geofence is established, there will be ways to enforce compliance. However, drones have also obstructed firefighters attempting to use helicopters and airplanes for dumping water and fire repellants on wilderness areas. The lure of spectacular video seems to steal the drone pilots’ common sense. And since it’s impossible to predict the location of wildfires, a stationary geofence is of no help.
My idea was to provide a way for LogicMonitor to monitor a temporary geofence that would be constructed around a raging forest fire. Any intrusion would be immediately relayed to the FAA and local authorities so the perpetrator could be identified and dealt with. There were many obstacles to this idea. The two most relevant to the Hackathon were the lack of published APIs or MIBs for the drone we had and the fact that I managed to break the drone after a few hours of playing with it (apparently longevity is not a drone’s strongest trait).
Google has filed a patent for such a geofence. Perhaps someday LogicMonitor will work with Google’s geofence to help keep drones of areas where fire fighters are working to suppress raging forest fires!