We here at LogicMonitor use our own service to monitor the various parts of our infrastructure, and doing so demonstrates the financial value that LogicMonitor brings.
The more you instrument with LogicMonitor, the more power it has. In the cases below, the information and alerts that LogicMonitor presented allowed us to avoid spending money on more hardware – and with LogicMonitor’s availability requirements, each hardware purchase usually means 3 x the hardware (active/passive at the datacenter in question, and failover hardware present in a different datacenter.)
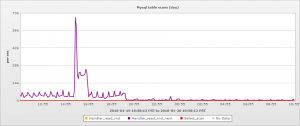
One case was relatively straightforward – a review of the MySQL performance monitoring metrics revealed that the number of rows read due to read_rnd_next operations was very high – in the tens of thousands per second. (For those of you not DBAs, this is the number of rows MySQL reads sequentially in order to satisfy a read request – an indicator that indexes are not being used.) A quick bit of investigation by our programmers revealed a query written in such a way that MySQL was not using the existing indexes. This was rewritten, and on our release, the MySQL table scans dropped dramatically:
This saved the system’s CPU load, disk load, and improved the response time for users.
However, a more dramatic demonstration came a week or so later, when one cluster started getting disk bound. An increase in customers, combined with some newly released features that added extra load, meant that one cluster was reaching the capacity of its hardware (or so I thought.) Average response time was hitting what we regarded as limits, and my thought was that we’d have to throw hardware (meaning money) at the issue.
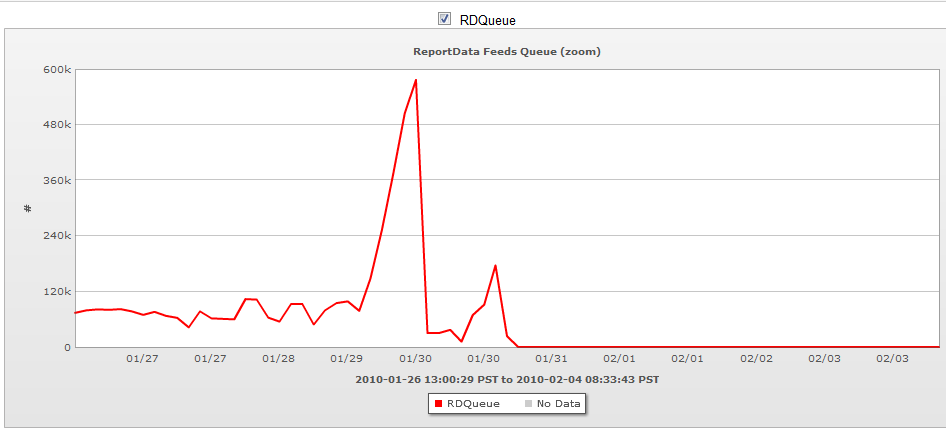
However, using custom application metrics that the LogicMonitor system exposes (in our case via JMX monitoring, as our system is written in Java, but the data could have been collected by any of a variety of mechanisms, from perfmon counters, to web page content, to log files), it was apparent that the load was solely due to one particular processing queue. Our CTO investigated the caching algorithm that is applied to the data in this queue, and was able to tune it so that it was much more effective, as can be seen from the graphs below:
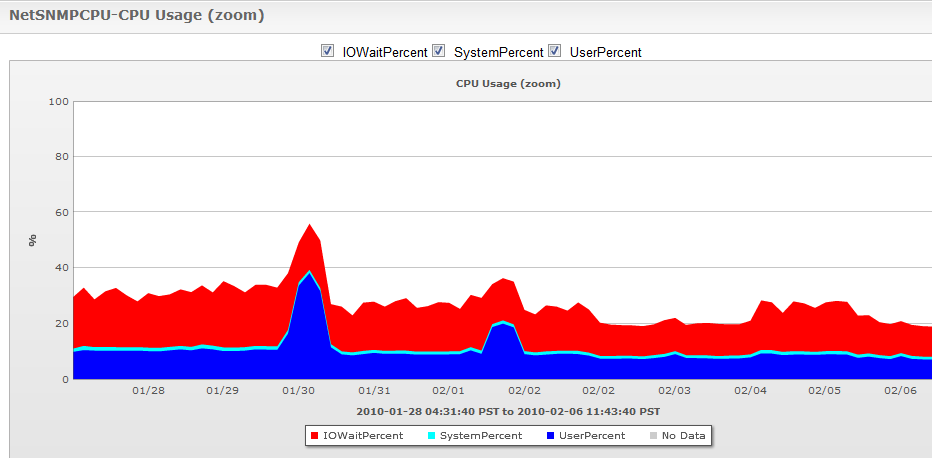
This dropped the CPU load of the cluster:
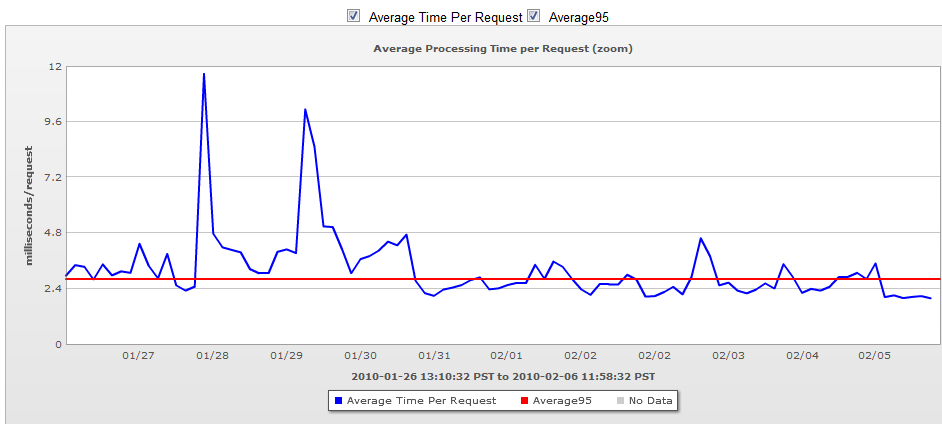
And also improved the servers’ response time:
So while LogicMonitor did not directly solve the problem, the extensive application monitoring did warn us that an issue was arising, and pinpoint where in our system the bottleneck was, and allowed our staff to focus their investigation on the one particular queue, rather than all components of the system. It also allowed us to see the effectiveness of the changes on our staging systems, before we released to production.
LogicMonitor’s application monitoring saved us many thousands of dollars, and many hours of engineering time. Both things in limited supply at any company.


