
LogicMonitor’s CloudWatch Events integration enables you to minimize troubleshooting time by displaying contextual events for your monitored resources alongside performance data. Many routine events, such as deployments, resource provisioning and de-provisioning, or configuration changes, have the potential to impact resource performance. Without being able to see the event in the same context as the performance data, it can be challenging to correlate the two. LogicMonitor Ops Notes solve this issue by providing a visual eventstream, and enabling the display of events on top of performance data graphs.
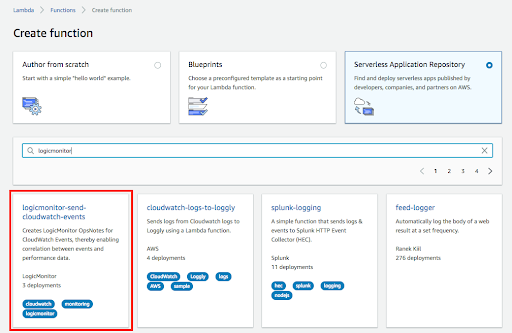
Events can be especially relevant for cloud services, where traditional visibility into the underlying infrastructure is unavailable. AWS provides a variety of services, including CloudWatch Events, that provide users with information about the various events that occur for their cloud resources. With LogicMonitor’s ‘logicmonitor-send-cloudwatch-events’ function in the AWS Serverless Application Repository, you can configure CloudWatch Events to be added as Ops Notes in LogicMonitor.
When you deploy the function, you can select which AWS services CloudWatch Events should be sent to LogicMonitor. The function will be triggered for events of selected services and uses LogicMonitor’s API to add Ops Notes for the monitored resources which relate to the events.
For example, you may find this useful for visualizing when EC2 instances are terminated and launched for your AutoScaling Group, in the context of the performance of that AutoScaling Group:
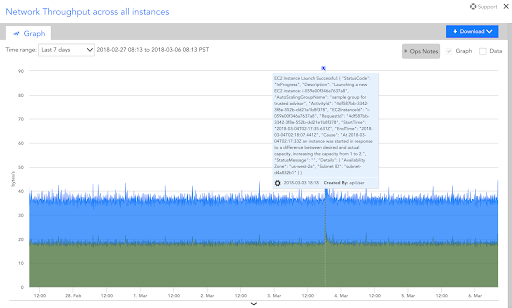
The above graph displays aggregate network throughput across all EC2 instances in an AutoScaling Group, with an Ops Note indicating where a new instance was launched. The note only appears for the AutoScaling Group in which the new instance was launched, and displays all relevant launch details when selected. When the new instance was launched in AWS, the ‘logicmonitor-send-cloudwatch-events’ function was automatically triggered to identify the relevant AutoScaling Group in LogicMonitor and add the note. Such a note enables users to easily correlate how the addition or removal of an instance from an AutoScaling Group impacts the group’s overall performance.
Additional use cases include visualizing container state and task definition changes for ECS clusters alongside cluster performance, API requests via CloudTrail alongside performance metrics for particular services, bucket or object level operations alongside S3 performance, and more.
CloudWatch Events can help your team understand the cause of resource performance changes, and LogicMonitor’s Lambda function makes it easier than ever to connect the dots. For more information about the ‘logicmonitor-send-cloudwatch-events’ lambda function, including deployment instructions, see this page. Sign up for a free LogicMonitor trial today!

