
Google Kubernetes Engine (GKE) is a managed Kubernetes service that makes it possible to run Kubernetes clusters without managing the underlying infrastructure. With GKE, DevOps teams can scale and deploy applications faster with Kubernetes, while spending less time on cluster maintenance and configuration. Obtaining enough insight into GKE is key to proactively preventing downtime and maximizing application performance. With LogicMonitor’s new Kubernetes Monitoring, you can get this insight into your GKE environment alongside the rest of your hybrid infrastructure.
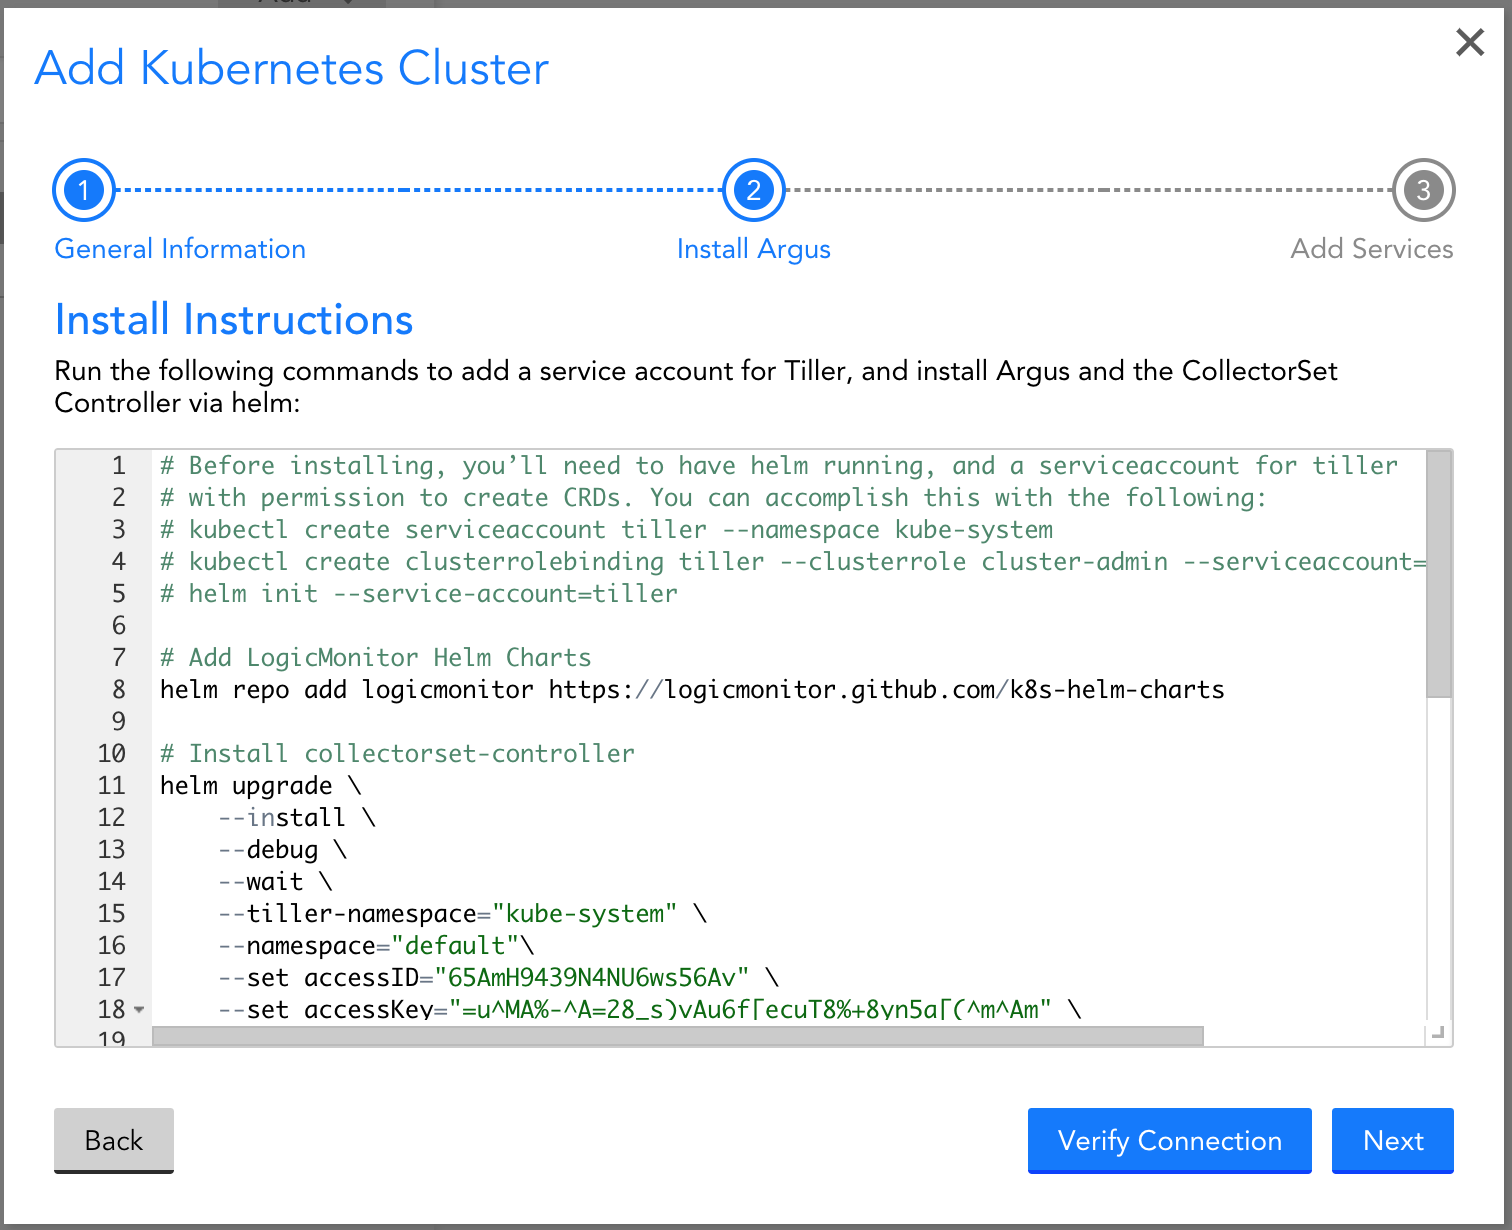
To get started, simply add your cluster into monitoring by installing LogicMonitor’s Kubernetes Monitoring Integration via Helm. Within LogicMonitor, you can get the necessary Helm commands via an easy to use wizard:
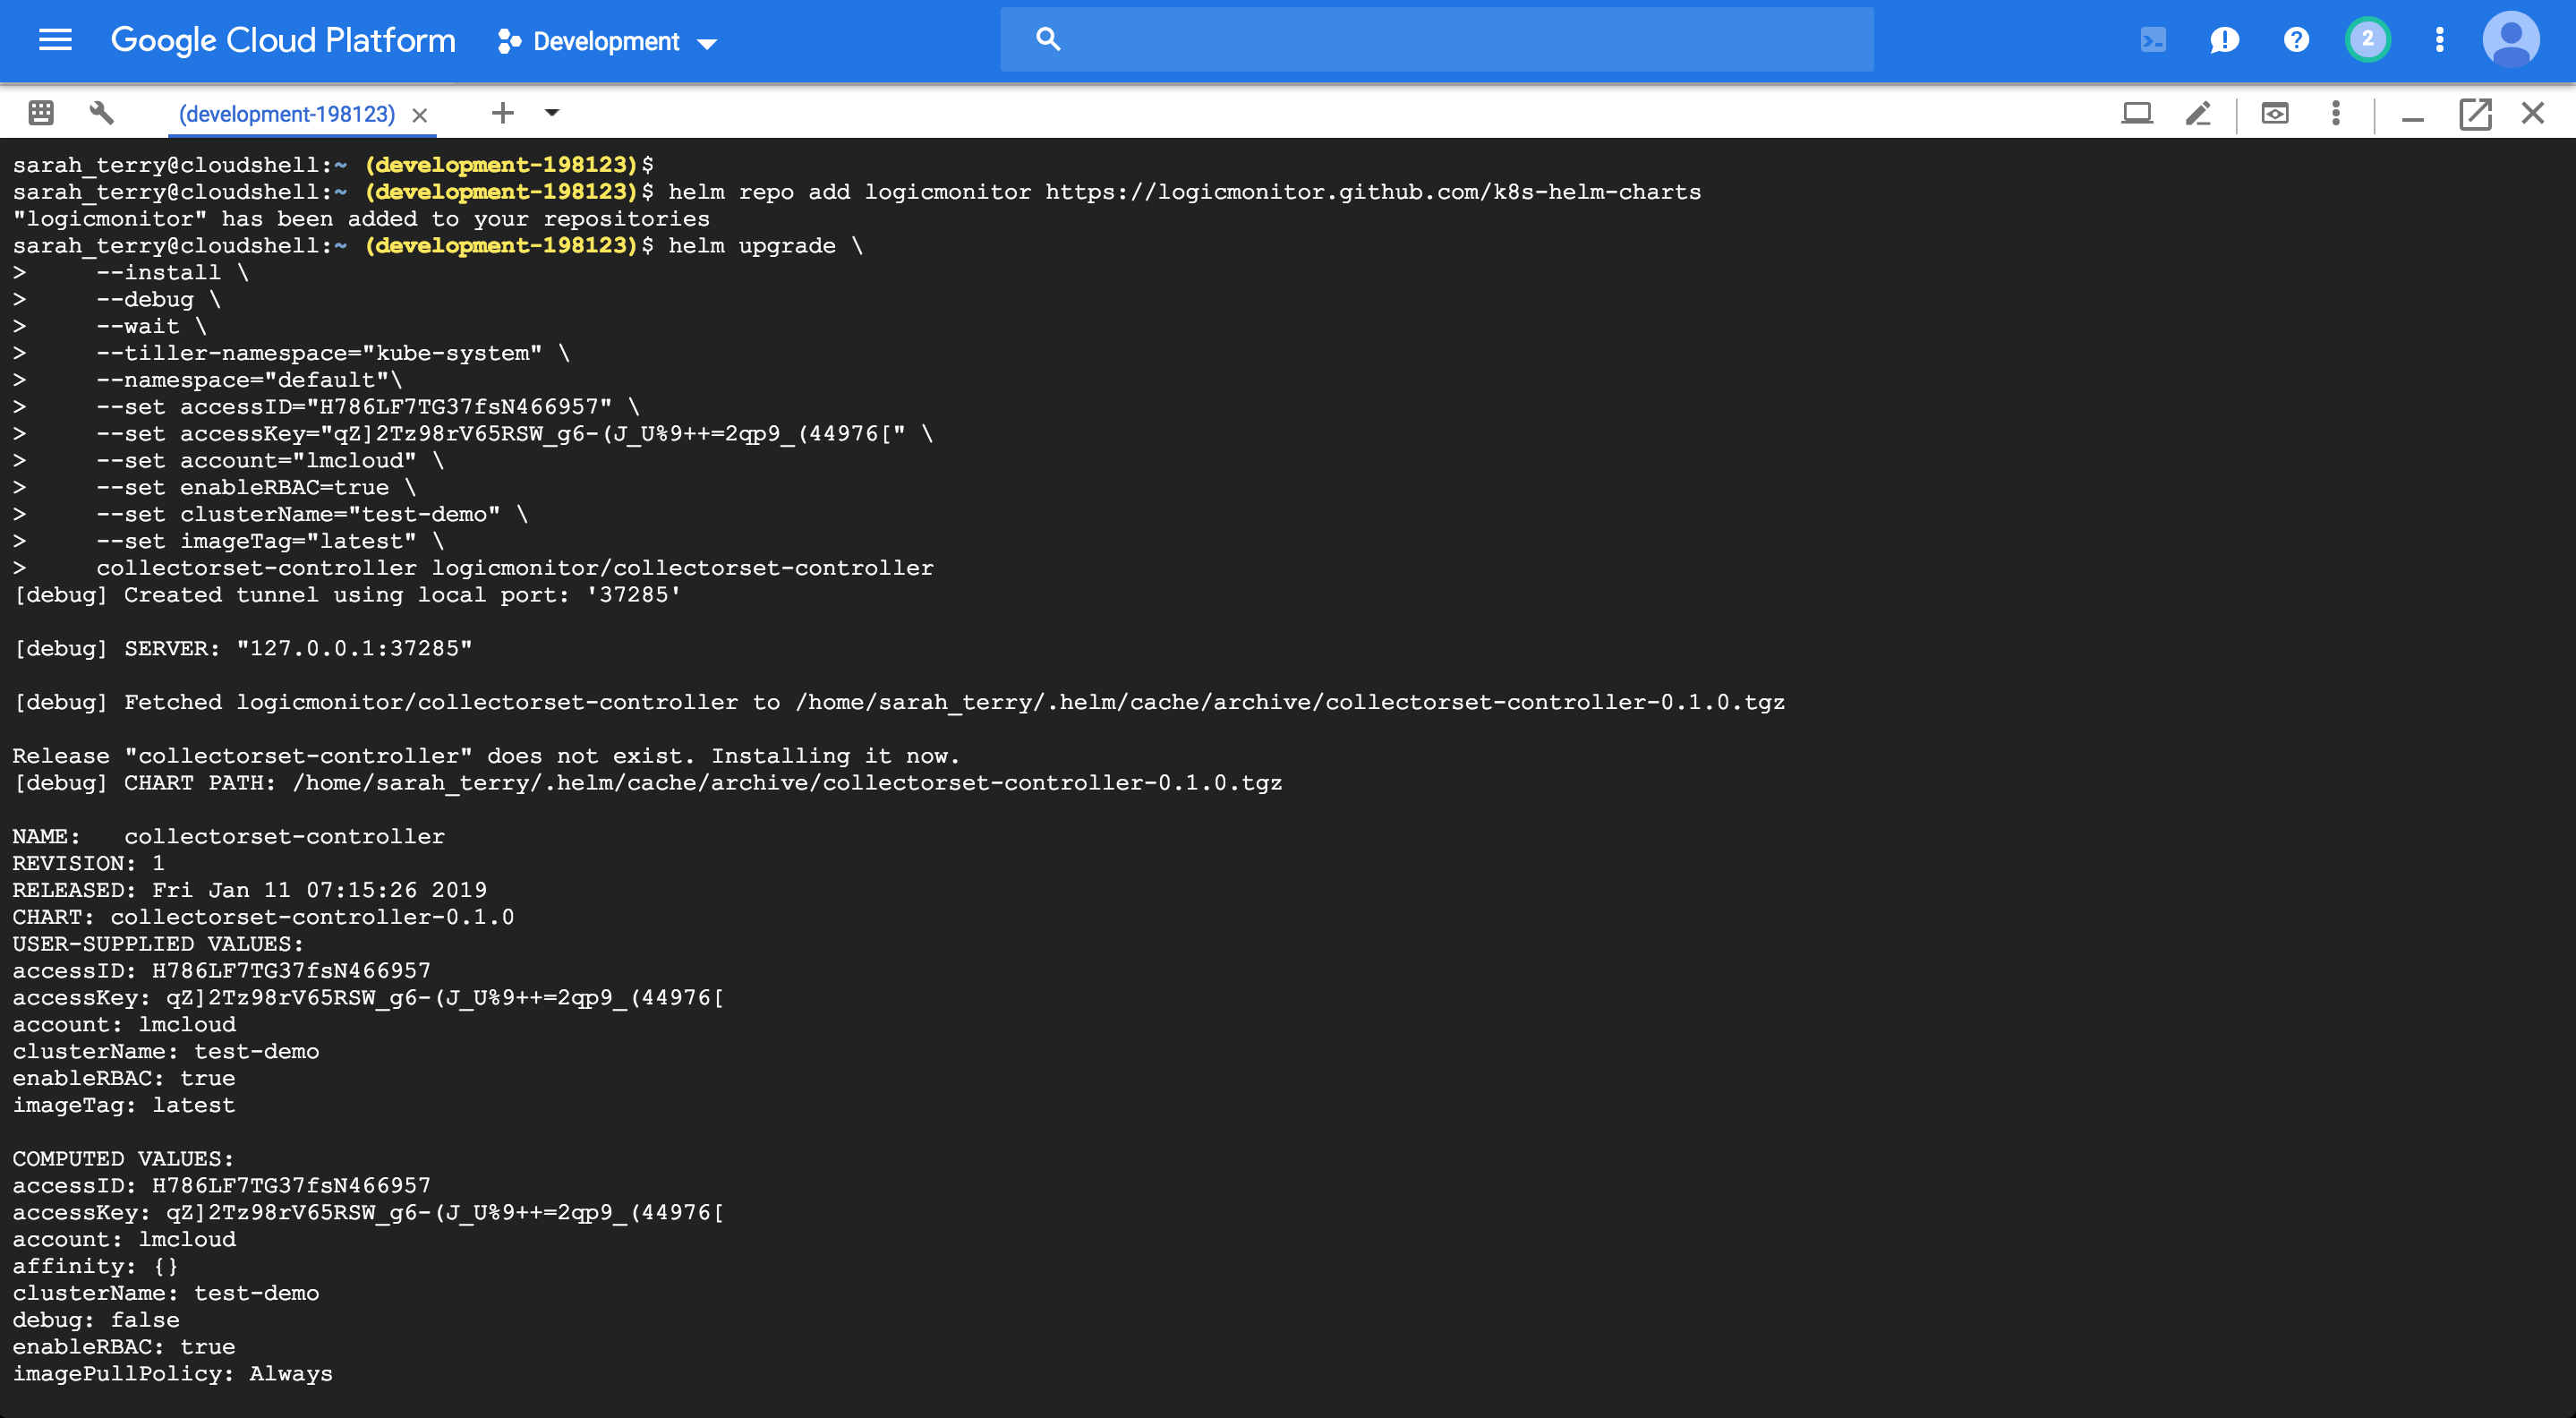
You can use the GCP Cloud Shell, or the tool of your choice, to install the integration via Helm:
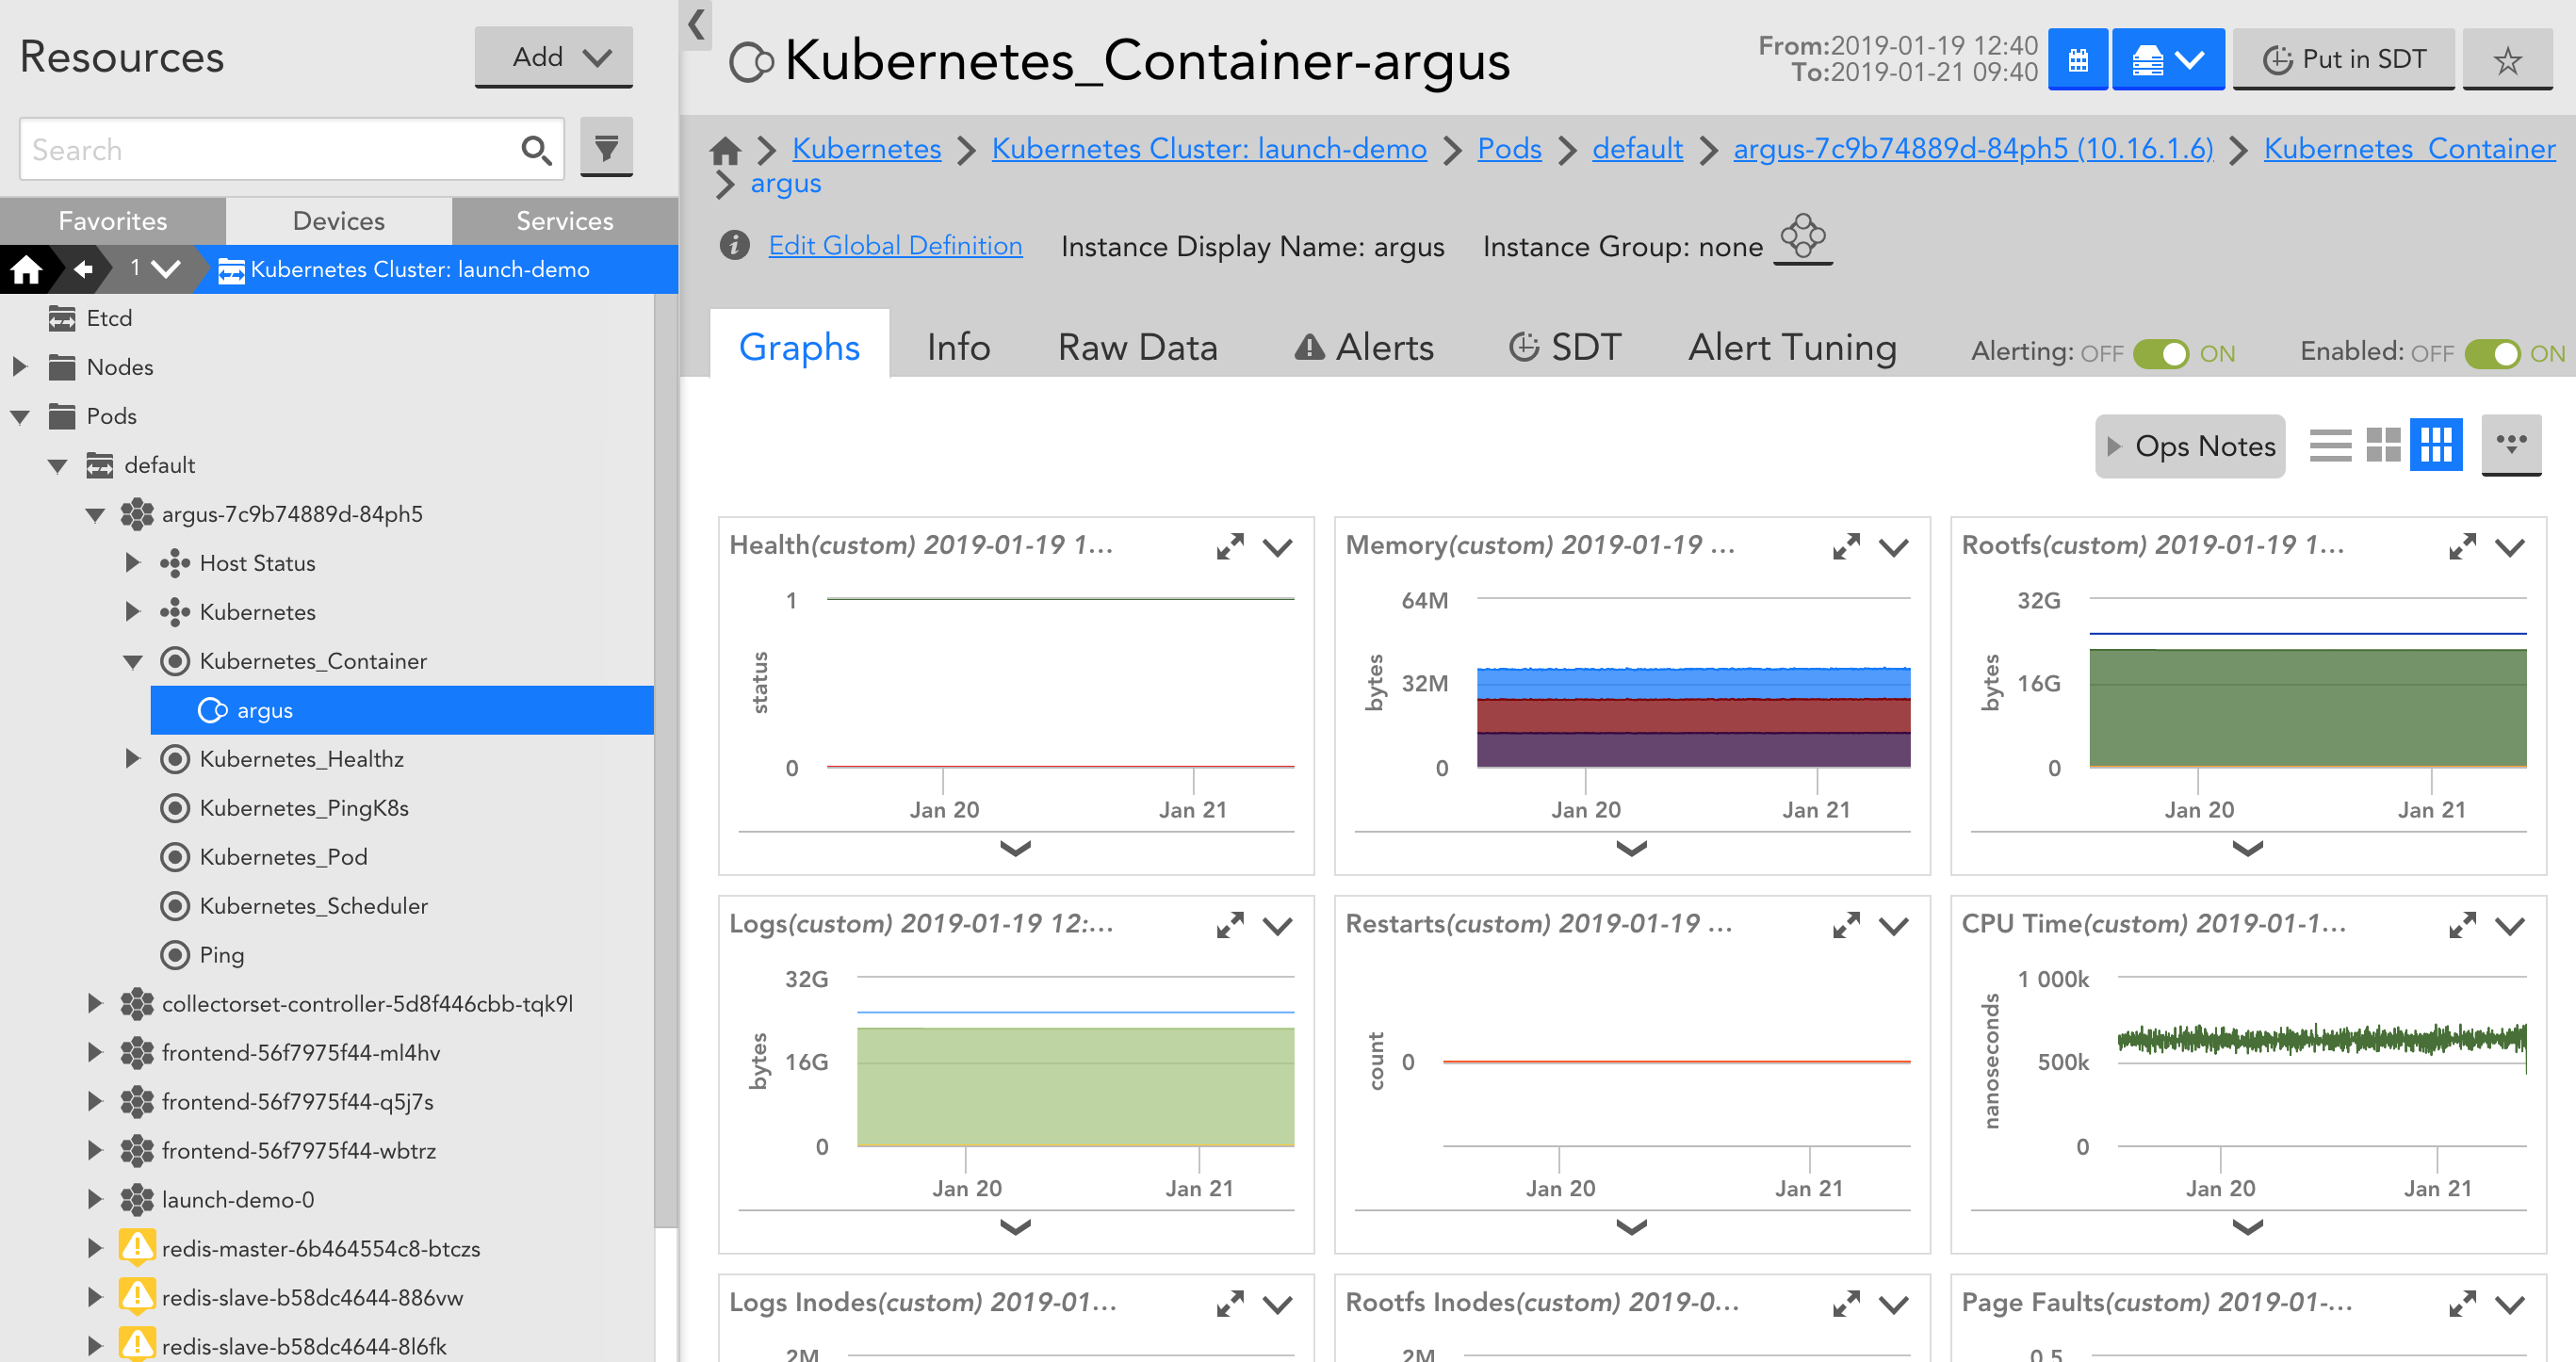
LogicMonitor will automatically discover the Nodes, Pods, Containers, and Services in your cluster and add them into monitoring:
In addition to automated discovery, you’ll benefit from out of the box metrics for Nodes, Pods, Containers, Services, the Kubernetes Control Plane, and standard applications (e.g. Redis, MySQL, etc.), as well as pre-configured alert thresholds. You don’t need to edit configuration files or manually configure metrics to be monitored – when we say out of the box we mean it really works out of the box! We have a team of monitoring engineers that pre-configure metrics to be monitored and where default alert thresholds should be set. This means that you’ll get instant visibility into your GKE clusters and the applications running within. Aside from application-specific performance metrics, here are a few key Kubernetes metrics to keep an eye on:
- Pod condition phase: Monitoring Pod phase allows you to identify Pods with containers that terminate in failure, Pods that are stuck in a pending state due to insufficient resources, or when the state of the Pod cannot be obtained due to a communication error.
- Pod ready status: Pod ready status indicates whether or not the Pod is able to serve requests and should be added to the load balancing pools of all matching Services. Monitoring this status enables you to identify when a Pod isn’t ready to be scheduled and may indicate an issue that needs to be resolved.
- Control plane status: The Kubernetes control plane includes the scheduler, API server, controller manager, and etcd. The status of these components is critical to successful workload scheduling and a healthy cluster. As such, you should monitor the control plane and alert when components are unhealthy. LogicMonitor has these alert thresholds pre-configured, so you’ll get alerts out of the box.
- Node CPU and memory limit, request, and usage percent: The percentage of CPU and memory limits, requests, and usage for the node compared to the overall CPU and memory available. CPU and memory requests specify the minimum required resources summed across the Pods running on the node. Limits specify a maximum CPU and memory that these Pods are allowed to consume. Pods are scheduled based on their requests. Monitoring limits and requests alongside usage enables you to identify where you can optimize these resource reservations, and better utilize your node allocatable resources.
GKE makes it easier than ever to run Kubernetes clusters, and with LogicMonitor’s new Kubernetes monitoring you can ensure complete visibility into these clusters. Sign up for a free trial today!

