
Google Cloud Platform’s (GCP) Cloud SQL is a managed MySQL and PostgreSQL database service. This service enables you to quickly set up and manage databases for your applications without having to maintain the underlying infrastructure.
Eliminate monitoring gaps
Obtaining visibility into the health and performance of your Cloud SQL database instances is important to proactively prevent downtime. Using a monitoring tool that can give you visibility into your Cloud SQL database instances and the rest of your infrastructure, whether it’s cloud or on-premisess, will help you eliminate monitoring gaps and troubleshoot issues more quickly. With LogicMonitor’s new GCP support, Cloud SQL database instances are automatically discovered and monitored alongside the rest of your hybrid infrastructure.
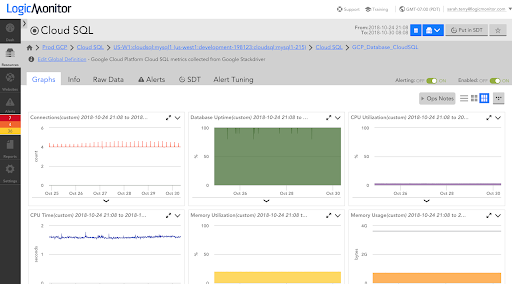
To get started, simply provide LogicMonitor with a service account that has a viewer role for the project(s) your Cloud SQL instances are in, and we’ll take it from there! Cloud SQL database instances will be automatically discovered, all available metadata will be added as LogicMonitor properties for these database instances, and data collection will begin. Among the metrics monitored for Cloud SQL, you should pay close attention to the following:
-
CPU and memory utilization
Insufficient CPU or memory can seriously impact application performance. If utilization is high, you may consider increasing the Cloud SQL instance size.
-
Disk utilization
Running out of disk space can bring your application to a halt. Even if you’ve opted for automatic storage increases, it’s still a good idea to keep track of disk utilization since these automatic storage increases will add to your GCP costs.
-
MySQL connections
It’s important to ensure that the number of connections to the Cloud SQL MySQL instance doesn’t exceed the connection quota for your GCP project.
-
Auto-failover requests and replication lag
Auto-failover occurs for HA Cloud SQL database instances when the primary instance becomes unavailable. The amount of time it takes the failover instance to catch up to the primary instance state depends on the replication lag. Ensuring that the replication doesn’t become excessive can speed up failover events and minimize impact to your applications.
In addition to monitored metrics, LogicMonitor’s monitoring engineering team configures default alert thresholds, so you’ll automatically get alerts when the CPU utilization, disk utilization, or memory utilization for your Cloud SQL database instances exceeds 85%. You can easily customize these thresholds as needed to fit your environment.
When you add your GCP projects into monitoring, LogicMonitor automatically populates dashboards in your account to provide instant visibility into your Cloud SQL database instances:
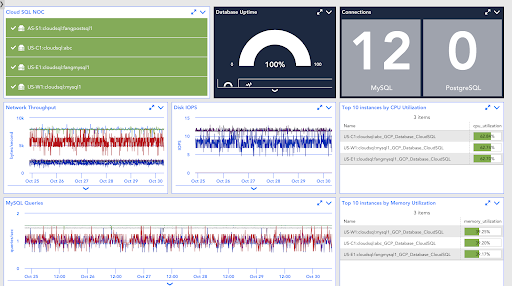
With LogicMonitor you can monitor your GCP environment, including your Cloud SQL database instances, alongside the rest of your cloud and on-premisess infrastructure in a single pane of glass.
If you’re not a customer yet and want to check out LogicMonitor’s industry-leading cloud monitoring and cost management capabilities, start your free trial today.
Want to see more? Follow us here:
On Facebook
On Twitter
On LinkedIn
Or, e-mail us @ [email protected]

