Long live Linux monitoring.
By which I mean that, unless you are a kernel developer or some other individual with esoteric purposes, having Linux up and running is not the point of your servers. Your servers are there to DO something, whether that’s to serve web pages, answer database requests, or provide the best hosted monitoring service.
So…what do you monitor?
Well, in the case of a server whose main point is to be part of a cluster of Apache web servers – monitor Apache. Check that it’s running; returning the content you expect it to return; the number of busy server threads, throughput per second, etc.
Congratulations, you’ve monitored the most important thing about that server. But that doesn’t mean you are done. This is where the Linux monitoring comes in. If your server is to serve http requests with Apache, it needs CPU resources. It needs memory. It definitely should not be swapping. If there are any issues to resolve, that will be much easier if NTP has synch’d the server’s time. You’ll want to know about hard drive failures; power supply issues, temperature. You’ll want to know if the SSL certificate for your web server is approaching expiration (and you’ll want to know that a few weeks in advance.) You’ll want to know if file systems are filling up; if physical disks are approaching their maximum in terms of IO operations per second, increasing CPU wait time. If interfaces are having errors, drops or discards. If the mail sent by the server is bouncing, being delivered, or rejected.
All these aspects are important to monitor so that you will know if your server faces any issues that will prevent it from fulfilling its destiny – of serving web pages.
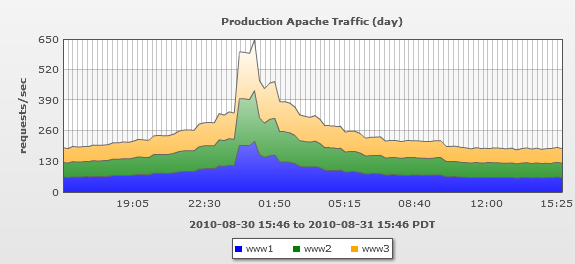
And of course as this server is part of a cluster, you want to graph its throughput with the other servers, so you can see overall performance, and also compare different servers to each other:

And this is just for one server, with one application. If your server runs a java webserver, or a database, or memcached – there’s suddenly a lot more things to monitor, just to get “Linux Monitoring”.
So what’s the point? I’ve said it before, and will say it again, but automation is essential. If your monitoring is cumbersome to get new servers monitored completely, guess what – you won’t monitor them completely. Which will increase your outages, and increase time to resolution. The more you monitor, the quicker you can resolve issues, as issues are often not where you’d expect.
A quick query shows that a typical server in our lab has 382 datapoints monitored on it after a default install, just by entering its hostname into LogicMonitor. If we had to configure the monitoring ourselves, the number would more likely approach 1 for lab machines (“does it ping?”), especially as we fire up new virtual machines in the lab regularly. But that would mean our developers would miss all sorts of MySQL and Tomcat metrics that they routinely use to improve the next release of our product. And our Ops team would not have good history of performance metrics, like average request service time, so they can identify when issues were introduced on the QA servers. And QA would be held up as our QA systems would not be as highly available.
So for us, automation has both decreased work, and increased productivity in all sorts of unexpected ways. How has it benefited you? Or how could it?
