
With the vast number of AWS services and the various ways for which they are billed, cost monitoring and optimization can be complex. Ensuring that your team has the utilization, performance, and spend data necessary to drive cost optimization in the cloud is important, and typically requires multiple tools.
We recently announced new LM Cloud monitoring for AWS Billing that makes cost analysis and optimization simpler. While we’ve monitored AWS billing data for a long time via the AWS Detailed Billing Report, the new monitoring, based on AWS Cost & Usage Reports, is more dynamic and comprehensive. The new Cost & Usage Report-based billing monitoring is intended to provide the actionable data you need to confidently scale your AWS cloud environment. We’re releasing a new set of DataSources that, out-of-the-box, track spend by region, service, account and operation. You can customize this further by enabling monitoring of costs associated with tagged resources.
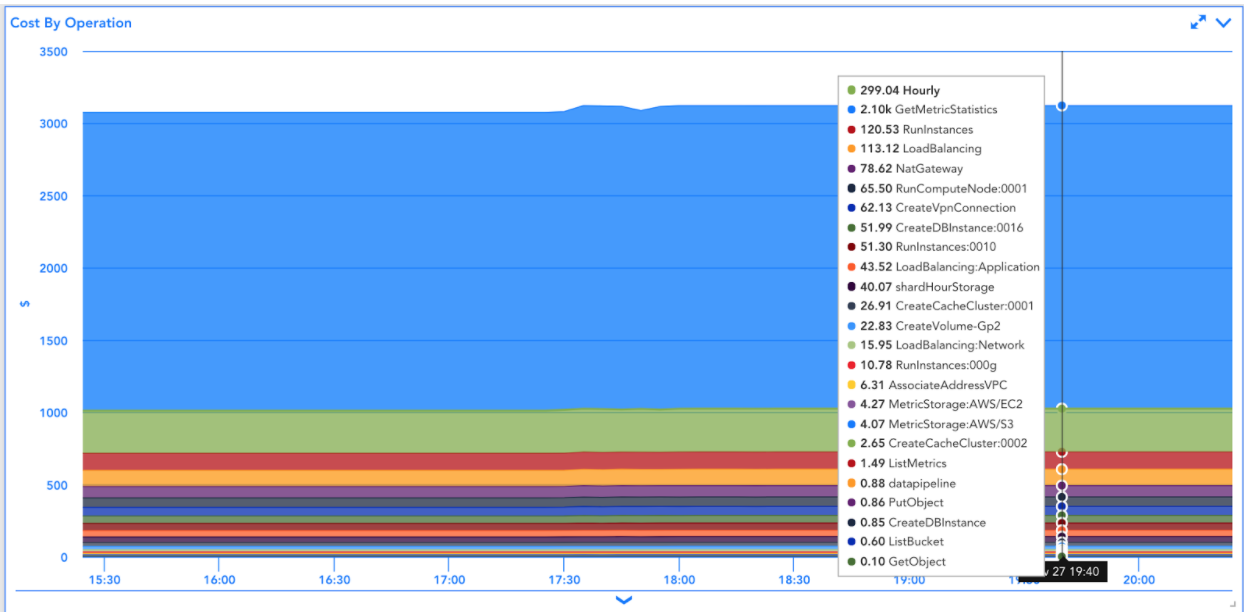
With the upcoming retirement of their Detailed Billing Report, AWS recommends the Cost & Usage Report for a granular breakdown of spend. LogicMonitor dynamically identifies account IDs, Regions, AWS Services, and line item operations from the Cost & Usage Report data, and the cost associated with each is monitored. This enables you to track cost per account for consolidated billing setups, cost by region and service, and additionally allows you to see what operations (across services) you’re spending the most on. New region or service announced by AWS? New account added to your consolidated billing setup? No problem- because services, regions, and accounts are dynamically identified, they will be added into monitoring automatically.
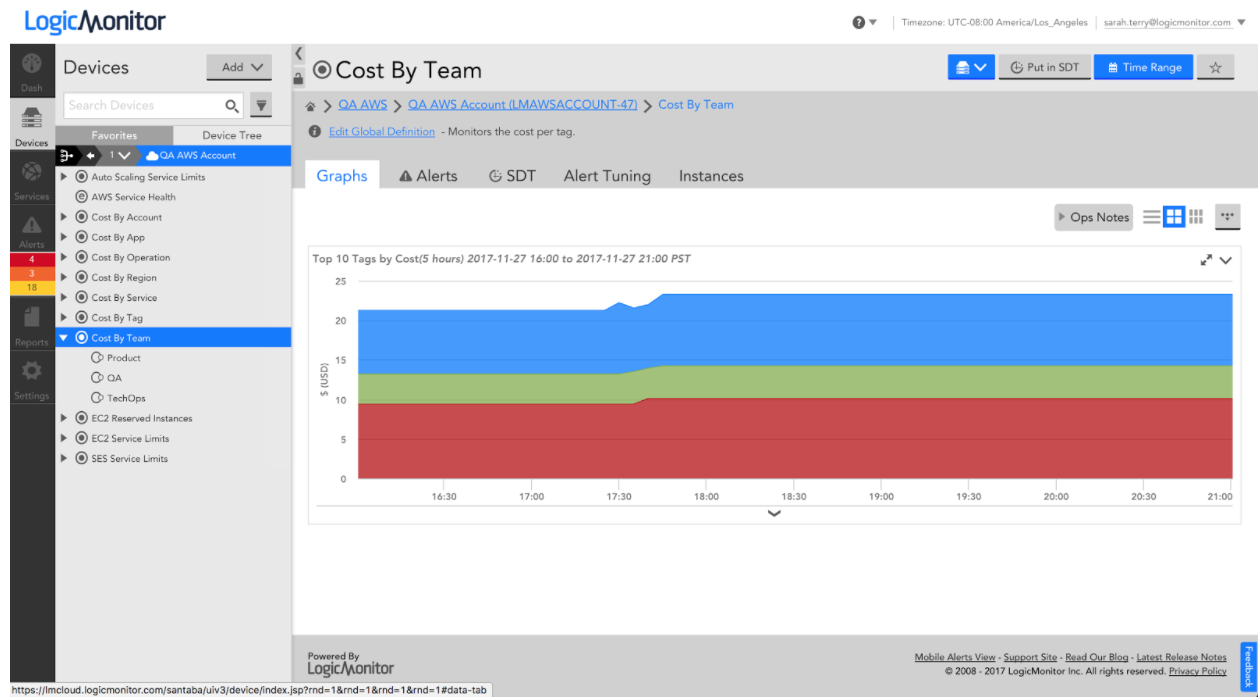
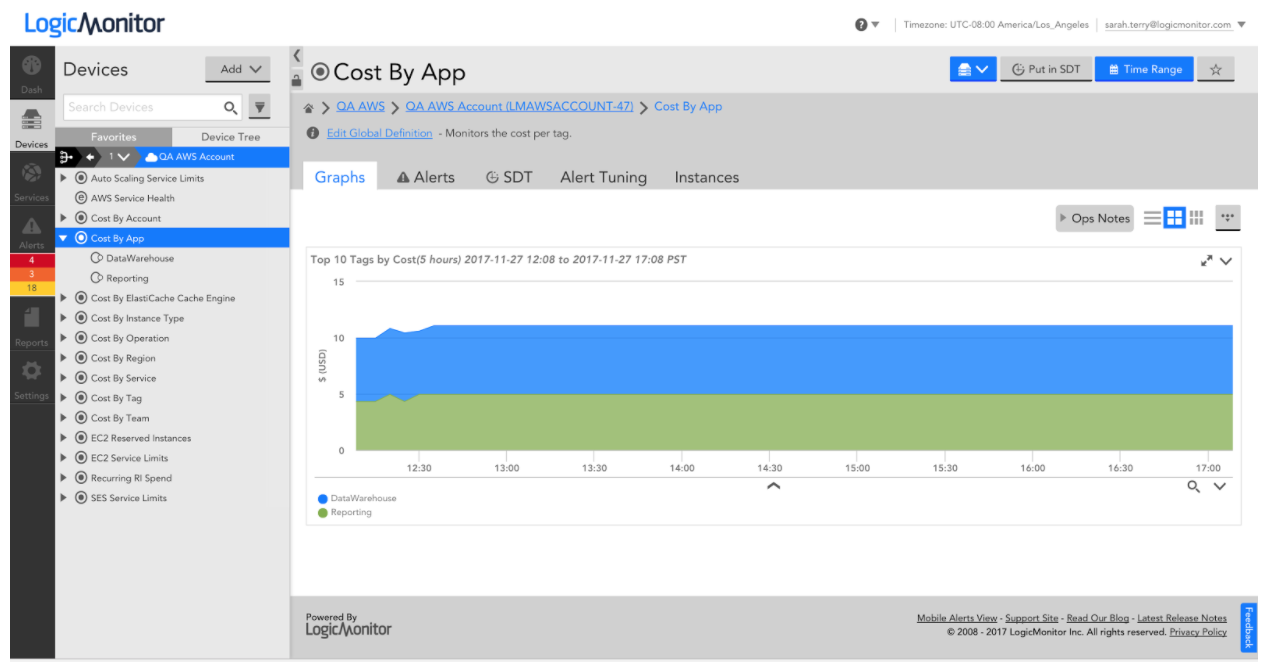
It’s easy to additionally enable monitoring by tag – simply add an instance in LogicMonitor specifying the tag name and value. Tag resources by team or application to get insight into how much you’re spending across teams or critical applications, and where you can optimize costs.
With performance and spend data in a single platform, and LogicMonitor’s powerful dashboarding capabilities, you can visualize everything in a single pane of glass. We created the following dashboard for a bird’s eye view of our AWS spend:
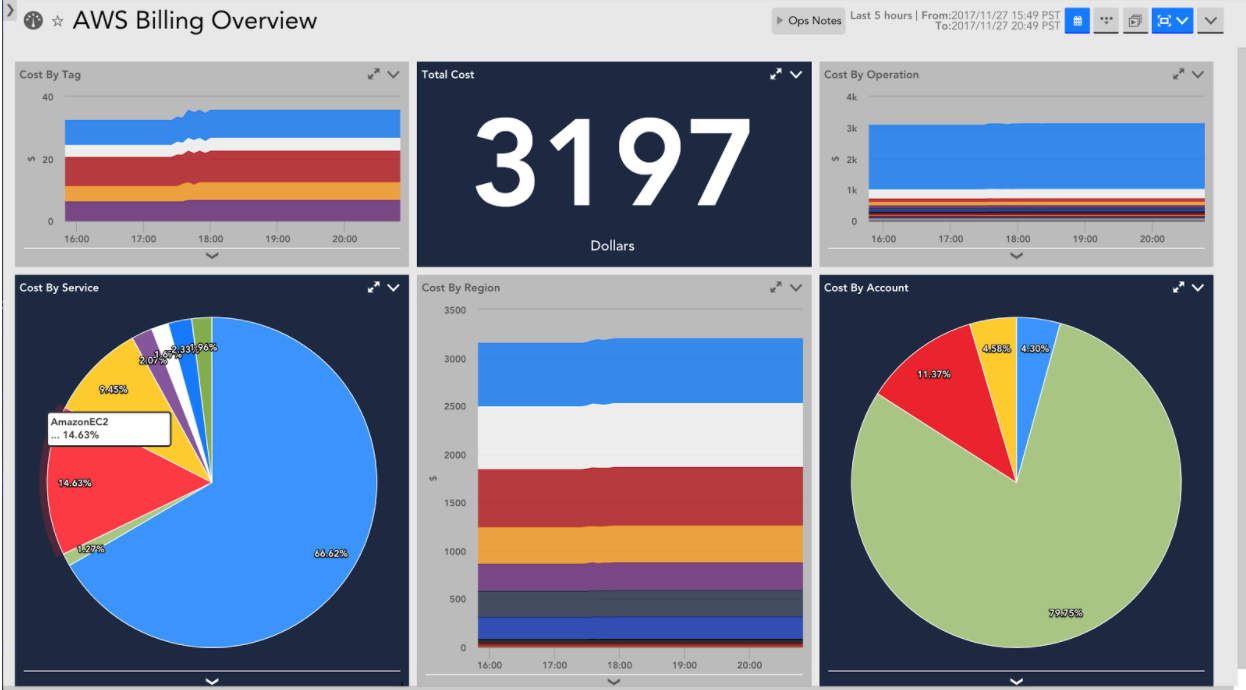
Want to see this dashboard in your own account? Import this JSON template. From reserved instance usage to the number of healthy hosts behind your Elastic Load Balancer to the trend of your monthly bill by account, LogicMonitor allows you to see it all. At AWS re:Invent this week?
LogicMonitor’s new AWS Billing Monitoring is now live in all accounts! Customers can learn more about how to get started here. New to LogicMonitor? Sign up for a free trial!

