
How the Security Patch Might Affect Cloud Users
When a critical security flaw affecting hardware is identified — such as the recently publicized chip vulnerabilities (Meltdown, Spectre) — your cloud provider takes steps to implement the necessary patch(es) to protect its infrastructure.
Updates performed by your cloud provider may require scheduled reboots for your cloud resources. For example, the security patch for Intel processors requires a machine reboot since the patch includes an update to the hypervisor kernel.
Depending on what your cloud resources support, a reboot from your cloud provider may or may not require you to take action. A reboot for an Amazon Web Services (AWS) EC2 instance running a production application could have a bigger negative impact on your business operations than a reboot for an instance used as a development playground.
How LogicMonitor Helps
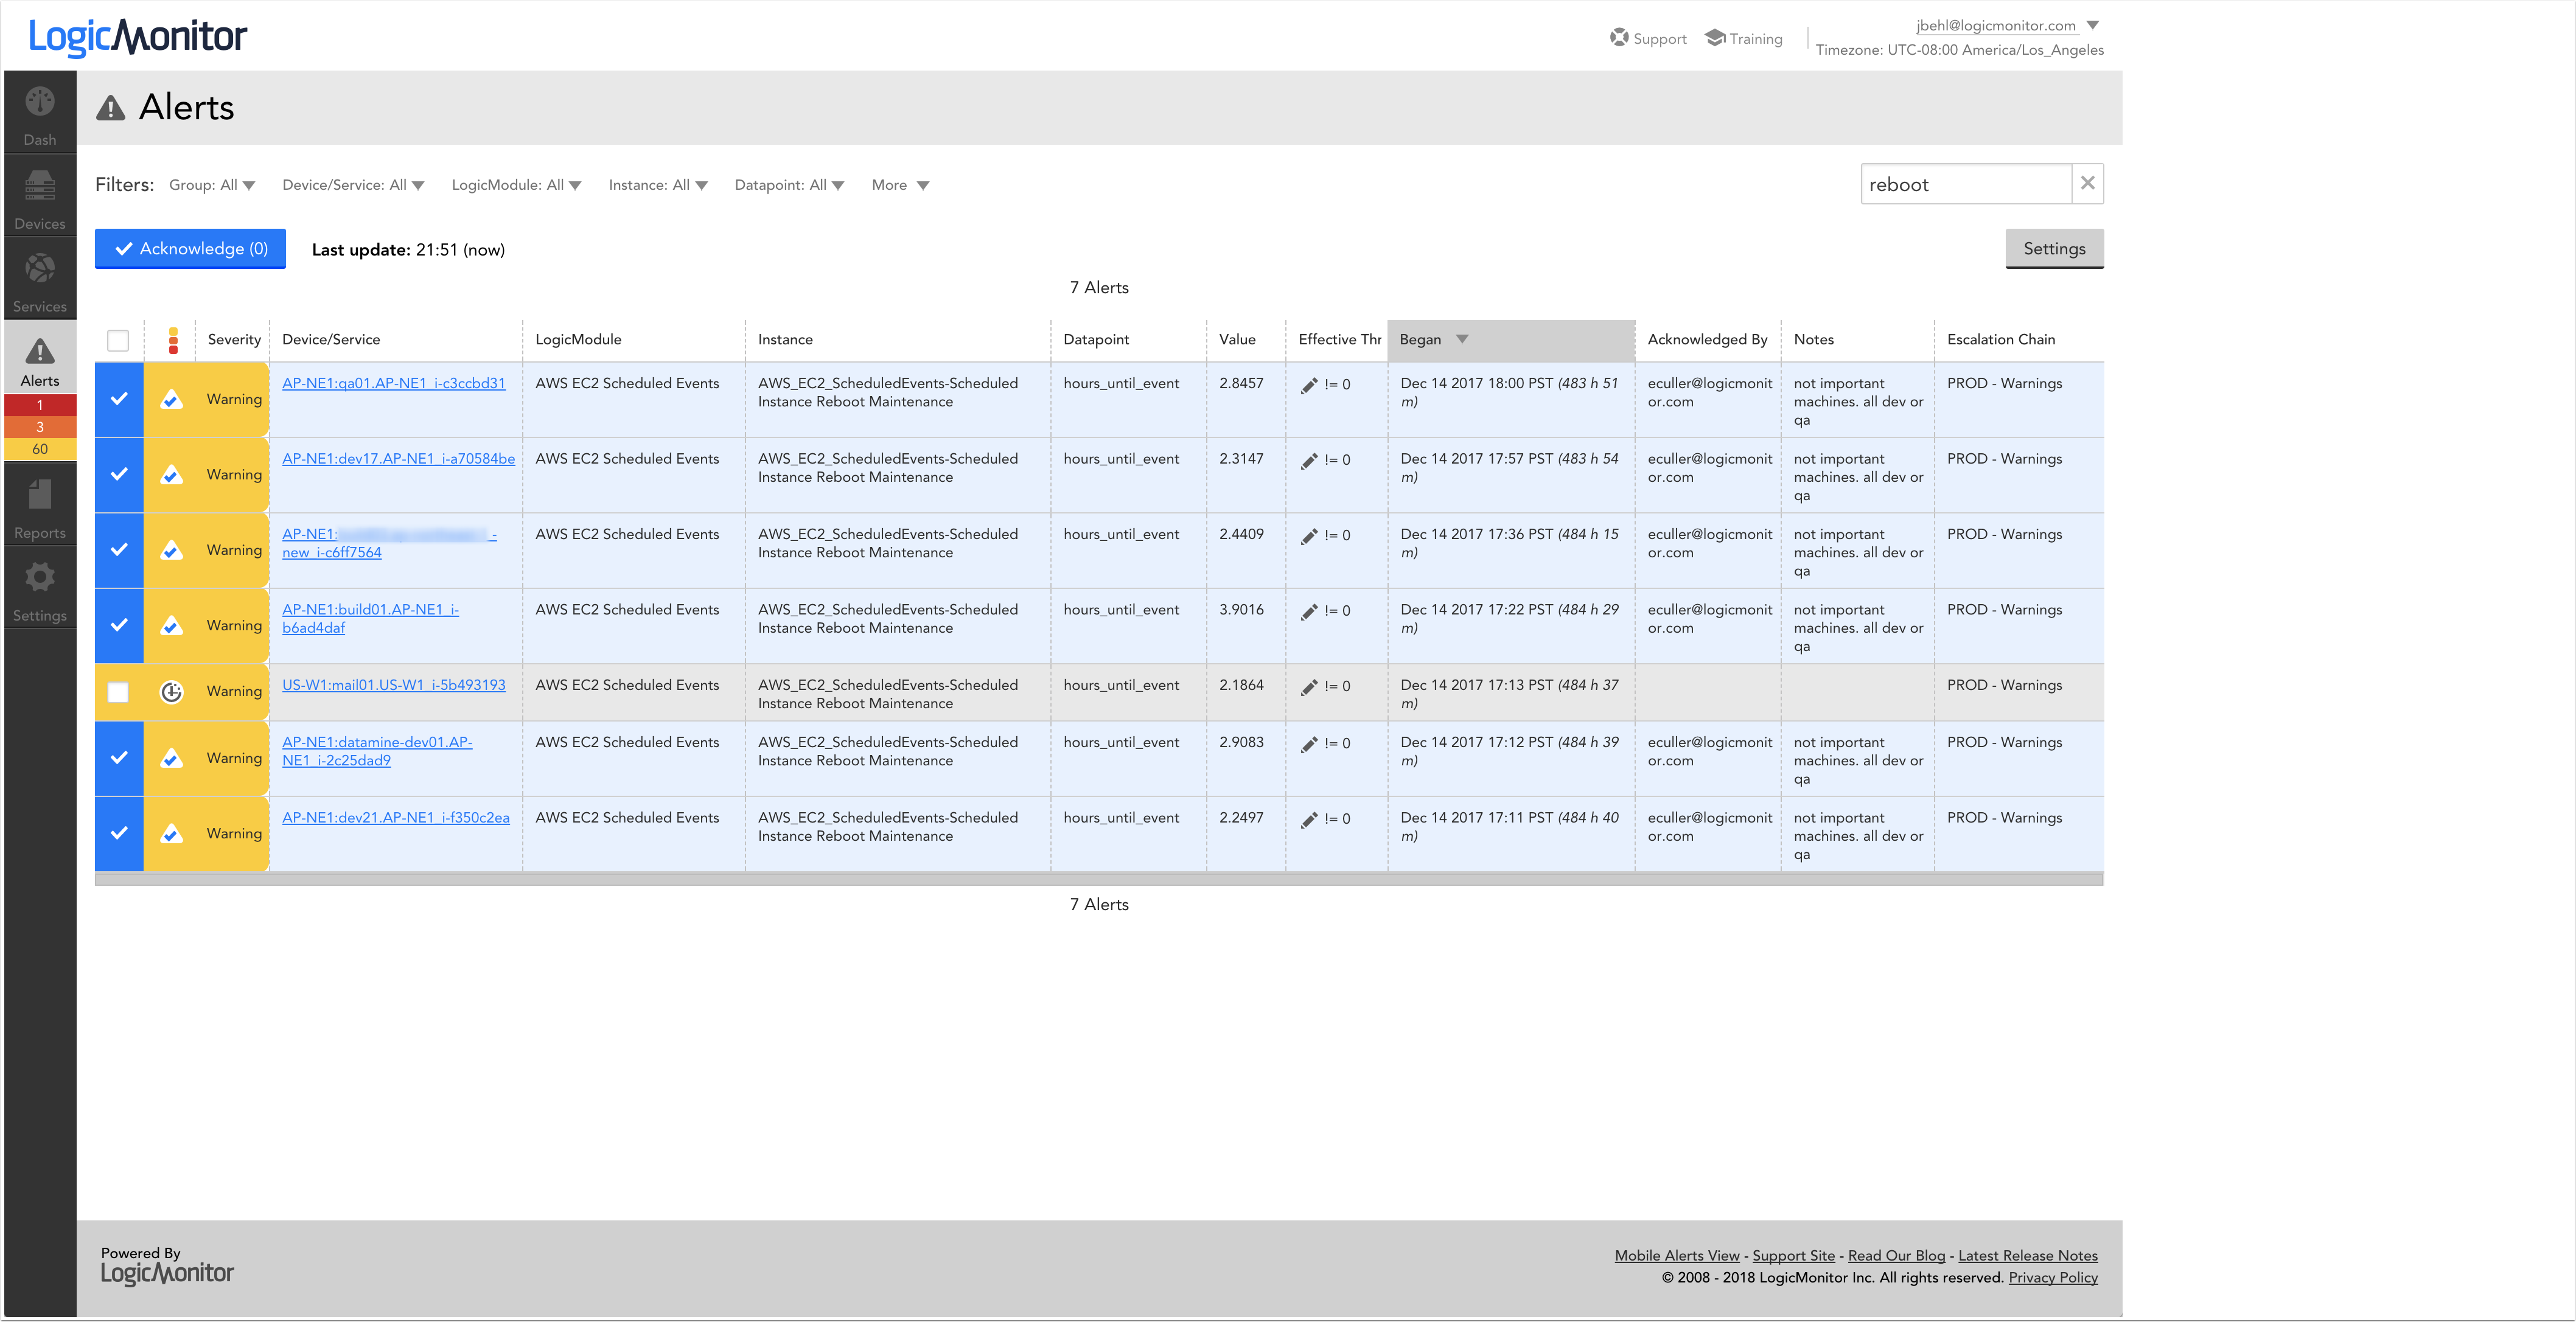
Using LM Cloud, you receive Amazon Web Services (AWS) service alerts ahead of such scheduled events and view them in the context of your monitored infrastructure.
For each event, you’ll see the associated EC2 instance, the type of event scheduled (reboot, retirement, etc.), and the hours until the event is scheduled to occur. Here’s a look at a few of the reboots scheduled for LogicMonitor’s instances:
Intelligent Routing of Alerts
AWS uses email (yes, email) to notify users of upcoming scheduled events, but the effectiveness of email as an alerting tool depends on who receives it and whether or not the recipient recognizes its importance and the instance(s) that could be affected.
With LogicMonitor, the determination of where alerts are sent can be systematically defined by you. Alert routing and messaging can depend on the EC2 instance and the type or status of the event.
For example, you could choose to have alerts for scheduled reboots of critical production instances routed via text to your on-call engineer, and send alerts for scheduled reboots of less mission-critical development instances to a Slack room.
You can even configure a report of unacknowledged alerts (i.e. alerts that haven’t been responded to) to be delivered periodically to the head of your operations team’s inbox.
Measuring Performance Changes
After the event occurs, we can measure any resulting performance changes with monitored data in LogicMonitor. Here’s a look at the CPU for one of our EC2 instances before and after the reboot event related to implementation of the security patch for the chip flaw (the event occurred on Jan. 4th):
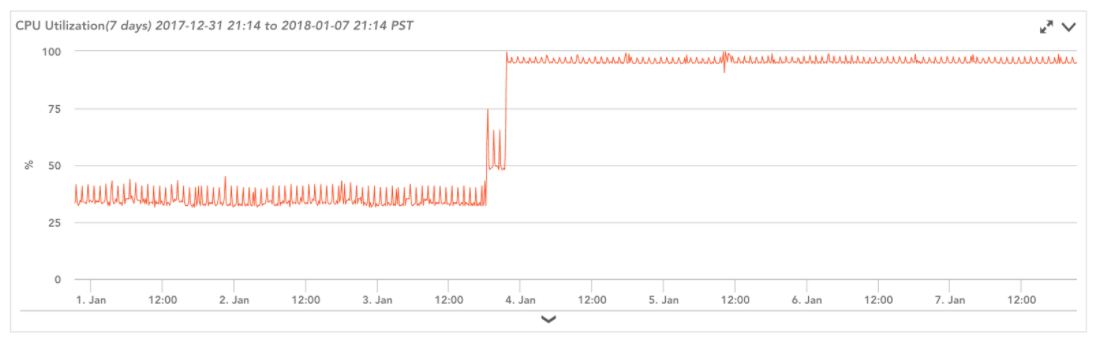
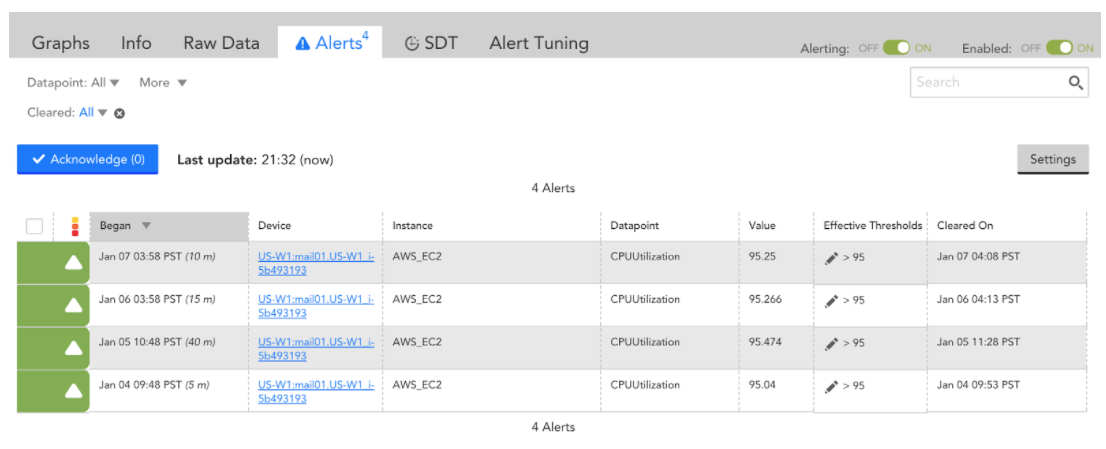
As you can see, the patch resulted in a significant increase in CPU utilization (and this increase wasn’t specific to us). Even if you aren’t actively watching the instance’s performance after the event (e.g. on a NOC wall), alerts are automatically triggered for such an increase in CPU utilization thanks to LogicMonitor’s out-of-the-box alert thresholds:
Next Steps
Based on the CPU utilization data, we know we need to resize the instance to allow headroom for growth. Using LogicMonitor’s LM Cloud to monitor cloud resources means you also can avoid missing scheduled events and address any performance impacts they may cause before problems occur.
LogicMonitor’s LM Cloud solution monitors key resource performance metrics, cloud provider availability, and spend data for your cloud environment so you can navigate the cloud with confidence. If you aren’t already using LogicMonitor, sign up for a free trial today.

