One of the great things about being a customer of a SaaS delivered monitoring service like LogicMonitor is that they can get best practices in monitoring of all sorts of technologies without having to have an expert in that technology on staff.
A recent example when LogicMonitor updated some of the CPU datapoints used for VMware monitoring.
One update automatically pushed out to our customers was to change the API object used to measure ESXi host CPU loads from cpu.usage.average to cpu.utilization.average. Now, these two counters sound like they are very similar – and in most cases they are. But cpu.utilization will provide a more accurate view of the CPU load of the host when there is power management technology that may be increasing/decreasing the frequency the CPUs are running at in response to load. It can also present a more accurate view when hyperthreading is present. Cpu.usage is relative to nominal frequency of the CPU’s – not the amount of time the CPU was busy, which is generally more relevant. (As an example, cpu.used could report 60% CPU utilization, while cpu.utilization could report 100%, if the CPU’s are throttled down due to a heat issue.)
So why did LogicMonitor initially use the cpu.usage metric? Simply because in vSphere version 4, that was the only counter that existed. The cpu.utilization counter was only added in later releases.
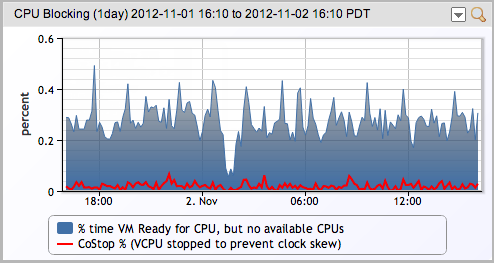
Another VMware specific metric we recently added to our monitoring is cpu.costop monitoring. This is the percentage of time a vCPU in an SMP virtual machine is stopped from executing, so that another vCPU in the same virtual machine could be run to catch-up. Operating systems don’t like it when the skew between the two virtual processors grows too large. If the clocks between the CPU’s get too large, VMware will stop the faster CPU so that the slower CPU will catch up. A CPU may skew behind if it doesn’t have enough work to do, so no tasks are scheduled on it. So in this case, the CPU’s that were doing work are prevented from doing work, so that the idle CPUs can catch up – or in other words, over-provisioning a virtual machine with excess CPU’s can be detrimental.


This is another metric that was not available in the earlier incarnations of VMware, but is now, so is now monitored and alerted on by default by LogicMonitor.
Unlike premise based monitoring systems, SaaS based monitoring can always be updated to reflect current best practices. So you get the best monitoring available, without having to dedicate your best people to updating it.
