
Amazon FSx is a fast, highly available cloud file system service. Compared to traditional file systems, AWS FSx offers improved performance along with simplified management and security. The use of this service removes the headaches of provisioning hardware and maintaining backups, and combines the familiarity of your preferred filesystems with the reliability of AWS. FSx offers two file systems to use, one for designed for Windows-based applications and another optimized for intensive compute-heavy workloads.
For disk access to a database, mail server, file server, etc, it is important to track the input/output operation performance. This is helpful when determining how a filesystem is performing, troubleshooting disk-related performance problems, or establishing baseline performance metrics for the underlying filesystem.
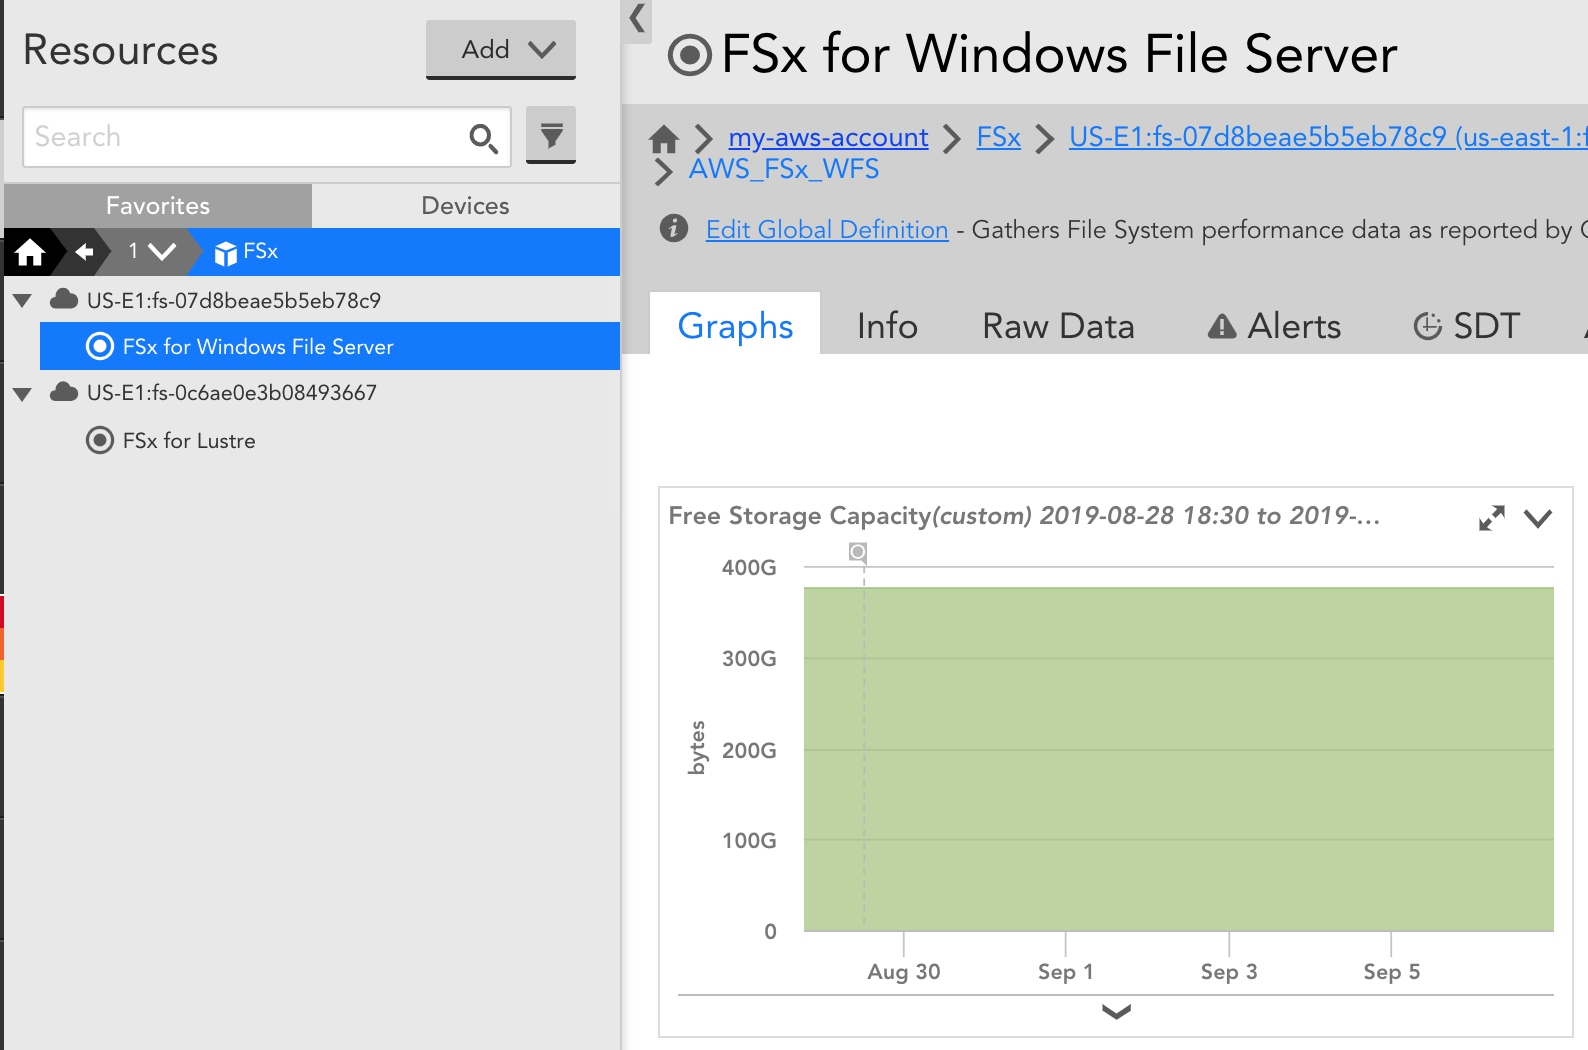
In v125 we expanded our monitoring coverage to include support for AWS FSx, and provide two out of box DataSources to collect and alert on metrics. After adding your AWS environment and enabling the new services, import our newest DataSources to begin monitoring. Regardless of whether you’re using Amazon FSx for Windows File Server or Amazon FSx for Lustre, LogicMonitor will automatically discover your filesystems and begin collecting at regular intervals.
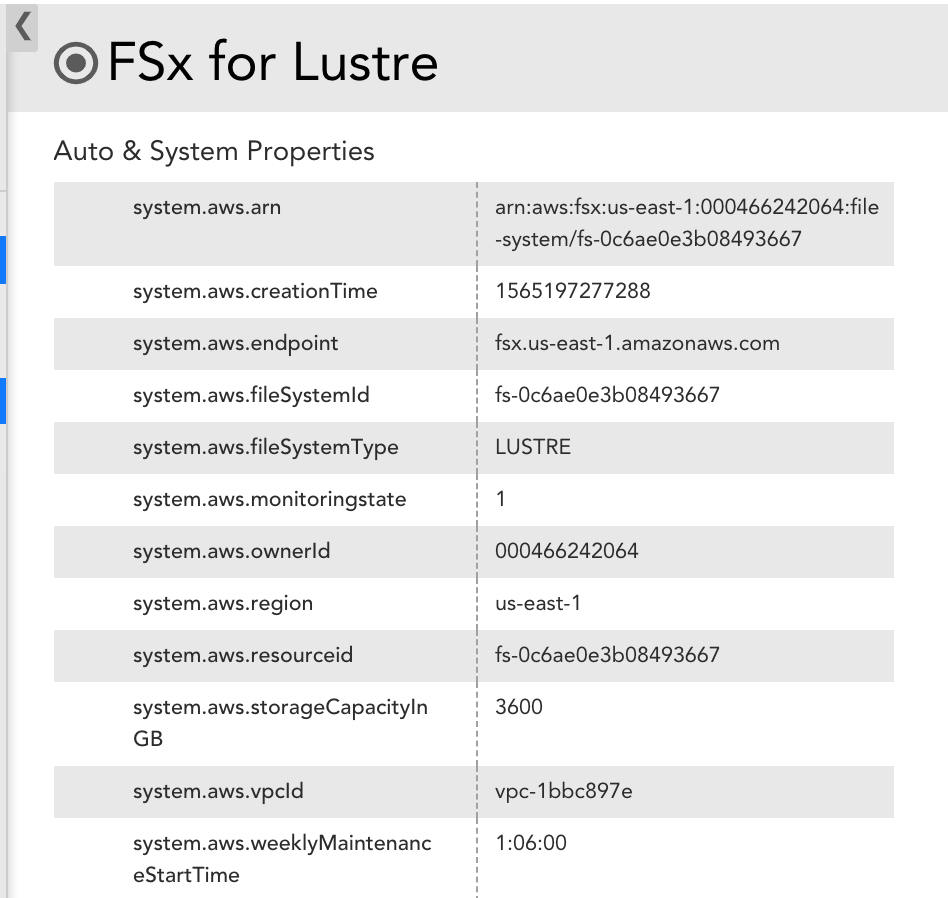
Autoproperties are populated for FSx instances, including file system type, region, and storage capacity.
LogicMonitor polls directly from AWS using the Cloudwatch API, and begins populating available datapoints such as the number of disk read/write operations, the amount of read/write bytes for the filesystem, and storage capacity. Default alert thresholds provide advanced notification when potential issues are detected. Here are a few datapoints we recommend tracking:
- FreeStorageCapacity: Reported in bytes, this measurement monitors the amount of available storage capacity. Because a full disk may cause service interruptions or cause errors in your applications, we include a default threshold to alert this metric.
- IOPS: The number of input and output operations for a file system within a period. A larger value usually means the filesystem is capable of handling more operations. Per Amazon, IOPS is calculated as Total IOPS = SUM(DataReadOperations + DataWriteOperations + MetadataOperations)/Period (in seconds), which LogicMonitor reflects in its preconfigured DataSource graphs.
- Throughput: Out-of-box, our graphs track the amount of data written and read for your filesystems. Monitoring data transfer rate is a good indicator of performance and can be used to help correlate other performance-limiting factors, such as available bandwidth or the number of IOPS.
This new release makes it easy to comprehensively monitor how actively your workloads are using Amazon FSx and enables you to correlate filesystem performance alongside other key infrastructure components, all from a single pane of glass. To explore the supported cloud and on-prem monitoring capabilities of LogicMonitor, sign up for a free trial today!

