
Most people think of Datasources as the bread and butter of LogicMonitor’s monitoring capabilities. Datasources are the most commonly used LogicModule because they are appropriate for monitoring numerical data; they provide a trend of the data over time (which can provide invaluable context when troubleshooting) and are compatible with most monitoring protocols. That being said, LogicMonitor’s Eventsource monitoring shouldn’t be undervalued.
Eventsources can be used to alert on asynchronous messages received or gathered by your collector, and can report textual data. Datasources, in contrast, cause the collector to poll data to determine when an alert should be triggered, and are limited to numerical data. Typically, Eventsource monitoring is used for Windows Event Log and Syslog monitoring. However, we recently introduced a new script Eventsource collection method that makes it possible to monitor almost any event. We decided to use it to monitor Amazon Web Services (AWS) Service Statuses.
LogicMonitor’s AWS Monitoring utilizes the CloudWatch API to gather CloudWatch metrics and the AWS SDK to collect metrics that aren’t reported by CloudWatch. Both mechanisms rely on the AWS Service functioning properly. If AWS has an issue and your EC2 instances aren’t available, we aren’t going to be able to monitor them. So how do you know if a reported issue is coming from within your infrastructure or AWS’s? Cue the aforementioned Eventsource.
We wrote a script Eventsource that parses the AWS Status RSS Feed and triggers a LogicMonitor alert when AWS reports an issue. Each Eventsource alert includes the time the post was made to the RSS feed, the message posted and the link to the post. With this Eventsource, we can quickly reference whether or not AWS is having issues when our monitored AWS resources are in alert.
For example, during AWS’s recent service disruption in the Sydney Region, we saw servers in one Sydney availability zone become unavailable. The following graph shows the CPU graph lines for two Sydney EC2 servers disappearing, and the other server CPU increasing to pick up the extra load:
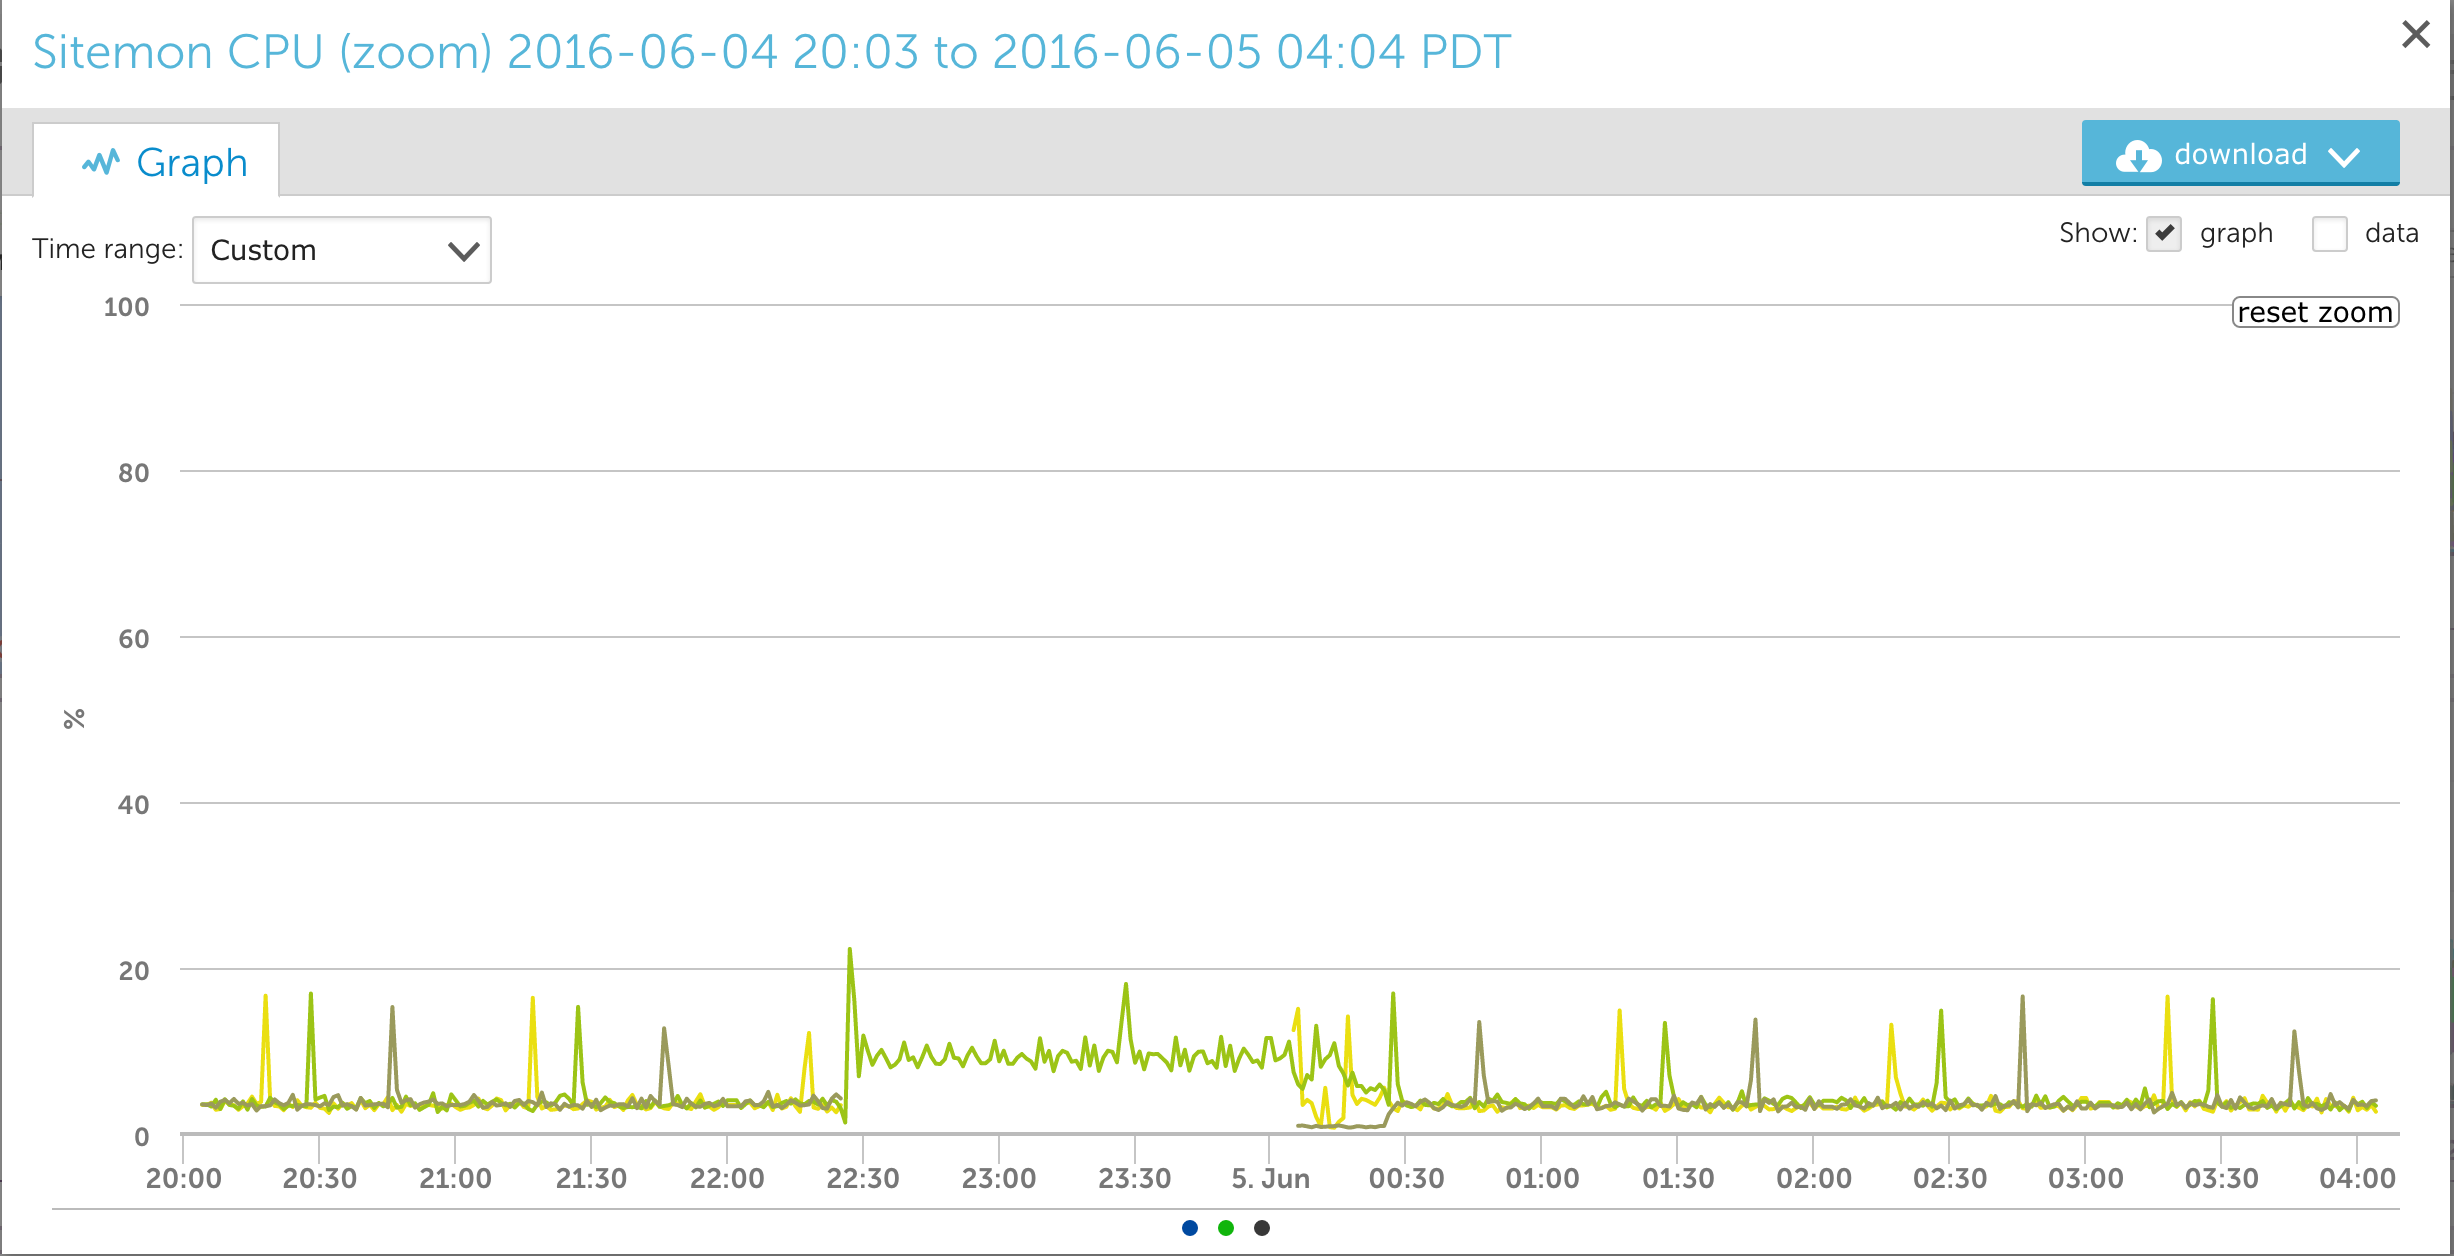
Without additional context, it was easy to assume the issue was in our environment. However, during the same time period we saw an AWS Service Health alert for the region:
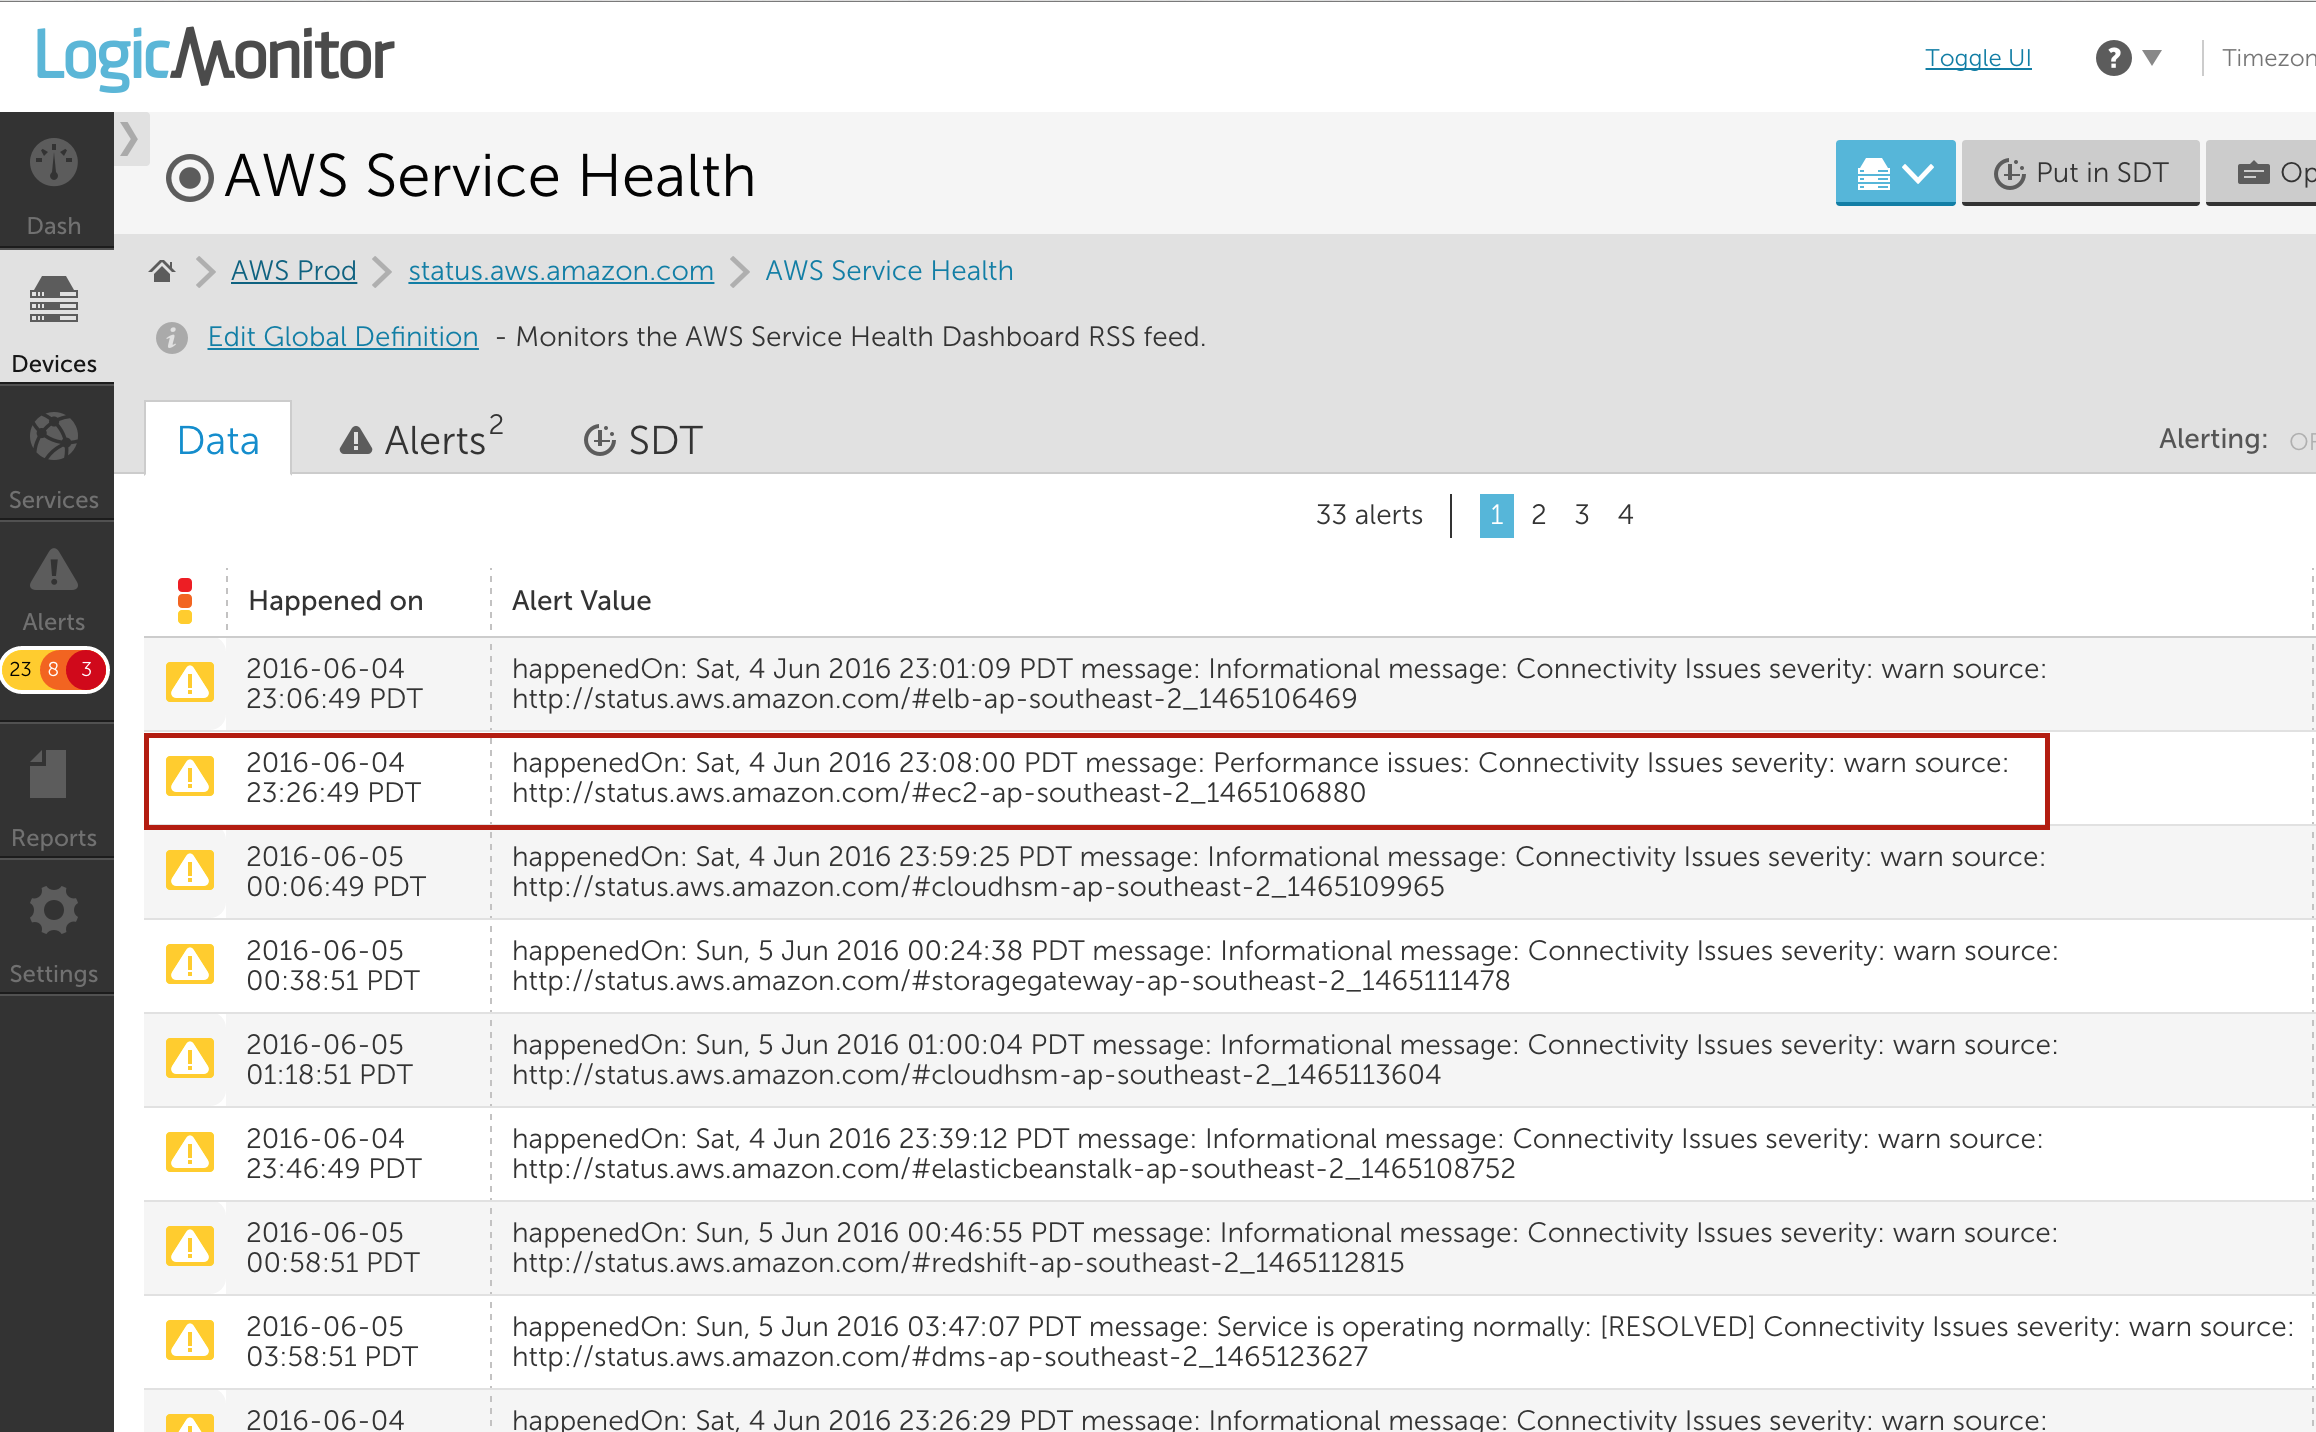
The plethora of connectivity issues reported for AWS’s AP-Southeast-2 region hinted that the issue was actually with AWS itself. Sure enough, further investigation showed us that AWS was experiencing a service disruption. We probably could have reached this conclusion without the AWS Service Health alert, but it certainly enabled us to identify the issue more quickly.
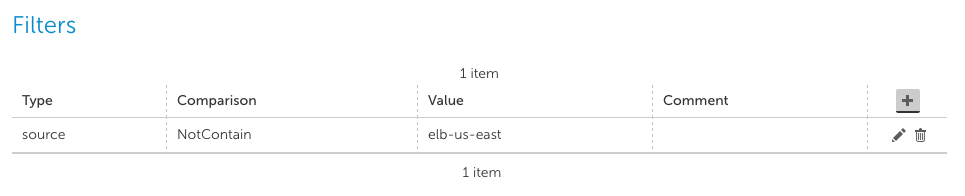
Let’s say that you aren’t interested in receiving notifications for ALL of the AWS Services or Regions. Simply add filters to the Eventsource to filter out the alerts for the services and regions you don’t care about:
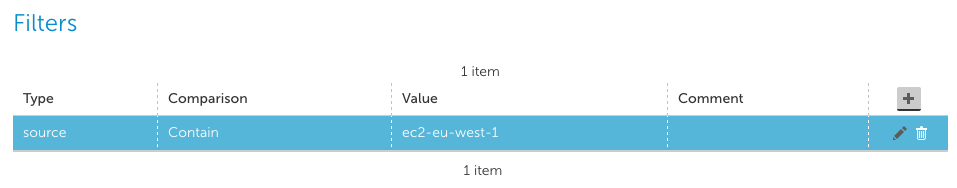
Alternatively, if you only care about a few services and/or regions, you can add filters to filter out everything except for the alerts you want:
We could have used a Datasource to monitor this AWS status information, but because the monitored data would need to be numerical, we would not have the ability to provide a contextual message with each non-healthy status. Additionally, we don’t really care when AWS is functioning properly. Eventsource monitoring only alerts us when something isn’t right, and we really only want to know when AWS isn’t working properly.
The AWS Service Health Eventsource is available now in our core repository. After importing the Eventsource (Settings | Eventsources | Add | From LogicMonitor Repository), you’ll need to edit the Applies To field such that the Eventsource applies to a device in your account. To get the most complete picture possible, we recommend adding status.aws.amazon.com as a monitored device, and applying the Eventsource to that device. Alternatively, the Eventsource can be applied to any other device in your environment.

