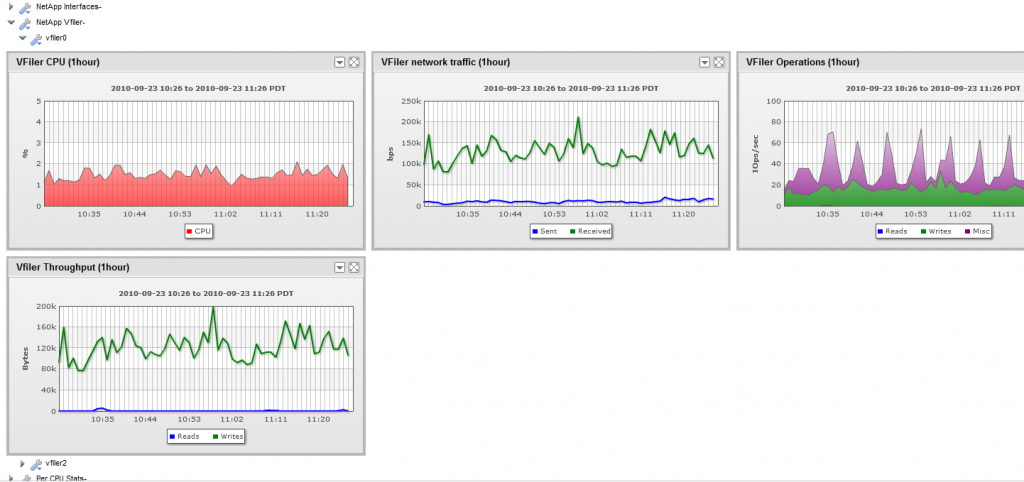
One of the many great things about working at LogicMonitor is that we get to use our product to solve business needs. Personally, I like having someone asks us “I need to monitor X”, and be able to deliver custom monitors for X, within a few hours.
One example this week was a customer wanting to monitor NetApp’s Multistore capabilities. I’ve worked with NetApp hardware for over 10 years, but had never used multistore. (NetApp’s Multistore let’s you easily create separate and completely private logical partitions in filer network and storage resources. It’s like VMware for NetApps.) Multistore is getting more attention recently as a good way to bring NetApp’s strengths to cloud provisioning.
Despite LogicMonitor’s excellent NetApp monitoring we didn’t have anything to monitor vfilers created when Multistore is used. However, we fired up some vfilers in our lab, and using LogicMonitor’s debugging tools to query the NetApp API, we found the relevant metrics, created a datasource with Active Discovery of all vfilers, graphs and alerts, and voila! Within an hour all our current and future customers just had their NetApp monitoring capabilities extended, automatically! (Another reason to love SaaS!)
Even cooler, using LogicMonitor’s role based access control, you can give users the same visibility in LogicMonitor as they have on their vfiler. So an administrator delegated control of only a single vfiler can be set in LogicMonitor to just see his own vfiler and its volumes and their usage and performance, while others can see all the vfilers, and latency of all volumes on the phsyical system.
Being able to deliver things that exceed customer’s expectations, about things that you didn’t know existed, in less than an hour – fun day at work!

