

To prevent failure and minimize downtime, it’s important to make sure your infrastructure and applications are observable. But, just getting to the point of observability isn’t enough. You need to be able to use the data that comes with observability — ideally in a way that helps your team troubleshoot more quickly and minimize or prevent downtime.
When it comes to metrics, one trap teams can fall into when making systems observable is monitoring EVERYTHING instead of just what’s important. Monitoring everything available is actually detrimental when it comes to making use of the data, because now there’s simply too much information to be useful, and most of it is just noise. LogicMonitor already solves this problem with DataSources that define which metrics are important to monitor and alert on for a typical production environment, and more importantly, omit what’s not important. This provides an out-of-the-box view that is both useful and actionable.
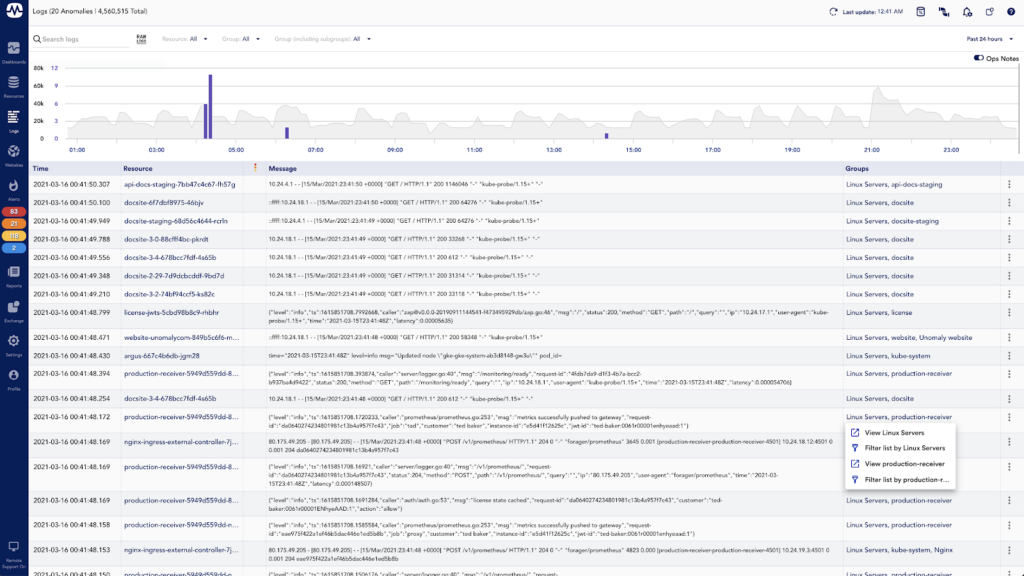
When it comes to logs, the issue with making the data useful is that it is typically unstructured and almost always high volume. LogicMonitor solves this problem with LM Logs, which uses anomaly detection to automatically surface potentially meaningful log events and correlates them with metrics for faster troubleshooting. Ultimately, LM Logs makes log data useful by surfacing the right log events at the right time, and placing them in the right context.
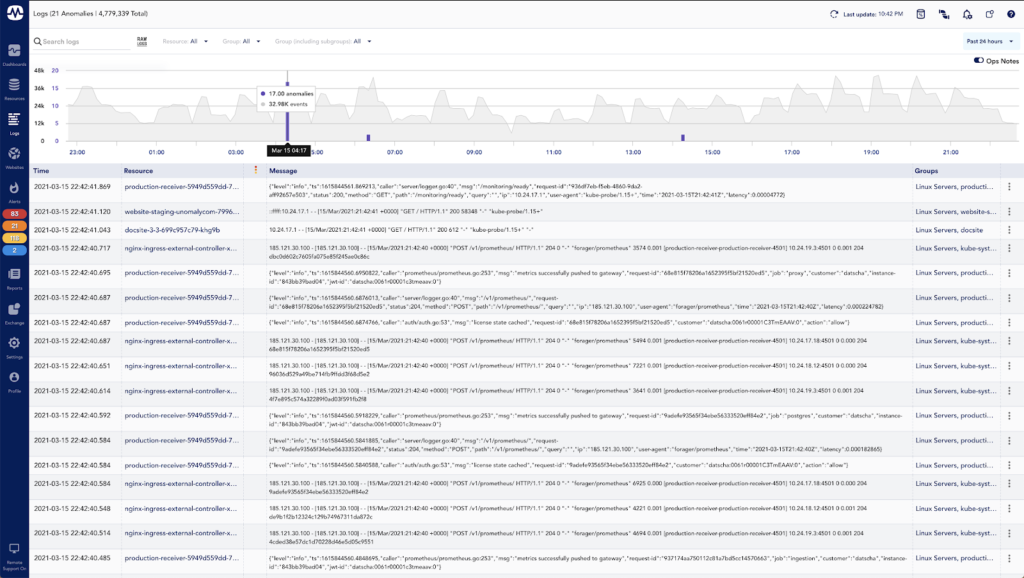
In the screenshot above you can see that the LM Logs anomaly detection has narrowed down almost 5 million logs from the past 24 hours to only 21 anomalous events — a much smaller volume data set to start reviewing.
Since we launched LM Logs in November of 2020, we’ve been hard at work on improvements. This quarter alone, we have a number of improvements that make LM Logs even better, including:
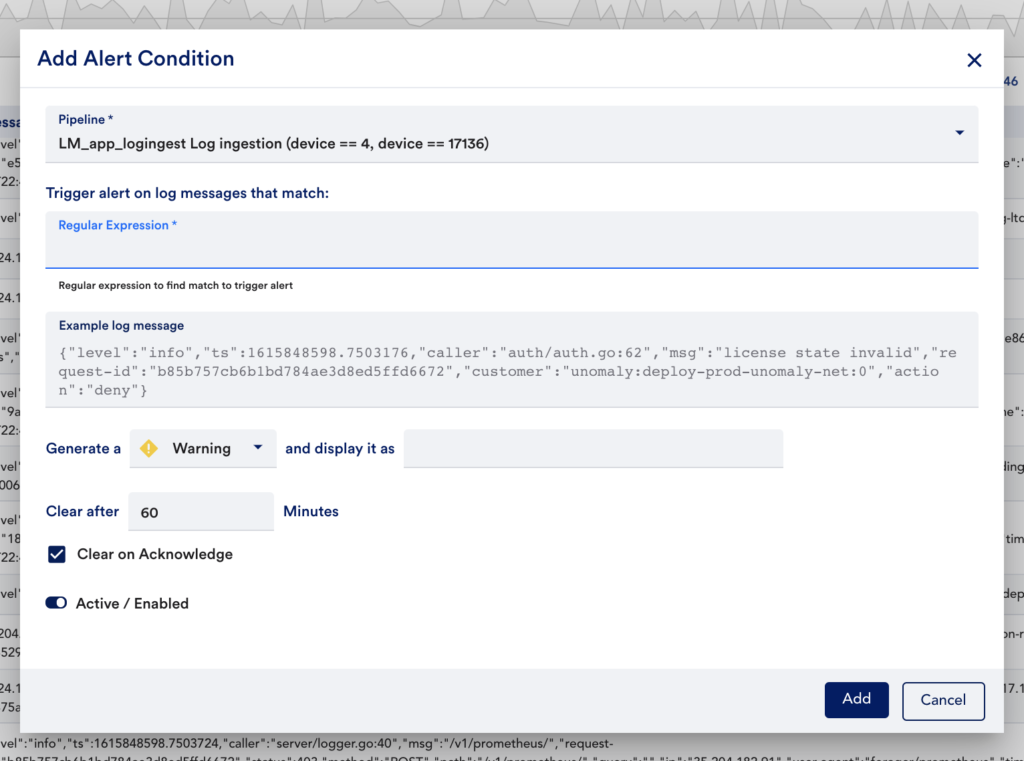
Log Alerting
With log alerting, you can now define regex conditions that, when matched, will trigger LogicMonitor alerts (which can result in text, voice, SMS, or email notifications). This is a great way to make sure you are being as proactive as possible and can help you make log data even more actionable. You may choose to create alert expressions from meaningful anomalies, more broadly for things like exceptions, errors, or failures, or for things you know to be leading indicators of issues. To get started, simply define the regex expressions you want to trigger alerts:
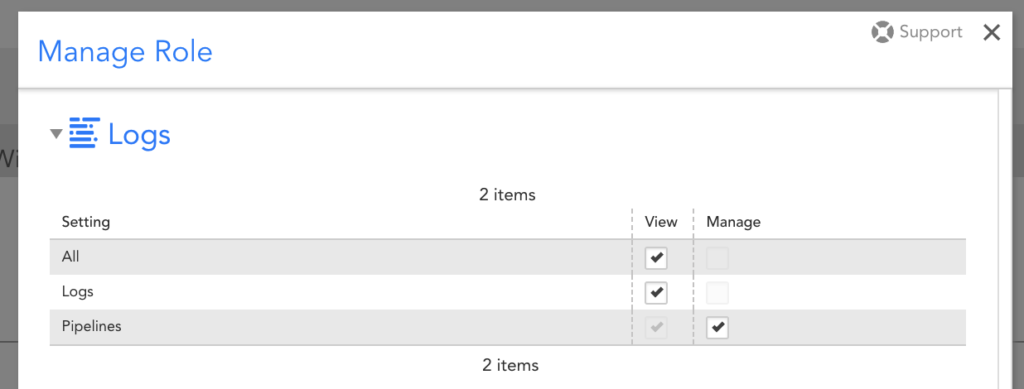
RBAC
With role-based access control (RBAC), you can now granularly control which users can see log data and what log data they should be able to see. There are three new role settings to support this:
- View log data
- View pipelines (which contain alert conditions)
- Manage pipelines
In addition to the view permissions for log data, a user must have view permissions for the monitored resource the log data is associated with (e.g. to view log data for a production Kubernetes cluster, the user must have view access to log data AND view access to the Kubernetes cluster). As with the RBAC that already exists throughout the rest of LM, you may find this new LM Logs-specific RBAC useful for controlling which log data different teams get access to, or even to support a multi-tenant monitoring environment.
Group Filtering
Finally, group filtering is available to limit displayed logs based on the group(s) of the associated resource. For example, you may apply a filter for a group that represents a Kubernetes Cluster to see logs for all of the resources in the cluster. Or, you may filter on a group that represents an AWS account to see logs for all resources in the account. This group filtering option is consistent with the new alerts page, and far more efficient than using the resource filter when you know you want to see logs for multiple resources. Additionally, it comes with a new column in the logs table that actually displays the groups, and gives a quick option for filtering:
With these improvements, LM Logs is better than ever and a great way for you to make your log data more useful and actionable. Stop wasting time manually searching through large volumes of logs — check out LM Logs today as a quick way to spend less time troubleshooting, and more time on what matters most!

