Some people (sometimes even us) have been known to refer to LogicMonitor as a “sysadmin in a box”. This is not quite true – and not just because we’re a SaaS service, so there is no box. But while LogicMonitor can certainly let you put off hiring a sysadmin, or let your sysadmin manage vastly more systems than other monitoring systems, by automating the monitoring and providing pre-defined best practices alerts – someone still has to interpret those alerts, and figure out the best way to deal with them.
A case in point:
A customer got the following alert about one of their MySQL databases:
Query_Cache_thrashing
The  percent of queries answered from the query cache on server1 is only 7.69%,  and
there are more than 5 prunes per second of the query cache.
This state started at 2011-05-09 14:39:47 PDT and has been going on for 0h 12m.
This  indicates that either the query cache is significantly undersized, or  else your
application does not benefit from the query cache, and it  should be disabled.
Query_cache_size should be set to around 1/16 of memory allocated for the DB.
If it is enabled correctly and has a low hit rate, it may be detrimental to performance,
and should be disabled.
The customer wanted to know what to do – the alert says either make the cache much bigger, or turn it off – what sort of advice is that?. LogicMonitor considers various metrics when assessing alerts, so it can tell you (in some situations) if the query cache should be increased, or disabled – but when thrashing, as in this case, it needs a human to assess it.
So if I was a human, I’d assess this situation thus:
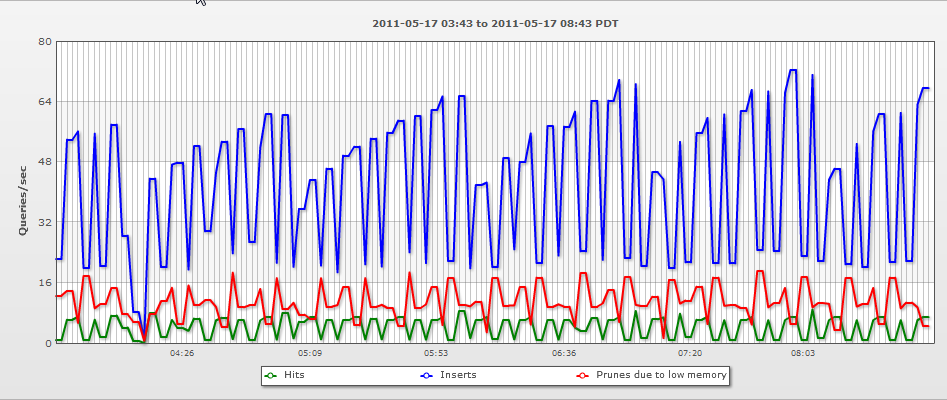
Looking at the query cache performance graph, it’s clear that we’re not getting a lot out of it – there’s a lot more inserts and prunes (to free memory) than there are hits:

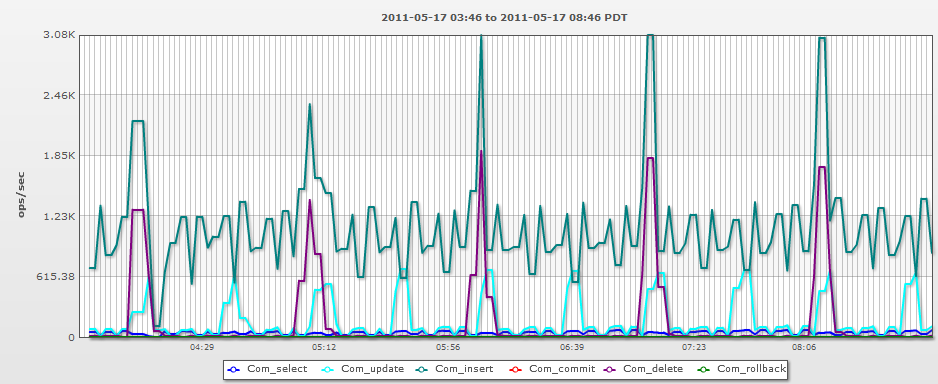
So, what sort of operations is this database doing? The query cache is only effective for … queries (selects). But this particular database is not doing a lot of them. As you can see below, it’s doing thousand of updates and inserts per second, and only very few selects….

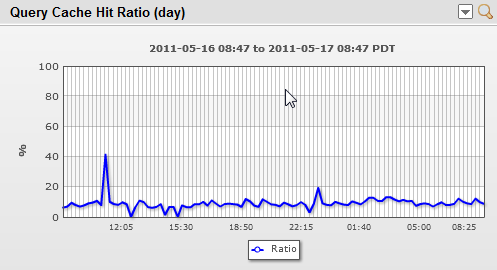
Because there are so many updates, the cache is often not effective for the queries:

So, given that:
- there are lots of updates and inserts continually invalidating the cache
- there aren’t a lot of queries (relative to other operations) on the db
- and hence the cache hit rate is low
I’d test disabling the query cache. This will give more memory to the system to use for other things, and allow it to stop spending time updating the query cache each time it does those thousands of updates and inserts per second.
Of course, it’s possible that the small number of queries that are being successfully answered by the query cache are very intensive ones – so I’d watch the graphs for table scans and full joins to see if they increase significantly.
And this is the other point of this blog entry – if you are not trending all sorts of data, you won’t be able to determine if your changes are beneficial or not. And you’d never know if disabling the query cache was beneficial, reducing CPU load and improving performance, or not. It’s likely that it won’t make a big difference either way in this case – but if it stops some alerts; and improves resource utilization – that effect just gets bigger as the database scales.
So while LogicMonitor is actively researching better heuristics in all sorts of areas for our alerting and root cause analysis, there are many cases where you will still need a human brain to determine the likely configuration changes to test, and then assess the results of the test.
So keep those DBA’s around. (But get them LogicMonitor so they can do their job more effectively.)
