
Since we rolled out our traffic flow enhancements recently, we’ve seen wide adoption – but also a surprising amount of support cases regarding Netflow/Jflow/etc. We’re going to look at some of the odd cases that have come in. (No, this article is not just a throwback to Public Enemy’s song.)
Now Netflow (or Jflow) are generally fairly simple protocols, even with their different versions. A router or switch looks at its traffic; counts up how many packets and bytes are in a flow (a conversation between a source IP and port, and a destination IP and port), and then sends that summary to a netflow receiver.
One case where things go amiss is in the timestamps.
Check out the following capture from a Wireshark examination of a Netflow packet from a Sonicwall firewall:
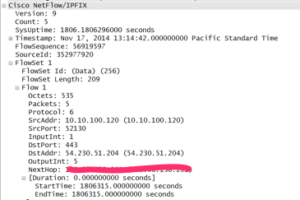
Now the way Netflow is supposed to work – the router sends the current time (in the Timestamp field: Nov 17th, in the above). It also sends its Uptime at the moment (1806 seconds.) Then for each flow, it sends the value of the uptime counter at the start and the end of the flow. So for this flow, the router is reporting the flow started when the router had an Uptime value of 1806315 seconds – even though the router has only been up 1806 seconds. So this flow started about 20 days in the future (and ended at the same time.) So LogicMonitor rejected the flow, and reported a time issue. This doesn’t help the user, however, as the firewall is configured correctly, and they cannot see their traffic data. To work around this kind of buggy flow originators, we’ll be adding in an option to ignore the device timestamps, and just treat all arriving flows as if they are from now.
Another interesting issue is when interfaces do not get identified. Now, Netflow (Jflow, etc) does not directly include a way to identify an interface name. Instead, it refers to interfaces by their SNMP interface table index. You can see in the packet capture above – the InputInt had a value of 1. So this was the interface with an index of 1 in the snmp ifTable, and we can use that to obtain the interface’s name (such as eth0).
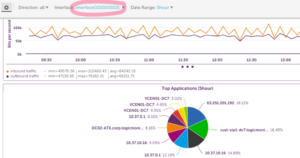
So how do we end up with interfaces that are displayed as unfriendly numbers, like the below:
Well, it turns out that some devices (the above is from a Palo Alto firewall) can report Netflow traffic from interfaces that they do not manage via SNMP. In the case of Palo Alto firewalls, the SNMP table only includes physical interfaces, while the traffic flow source can be logical interfaces (such as VLan interfaces or subinterfaces.) Thus the device is reporting an interface identifier for an interface that is not visible in the SNMP table – so there is no way to associate it with a ‘friendly’ name. (We’ll allow manual name definition for this case.) For details on how Palo Alto arrives at their Netflow identifiers for interfaces that do not exist in the interface table, see this document.
Another case we run into is the device contradicting itself with regard to flow sampling: both reporting a sampling rate (such as 1 in 20), but a sampling method of ‘off’ (meaning that no sampling has been enabled.) Thus far, it seems that devices that do this are lying about the sampling method, not the sampling rate. (They are in fact doing sampling.)
The good news is that most devices implement traffic flow exporting correctly – and getting this level of visibility into the traffic going through your devices can greatly help troubleshooting. But it is interesting so see how many ways there are of mis-implementing a specification. 🙂