
Some time ago, our fearless (fearsome?) leader wrote a fine blog about the Right Way to Monitor Linux Virtual Memory. It turns out he was right on the money (Steve’s a smart guy — who knew?). Although his blog focused on monitoring Linux Virtual memory, it turns out there’s some nuance in monitoring Physical memory as well.
Because you’re a Linux geek, you of course know that free is the tool you use to ask your kernel about how it’s using memory:
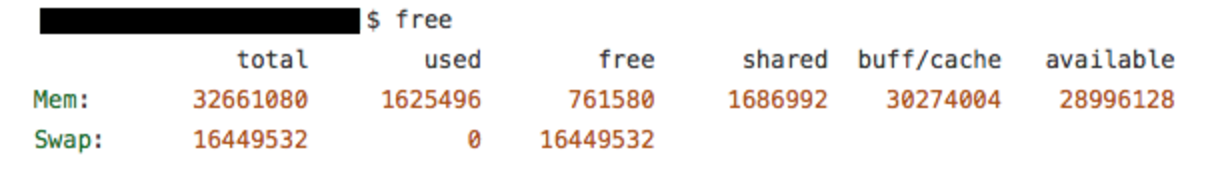
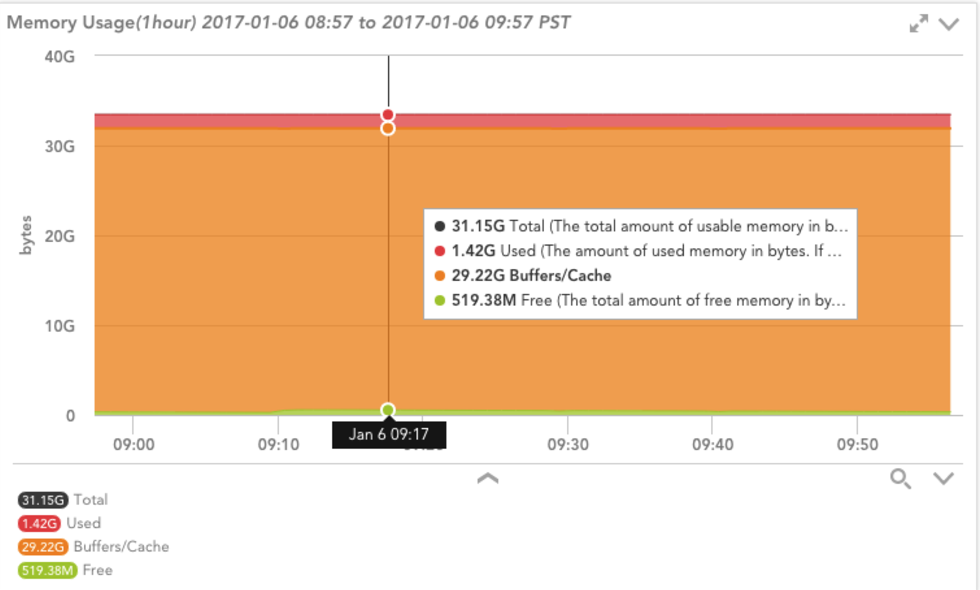
Or, better yet, you’ll just trust your monitoring system to do it for you. Here’s one of the visualizations provided by LogicMonitor’s NetSNMPMem DataSource applied to a Linux system: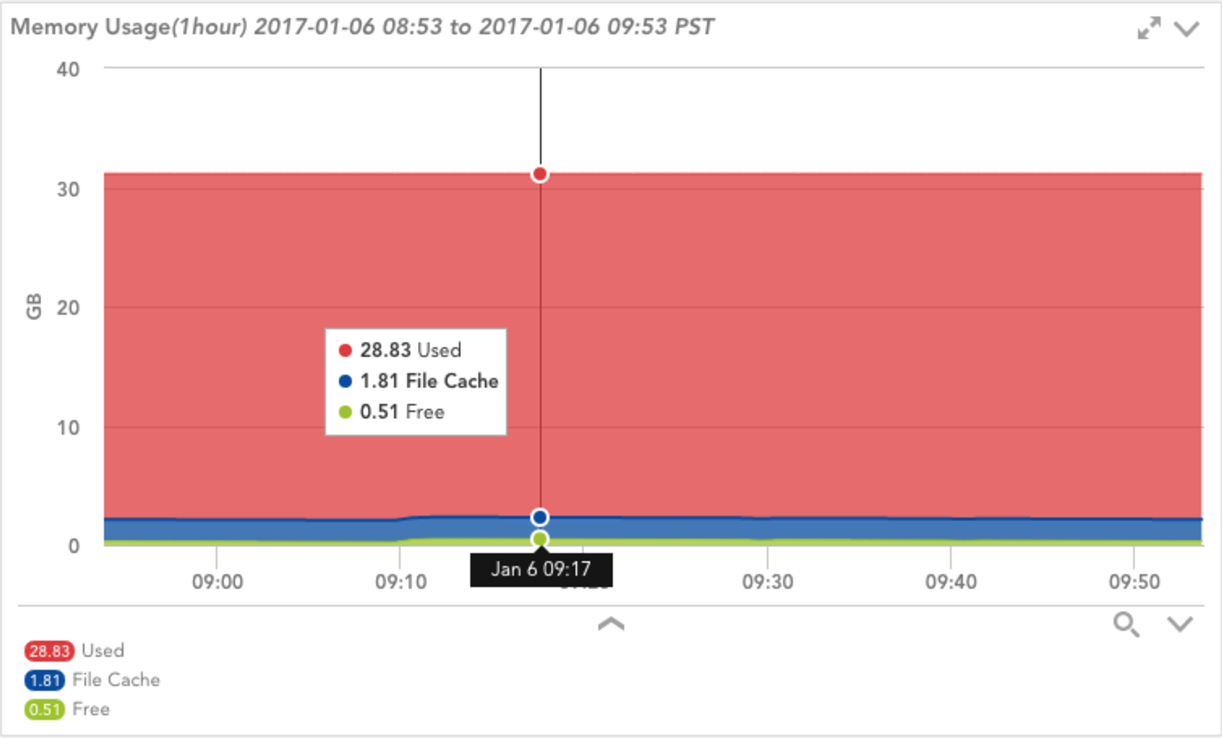
But wait! What does it mean when your monitoring system — which is most certainly polling Net-SNMP for memory info — disagrees with free. In this case, Net-SNMP says this system is using ~28 GB of memory, while free claims it’s only using ~1.5 GiB. A discrepancy of ~26.5 GiB is certainly worth further investigation.
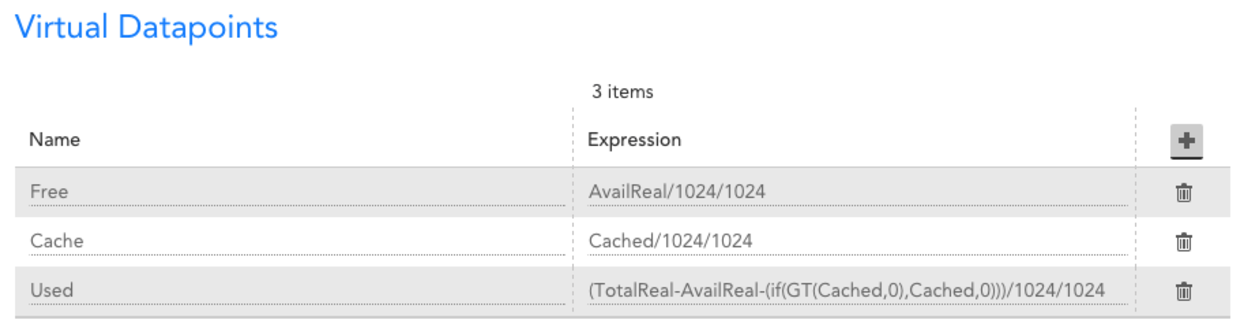
Let’s take a quick look at where the graph is getting its data, and how it is calculating “Used” space. As you can see in the screenshot below, the “Used” datapoint on the graph is calculated by subtracting “Free” and “File Cache” from “TotalReal” (The total amount of real/physical memory installed on this host). If you believe free is providing the correct info, we’d assume either “Free” or “File Cache” to be about 12 GiB larger.
So let’s see how free calculates “used” and see if that clears things up. Turns out free gets its information by parsing the /proc/meminfo file. This file provides much more detailed memory usage than Net-SNMP. Here’s a snippet from proc/sysinfo.c, the code free uses to parse /proc/meminfo:
mem_used = kb_main_total – kb_main_free – kb_main_cached – kb_main_buffers;
Apparently free is using a similar calculation, subtracting free space and cache space from the total amount of memory. However, buffer space is also being subtracted, which isn’t captured by NetSNMPMem or factored into the “Used” calculation. Normally, buffers won’t use a huge amount of space; the kernel documentation cites “20MiB or so”, so this probably isn’t the culprit. The free command above does show ~30 GiB under buff/cache but it doesn’t give a breakdown of buffers and cache. Let’s look at /proc/meminfo on the system in question:
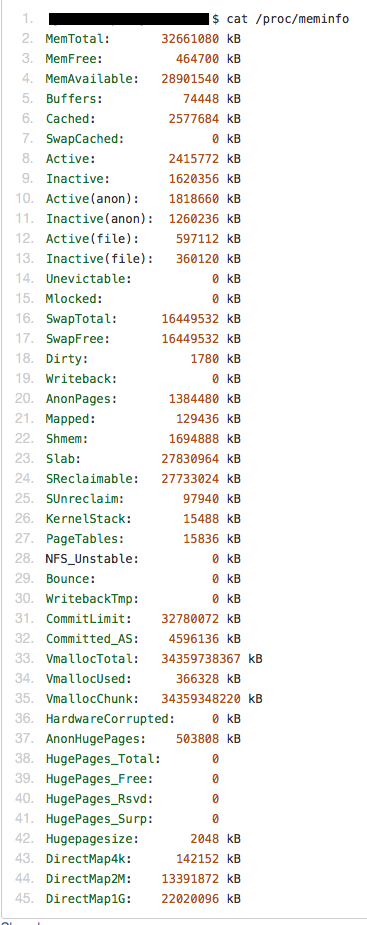
Buffers shows a paltry ~75 MiB of space used. Quite a bit more than the kernel docs specify, but nowhere near 12 GiB. Looking at Cached, we see about 2.5 GiB, which is what was reflected by Net-SNMP as shown in the graph above.
So what gives? Is free wrong? Shouldn’t Buffers and Cache added up to the ~30 GiB listed in the output of free? We’d better confirm what free means by “buff/cache”, so back to the source!
printf(” %11s”, scale_size(kb_main_buffers+kb_main_cached, flags, args));
Looks rather straightforward, buffers plus cached. We’ll have to go a bit deeper and verify how these values are getting created. The kb_main_buffers variable is straight from the Buffers line in /proc/meminfo, so let’s see what comprises kb_main_cached:
kb_main_cached = kb_page_cache + kb_slab_reclaimable;
That’s interesting, free’s cache metric is the sum of the page cache, and whatever kb_slab_reclaimable is. The kb_page_cache variable corresponds to the Cached” line in /proc/meminfo, so presumably the slab thing is the source of our discrepancy. Looking in /proc/meminfo again, there’s “Slab”, “SReclaimable”, and “SUnreclaim”. I’ll save you some Googling; Slab is the size of the in-kernel data structures cache. It caches things like inodes and dentries. SReclaimable is part of the slab that can be reclaimed, whereas SUnreclaim is the other part of the slab that (you guessed it) can’t be reclaimed.
Putting it altogether, let’s add Cached, SReclaimable, and Buffers from /proc/meminfo to get what free calls “buff/cache” (or kb_main_cached in the source):
2577684 + 27733024 + 74448 = 30385156
The output of free and /proc/meminfo were recorded a few minutes apart, but the value above looks like what we’re seeing from the free command above. We’re getting the data from the same place, so this is completely expected.
But, weren’t we originally concerned with “used” space? Let’s confirm based on the formula in the source for “mem_used” above:
MemTotal – MemFree – (Cached + SReclaimable + Buffers) – Buffers = Used
32661080 – 464700 – 30385156 – 74448 = 1736776
It’s not exactly the same as what free is reporting as “used”, but it’s much closer. The discrepancy is due to polling the data at different times; we’re doing the same calculations above as free does.
The values provided by Net-SNMP clearly fail to take the slab space into account, or we would see a much larger “File Cache” and much smaller “Used” on our graph. Net-SNMP does use /proc/meminfo, but doesn’t take slab reclaimable space into account. Technically, the “File Cache” datapoint in the graph above is correct, as slab reclaimable space is an object cache, not a file cache. Regardless, to get this extra degree of insight, we can use Net-SNMP’s “extend” feature to get the contents of the /proc/meminfo file via SNMP and do the calculations ourselves.
Add this line to your snmpd.conf, and restart the daemon:
With LogicMonitor’s new Linux_Meminfo_SNMP DataSource your newly-configured extended OID will be discovered and monitored automatically.
But there’s one more piece of the puzzle you might still be curious about; why was the slab cache using ~28 GiB of memory? We’ll save the detailed analysis for a possible future blog, but for the curious, we looked at /proc/slabinfo (like meminfo, but for slab) and it was largely being used by the “dentry” object type. For the nerdy and curious, you can read more about the “directory entry cache” in the kernel.org vfs specification.

