
LogicMonitor dashboards are powerful tools for viewing, troubleshooting, and drawing insights from your monitoring data in a variety of ways. Using LogicMonitor, you’ll likely interface with dashboards more than most other functionalities, so it’s important to optimize your workflow as much as possible. Dashboard tokens allow you to streamline dashboard creation and editing as well as limiting human error, especially at scale.
Efficient dashboard management goes hand in hand with resource group organization. However you organize your resources internally, you can build resource groups to match that organization within LogicMonitor, and use those groups within your dashboards. For instance, if you have a resource group built around Windows resources, you can pull in resources and metrics from that group specifically on your new Windows dashboard.
One of the most common ways to structure dashboards is to serve as an overview for a resource group, because your resource group is already structured around the way resources make the most sense to your business. When building that Windows dashboard, you could call out your Windows resource group manually in every widget as you create them for your dashboard, but that isn’t what we recommend. Manually assigning resource groups is time-consuming, increases the risk of manual errors in configuration, and most importantly, it doesn’t allow for easy dashboard reassignment or cloning.
If you decide at a later date that you want to view data from another resource group on that dashboard, or more likely, you want to clone that initial dashboard and use that clone for another purpose, you’d have to reassign every widget individually to a different resource group. Dashboard tokens solve all of these issues by enabling you to set values at the dashboard level that can be used across all widgets within that dashboard.
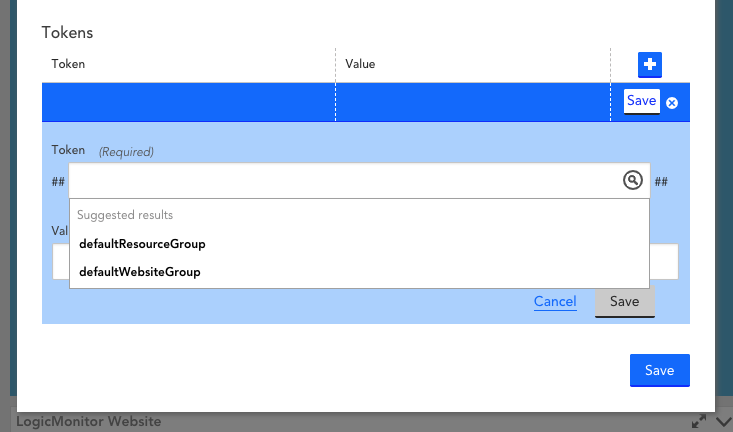
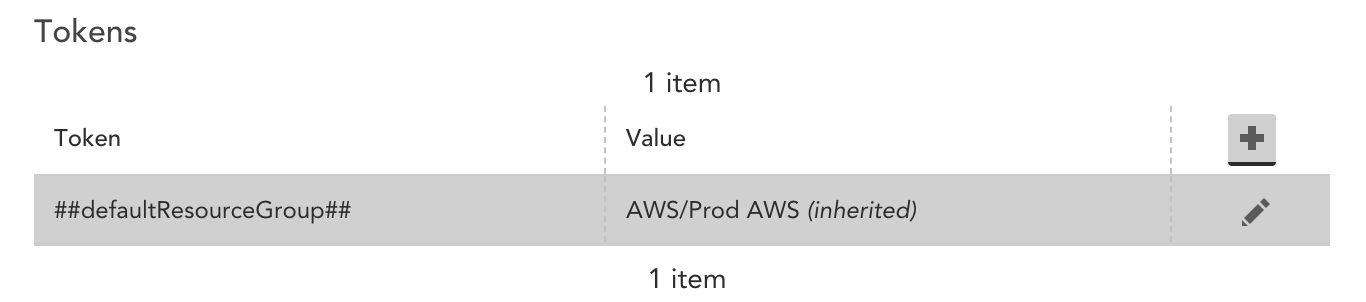
By selecting the Manage option on a dashboard, you’re presented with the ability to set Dashboard tokens. By default, every dashboard suggests two tokens, defaultResourceGroup and defaultWebsiteGroup, but you can create tokens with whatever name you like. It’s a reusable label meant to capture the overall idea of the value within, so make sure it’s something the LogicMonitor users within your organization will recognize. Think of a token like a basic class in object-oriented programming. Any changes you make to this token will be inherited by its values at the widget level within that dashboard.
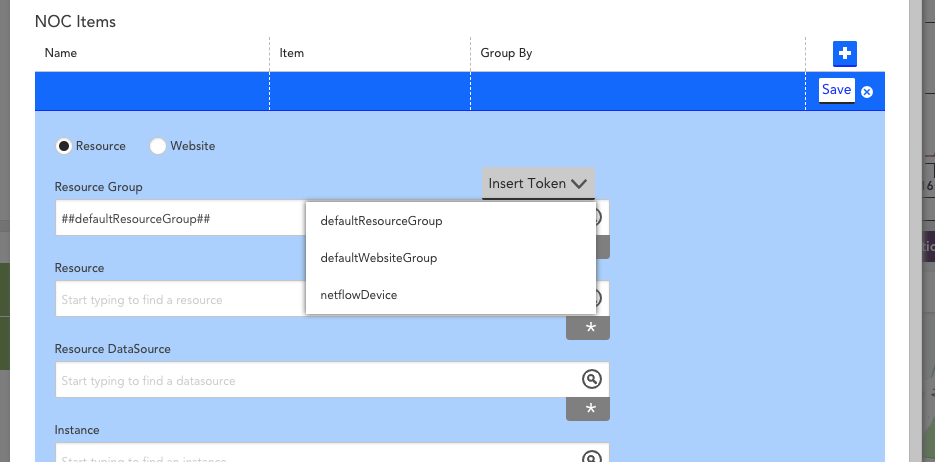
After defining your dashboard tokens, when you configure any widgets, you’ll notice that certain fields have a label “Insert Token”. Selecting this option pulls in every token you’ve defined for this dashboard.
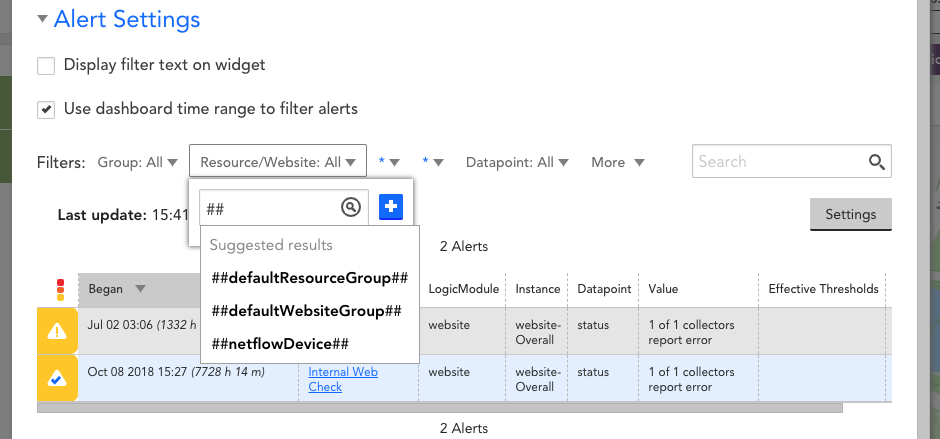
Because the configuration options differ from widget to widget, you’ll notice that the option for using tokens differs slightly on certain widgets. On the Alerts List widget, for instance, there isn’t an “Insert Token” option. Instead, on the Group and Resource/Website fields, if you type “##” into the filter field, your token options will appear.
Defining your tokens at the dashboard level and using those tokens in your widget configurations makes the task of updating your dashboard far easier. For instance, what if you had previously created a useful dashboard pointed at your “east” group, and now you wanted one built around “west”. If you clone your initial dashboard and update your dashboard token, every widget on that new dashboard will automatically point toward your “west” group. It’s magical. This approach can be used to create dashboards for sub-customers of MSPs, individual teams and departments, technologies, and any other way you’ve chosen to organize your resources.
If you’re thinking that creating tokens for each dashboard is too time-consuming, you’re in luck! You can also apply dashboard tokens at the dashboard group level, and each token will be inherited by the dashboards within. This is especially helpful if you have a number of dashboards grouped around a common theme.
Creating tokens at the dashboard group level allows an additional layer of abstraction and means you don’t have to recreate tokens for each dashboard. Using this method, you can define global tokens at the dashboard group level and additional tokens unique to each dashboard at the dashboard level.
You may be building a dashboard for any number of purposes, short-term or long, but whatever the case, dashboard tokens can help make building, organizing, and editing those dashboards a far easier process. They provide the flexibility to reuse dashboards you’ve already built, and since you can edit or add more tokens at anytime, you can use any dashboard to track virtually any device. If you use dashboards on a regular basis, consider templatizing those dashboards with tokens.

