
While LogicMonitor is great at identifying issues that need attention, sometimes figuring out what exactly the solution is can be a bit harder, especially for network issues. One relatively common case – an alert about failed TCP connections. Recently, one of our servers in the lab triggered this alert:
The host Labutil01 is experiencing an unusual number of failed TCP connections,
probably incoming connections.
There are now 2.01 per second failed connections, putting the host in a warn level.
This started at 2014-02-26 10:54:50 PST.
This could be caused by incorrect application backlog parameters, or by
incorrect OS TCP listen queue settings.
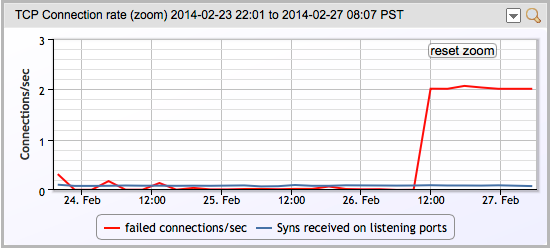
OK – so what is the next step? First thing we did was see whether this was a recent change, or had been going on for a while. A quick look at the graph of TCP connections show this was a new issue:
The graph line explains (via a mouse over) that it was showing “The number of times TCP connections have made a direct transition to the CLOSED state from either the SYN-SENT state or the SYN-RCVD state, plus the number of times TCP connections have made a direct transition to the LISTEN state from the SYN-RCVD.”
OK, maybe that’s not the best explanation – but basically it’s saying that a TCP application sent a SYN to try to open a connection, but got a RST back. (If you really want to understand all the intricacies of TCP – and there are many, and they are good to understand – I recommend TCP/IP Illustrated, by Stevens – an oldie but a goodie.)
So – what application got the RSTs? At this point, we could try to look in various log files (hoping the application in question logs this information, and logs it in a place we’d think to look) – or we can just look at the RSTs on the network.
As this server was a linux box, we’ll use TCPdump – but you can do the same things on Windows with Wireshark.
The tcpdump I ran first was this:
tcpdump -n -v ‘tcp[tcpflags] & (tcp-rst) != 0’
This is a command to run TCPdump, without name resolution (which can slow it down); with verbose output, to show all packets that have tcp flags, where the tcp-rst bit is set. (i.e. all TCP RST packets.)
And this clearly showed us… nothing.
[root@labutil01 ~]#  tcpdump -n -v 'tcp[tcpflags] & (tcp-rst) != 0'
tcpdump: listening on eth0, link-type EN10MB (Ethernet), capture size 65535 bytes
15:08:17.537699 IP (tos 0x0, ttl 64, id 0, offset 0, flags [DF], proto TCP (6), length 40)
10.0.1.141.http > 10.0.1.86.34559: Flags [R.], cksum 0x8411 (correct), seq 0
It reported one packet over 30 seconds, where a web server tore down its connection from this server via a RST (which is a valid thing to do). But we’re looking for 2 Resets per second – so that was not it. So where to look next?
You’ll note on the output above that tcpdump ran listening on the default interface, eth0. If there were other network interfaces on this host, we could have repeated the task there, telling tcpdump which interface to listen on. But this server only has one interface.
Or does it?
Programs commonly communicate over the loopback port that every Linux (and Windows) server has. Let’s see what happens when we listen there, via the -i flag….
[root@labutil01 ~]#  tcpdump -ilo -n -v 'tcp[tcpflags] & (tcp-rst) != 0'
tcpdump: listening on lo, link-type EN10MB (Ethernet), capture size 65535 bytes
15:13:13.476095 IP (tos 0x0, ttl 64, id 0, offset 0, flags [DF], proto TCP (6), length 40)
    127.0.0.1.7211 > 127.0.0.1.41838: Flags [R.], cksum 0x57d9 (correct), seq 0, ack 2154306035, win 0, length 0
15:13:13.476216 IP (tos 0x0, ttl 64, id 0, offset 0, flags [DF], proto TCP (6), length 40)
    127.0.0.1.7211 > 127.0.0.1.41839: Flags [R.], cksum 0x25bc (correct), seq 0, ack 3335718308, win 0, length 0
15:13:14.476576 IP (tos 0x0, ttl 64, id 0, offset 0, flags [DF], proto TCP (6), length 40)
    127.0.0.1.7211 > 127.0.0.1.41840: Flags [R.], cksum 0x171a (correct), seq 0, ack 2138200998, win 0, length 0
15:13:14.476721 IP (tos 0x0, ttl 64, id 0, offset 0, flags [DF], proto TCP (6), length 40)
    127.0.0.1.7211 > 127.0.0.1.41841: Flags [R.], cksum 0xaec5 (correct), seq 0, ack 1520953540, win 0, length 0
Ah…Two Resets per second. Looks like the problem. Some process is trying to connect to www.logicmonitor.com on port 7211, and that process is not running, so the server is sending back a RST.
Does this solve our problem? Well, it does if we know what the application is that normally listens on port 7211. Hopefully we say “Ah – port 7211 – I know just what that is!” Or the port is a well known port, such as 443, or 23. Then we go and start the web server, or telnet server (or stop the process from trying to connect to the telnet server, more likely.)
In this case, we knew that port 7211 is used by a component of our collector, so we just looked at the log file for that component, and found that a library was missing from a test build, that stopped that component working. Install the library, start the component, and the RSTs and alert went away.
And if you don’t know the process that should be listening on that port, and is sending the RSTs? Well, at least you know what it’s not. And now you can look at all those log files knowing a bit more – and what to exclude.
Want to see more? Follow us here:
On Facebook
On Twitter
On LinkedIn
Or, e-mail us @ [email protected]