
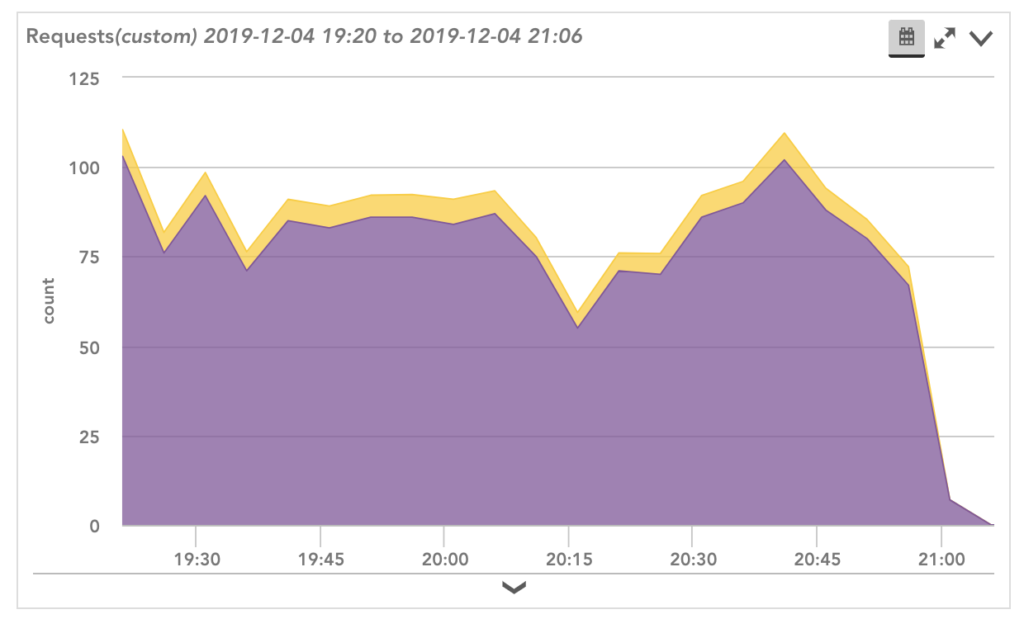
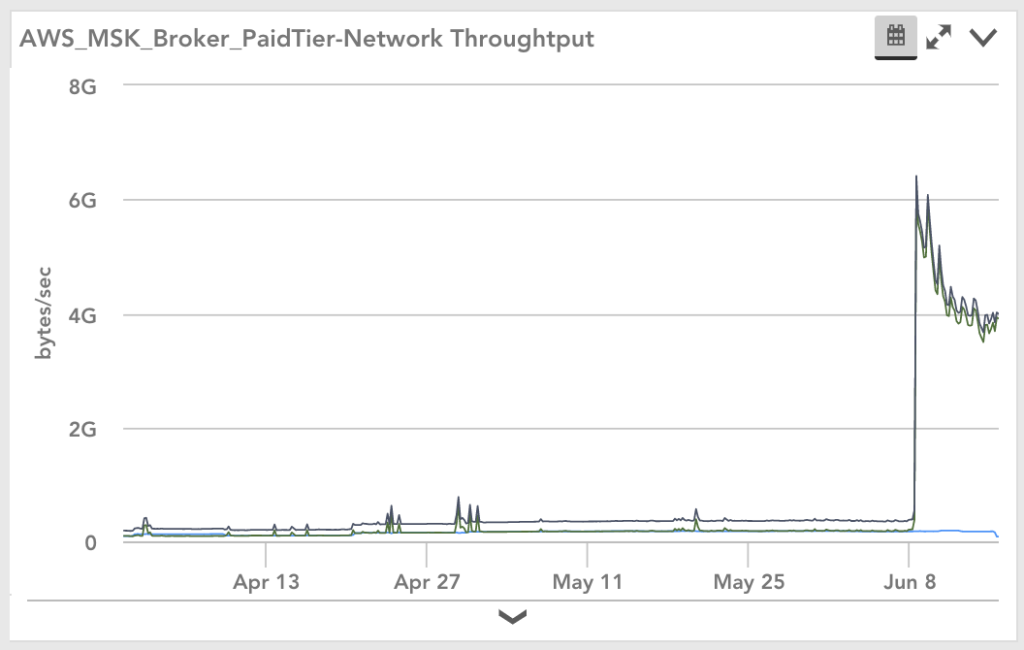
Have you ever been paged for a critical issue and started troubleshooting only to find an obvious drop in requests that weren’t caught by a static threshold? Or a significant increase in a metric that didn’t cross a static threshold? Or even, evidence of warning alerts triggered long ago that should have enabled someone to resolve the issue and prevent it from causing business impact, but instead was ignored in the massive alert volume received by the team?
LogicMonitor already has comprehensive out-of-the-box alerting set up to help avoid these issues. This setup leverages best practices thresholds at three severity levels which are intended to raise issues for a typical production environment. Dynamic thresholds suppression is intended to filter out noisy alerts.
Alerts for Metric Anomalies
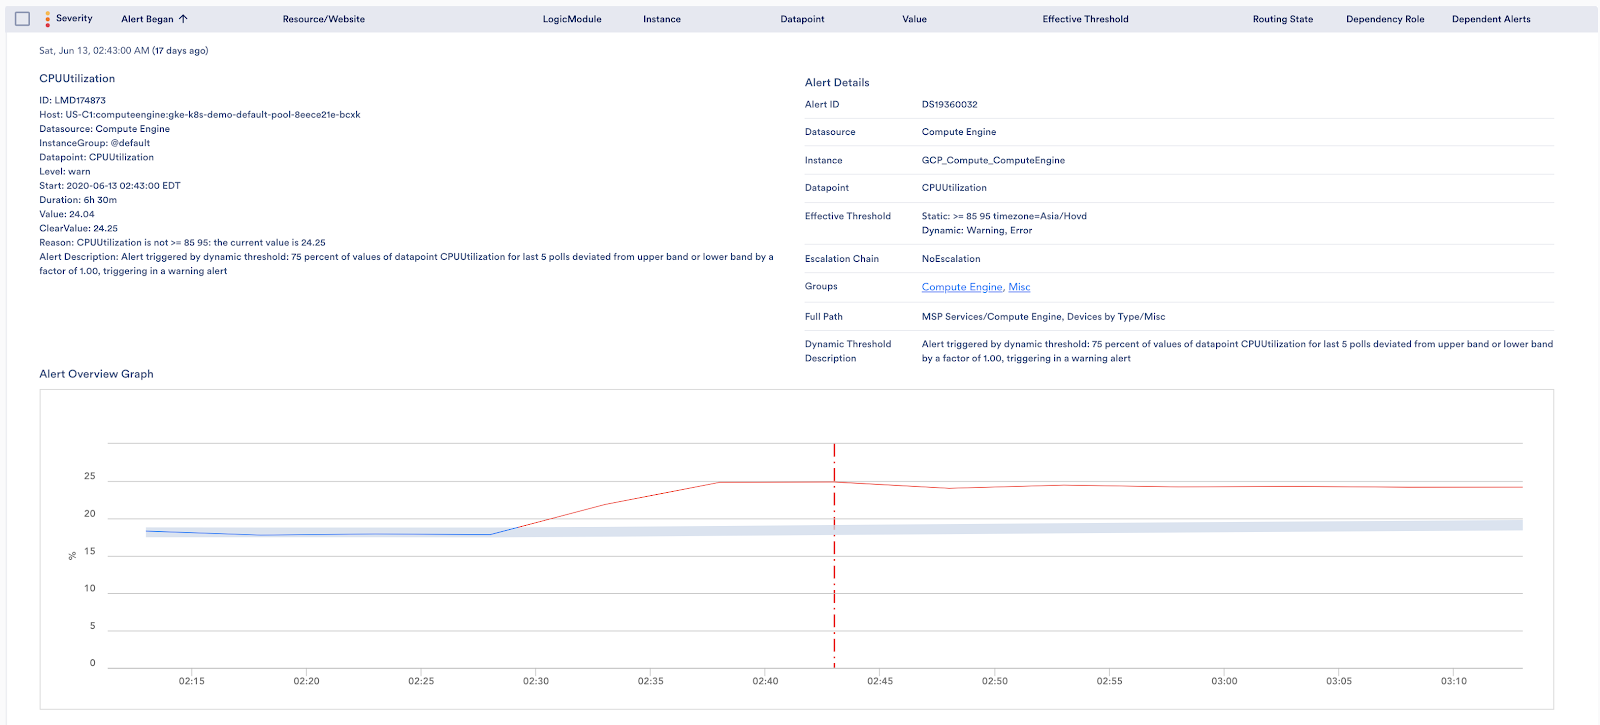
Today we’re announcing enhancements to our dynamic thresholds that will take this one step further! With these enhancements, dynamic thresholds will also generate alerts for metric anomalies – enabling faster and easier detection for the scenarios highlighted above.
Dynamic thresholds rely on anomaly detection algorithms to calculate an expected range for a resource’s performance, based on historical data. This expected range is used to identify anomalies that should generate alerts and suppress notifications for alerts that correspond to non-anomalous performance. This ensures that alerts are generated for the right things at the right time.
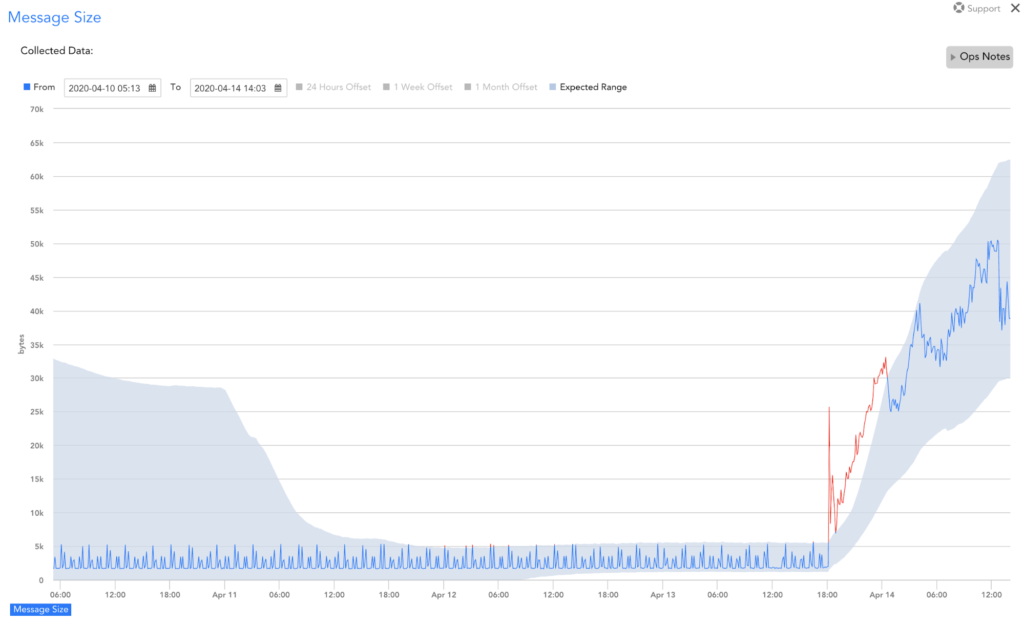
Dynamic thresholds don’t just identify anomalies in metric values, they also detect anomalies in metric rate of change (e.g. a disk that starts filling up really quickly) and time-based patterns (seasonality – e.g. a VM that normally backs up daily or weekly).
How to Get Started
It’s easy to get started, just enable the dynamic thresholds for desired severities, and the expected range is auto-generated. Of course, consistent with everything else in LogicMonitor, we worked hard to make this auto-generated range widely applicable with sensible defaults, but you can customize it if needed with the ‘Advanced Configuration’.
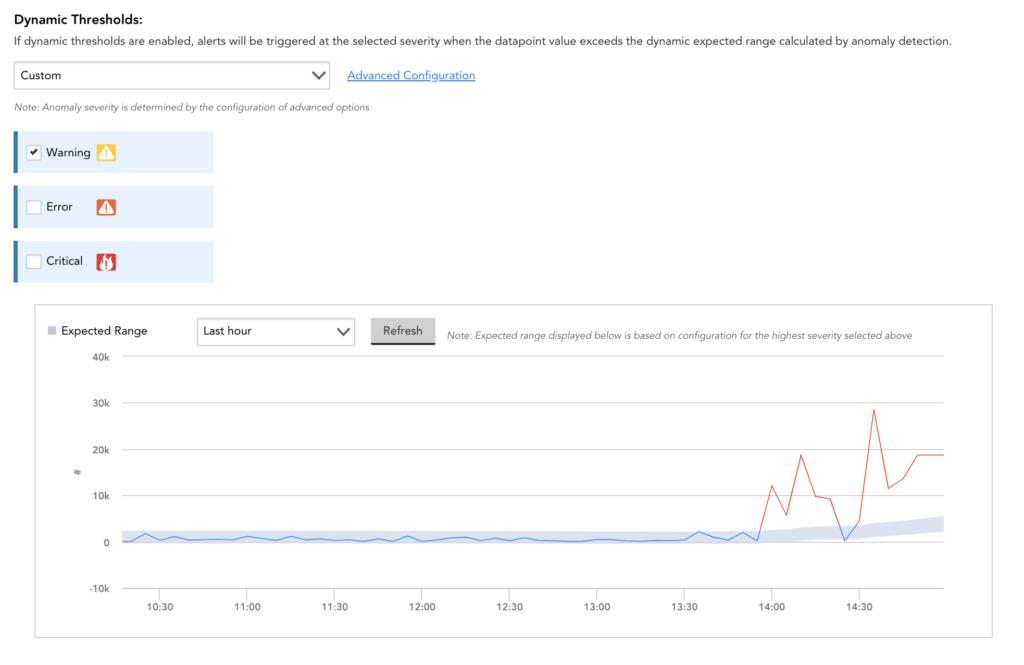
Once it’s enabled, you can rest assured that dynamic thresholds will generate alerts for anomalies (as well as suppress notifications for static threshold-generated alerts that don’t correspond to anomalies).
Compatible With Static Thresholds
One unique aspect of LogicMonitor’s dynamic thresholds is its ability to work well with static thresholds. It’s the best of both worlds: dynamic thresholds will compensate for static thresholds that are poorly tuned or aren’t set at all (by suppressing notifications where too many alerts are generated, and triggering alerts where alerts should be generated but aren’t), and defer to static thresholds where they are set well. The combination ensures the right alerts are generated at the right times for your team while minimizing the overhead of tuning alert conditions manually.
Combined with other features from LogicMonitor’s Early Warning System – such as root cause analysis and forecasting – dynamic thresholds can help you more proactively prevent problems that result in business impact. This intelligence, combined with LogicMonitor’s comprehensive monitoring coverage – from infrastructure to applications to network, running on-premises or in the cloud – ensures you have the visibility you need to succeed even in the most complex of environments. To learn more about LogicMonitor’s AIOps Early Warning System or to see it in action, sign up for a free trial.

