
When most people hear ‘dynamic thresholds’ in the context of monitoring, they think of the ability to trigger alerts based on a non-static threshold. While this can be incredibly useful, it’s really only half the picture.
Modern IT infrastructure is complicated – oftentimes with infrastructure spanning cloud and on-premises environments – and IT operations teams are inundated with data and alert noise for these environments. They have more information than they can meaningfully use, which leads to issues being obscured in the noise and IT operations teams spending the majority of their time reacting to problems. To fix this, and work towards preventing problems instead, these teams need something to cut through the noise and surface the most important information. Here at LogicMonitor, we believe there are two major aspects that dynamic thresholds should solve to achieve this:
- Cut out the noise due to thresholds that haven’t been tuned well, surfacing the important issues.
- Identify issues that wouldn’t be caught by traditional static thresholds.
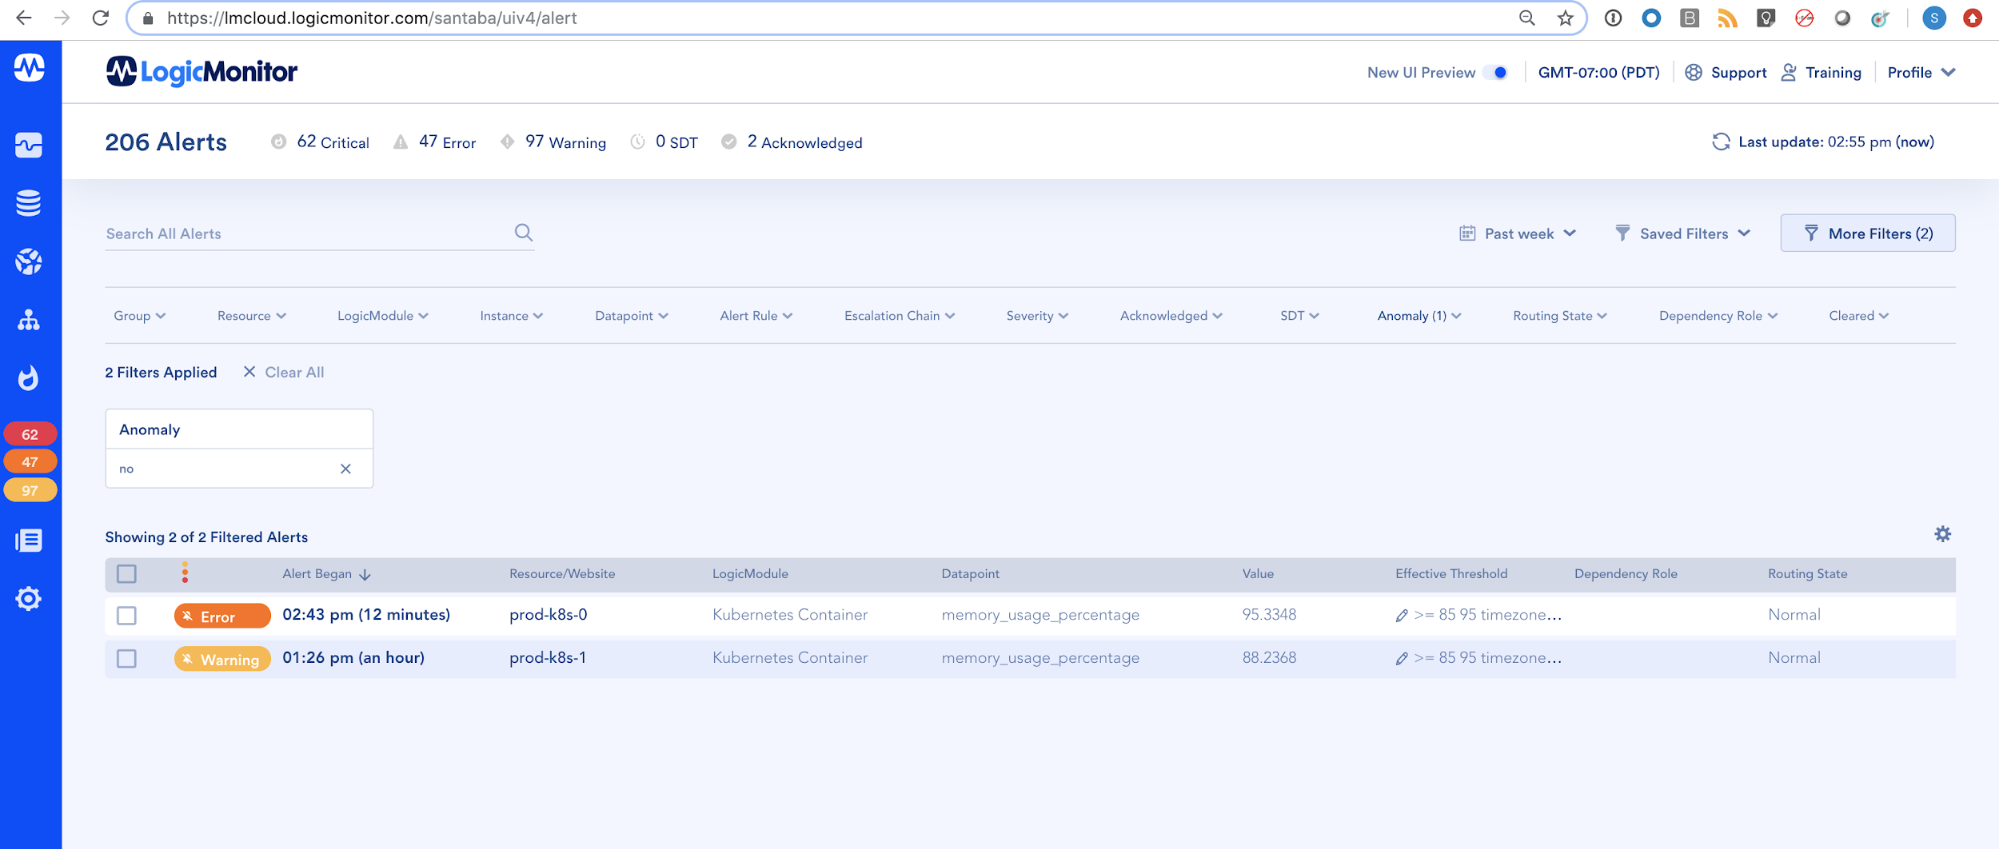
This is why we believe that triggering alerts is only half of the picture for dynamic thresholds and that the other half is using dynamic thresholds as a filter to reduce alerts to only what is immediately relevant.
LogicMonitor’s dynamic thresholds will cover both functions identified above, starting with the first in phase one. LogicMonitor already has pre-configured thresholds set based on domain-specific best practices to ensure that meaningful alerts are triggered out of the box. With the first phase of dynamic thresholds, LogicMonitor takes this a step further by calculating an expected range for a resource’s performance, and only sending out notifications for triggered alerts that correspond to values outside of this range, thereby ensuring that alerts are only sent out for anomalies, and that teams only get notified when issues truly need their attention.
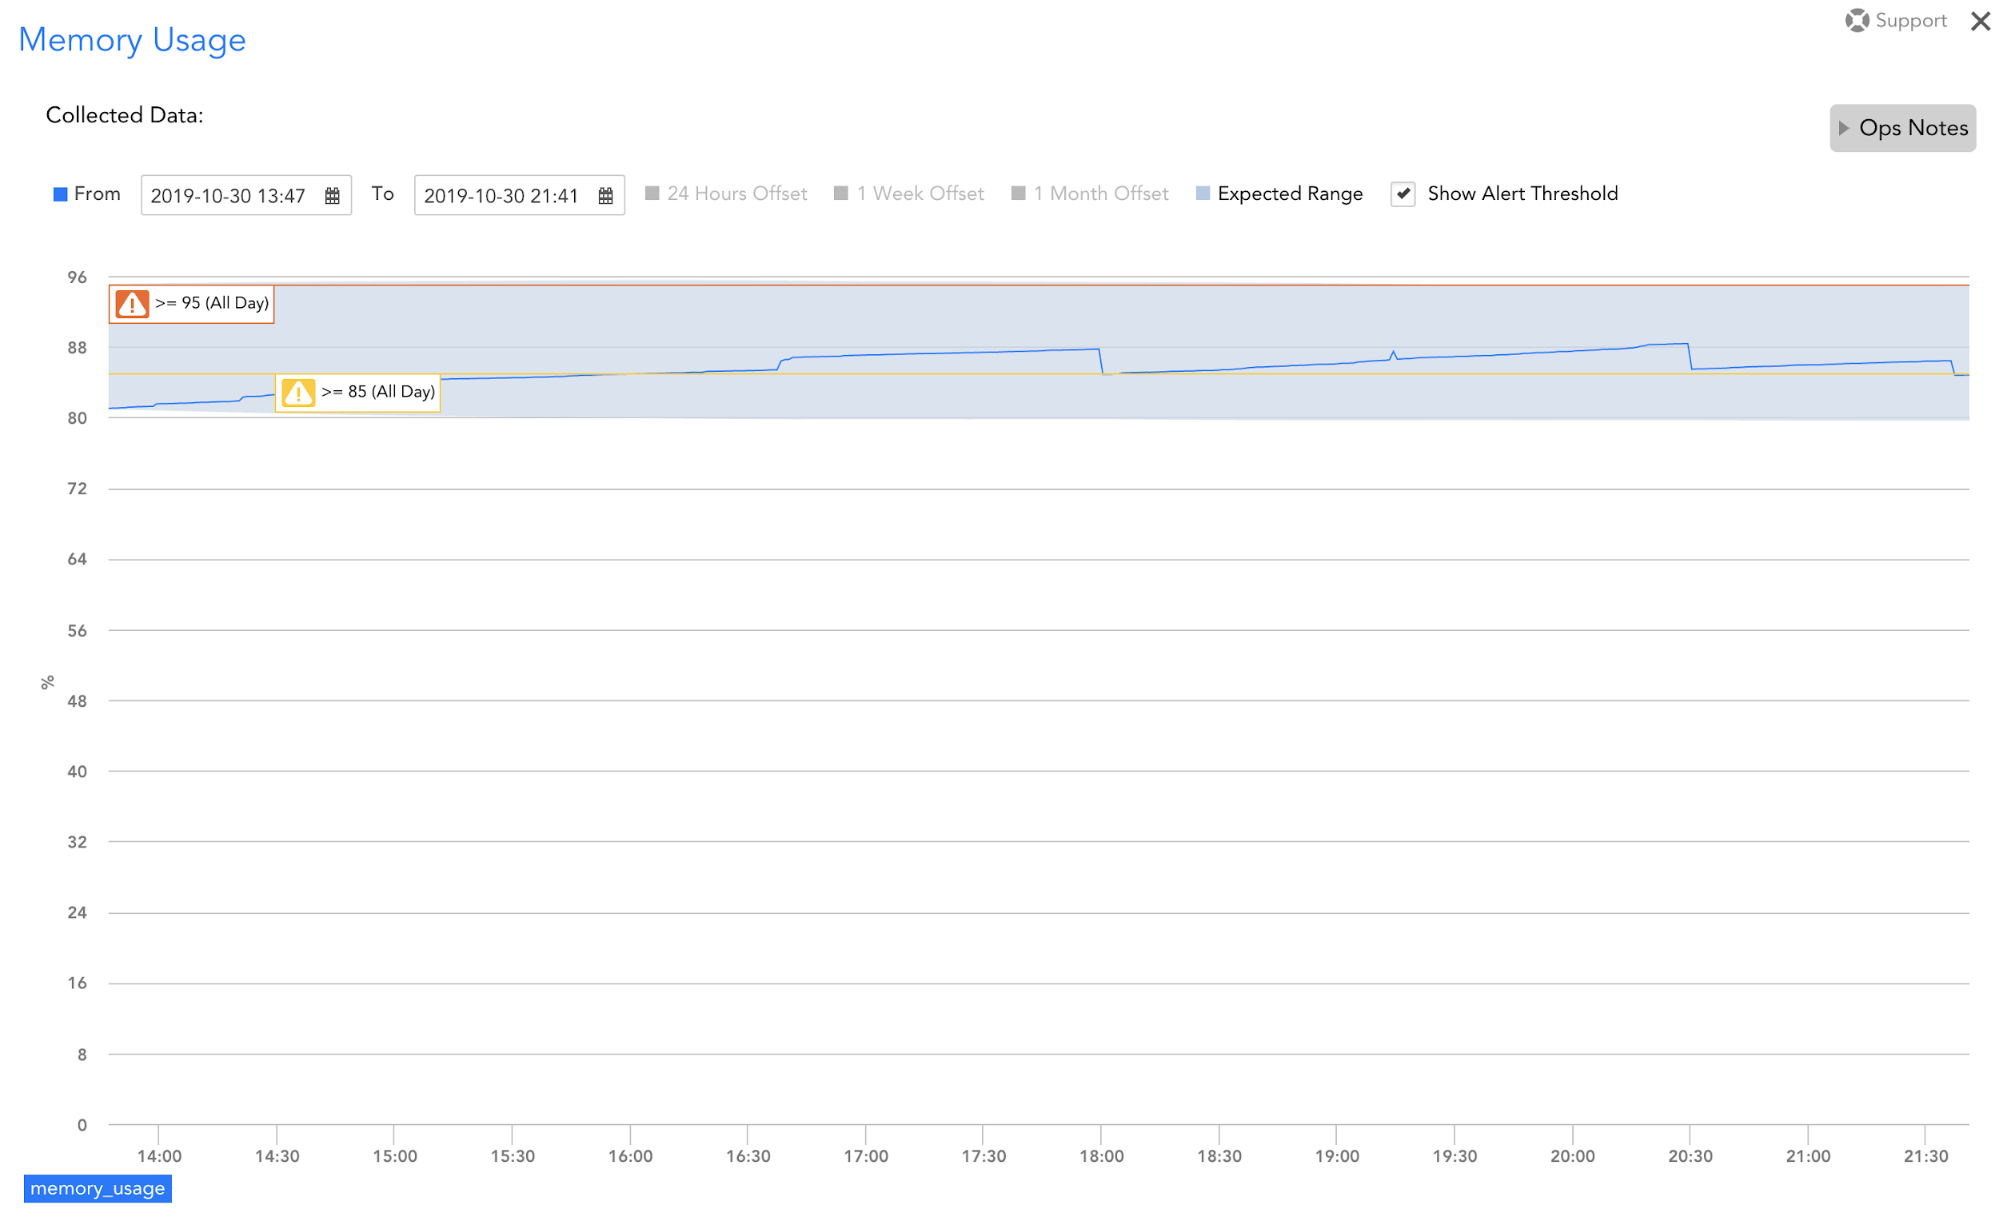
There can a lot of administrative overhead required to accurately and specifically tune static thresholds for a large environment – especially if resources are utilized differently (i.e. some are intentionally highly utilized and others not). With this first phase of LogicMonitor’s dynamic thresholds, IT operations teams can save time customizing static thresholds because a dynamic expected range is used to determine whether alerts should be routed. Alerts within the range are still displayed within LogicMonitor, but users are not notified for them. With this functionality, LogicMonitor will automatically identify the “normal” resource consumption for an intentionally highly utilized resource and only notify users of consumption that is not normal.
LogicMonitor’s breadth of coverage, with over 2000 out of the box monitoring templates covering everything from the cloud to systems you’d find in a traditional on-premises environment (e.g. servers, switches, storage arrays, etc.) to containers and the applications running within them, enables dynamic thresholds to be applied across the entire modern distributed IT infrastructure. As such, LogicMonitor’s first phase of dynamic thresholds provides IT operations teams with an easy way to eliminate noise in their complex infrastructures and focus on what’s important to drive their businesses forward.

