
Many of our customers use Puppet to manage the provisioning and configuration of their infrastructure. We know that our users additionally rely on monitoring to help prevent outages. With this in mind, we built our original Puppet module to enable users to use their Puppet infrastructure code to manage their LogicMonitor monitoring environment, which provides the benefits of:
- Consistency: Ensure that grouped devices have identical monitoring configurations and avoid issues due to obscured variations.
- Scalability: Devices are added into monitoring automatically, so you never have to wonder if a device is being monitored again.
- Security: Set sensitive credentials and rotate them across your physical and monitoring environments all from one place.
We recently gave our module a little TLC and published a new version. This new module is compatible with Puppet 4 (while remaining compatible with Puppet 3), has been Puppet approved, and relies on the LogicMonitor REST API (making it significantly more efficient).
Of course, the benefits of our module rely on the success of Puppet runs. As such, and as usual here at LogicMonitor, we recommend having sufficient monitoring in place. If you are using our Puppet module, then you’re likely using PuppetDB. Puppet agents report statistics about recent runs and overall environment health to PuppetDB.
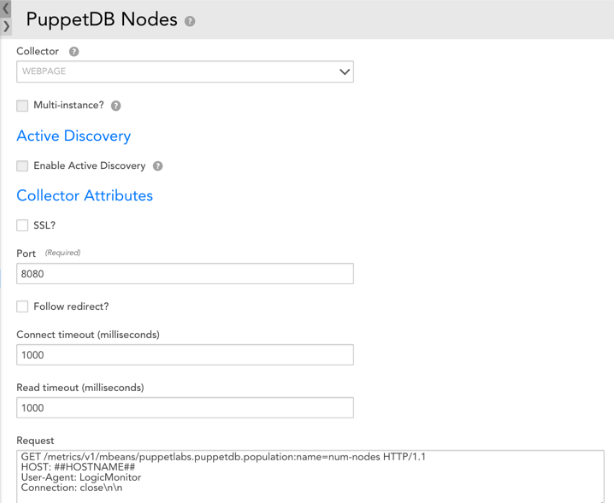
With LogicMonitor’s flexible nature, it is trivial to query PuppetDB’s published API using an HTTP (webpage) Datasource. For example, you can get information about recent Puppet runs via the reports API endpoint. Other information of interest may be reported via the metrics API endpoint. The LogicMonitor HTTP Datasources used to get this information will be almost identical, with the only variations occurring in the API paths and in how the information returned is parsed.
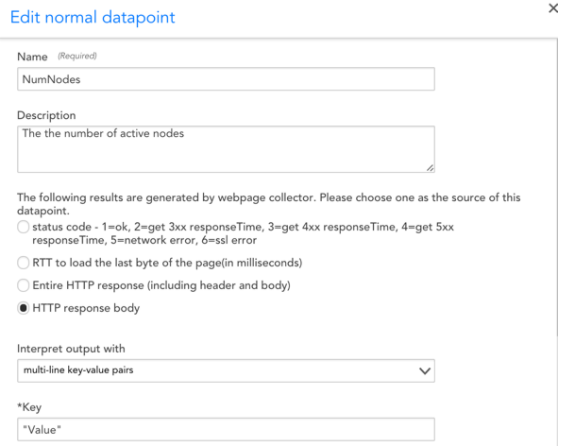
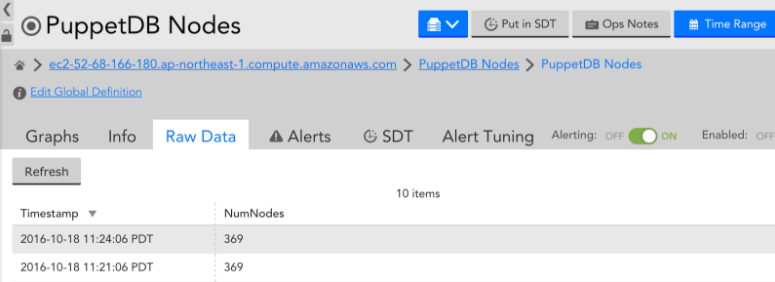
Here’s an example Datasource that reports the number of Puppet nodes:
If you aren’t using PuppetDB, there are other ways you can set up Puppet monitoring in LogicMonitor. Here are a few ways we’ve done it:
- Extend SNMP to expose the information in Puppet’s last_run_summary.yaml file. You can then use an SNMP or Script Datasource to query the new OIDs that map to the Puppet run stats.
- Save the information in Puppet’s last_run_summary.yaml file to a different database and query that database using LogicMonitor Datasources (e.g. https://puppet.com/blog/puppet-monitoring-how-to-monitor-success-or-failure-of-puppet-runs )
Interested in learning more about our LogicMonitor Puppet integration? Come meet the LogicMonitor team this week at #PuppetConf 2016 in San Diego! We are sponsoring this year’s event and giving away limited edition LogicMonitor swag on-site at our booth – our Events Team would love to meet you and show you how we can help you manage your complex and agile workloads with a product demo. Contact [email protected] with any questions.

