
In parts I and II, we’ve talked about what virtual memory is, and how to monitor virtual memory on Linux.
Why is Solaris any different? Two reasons: (1) it virtualizes the swap space, and includes unused parts of physical memory as swap space, and (2) it maintains the distinction between paging and swapping.
These two factors often give rise to confusion and misinterpretation of the data, especially when queried via SNMP.
We still have the same set of questions we would like to answer as we had for Linux:
- how much physical memory is in use
- how much virtual memory is in use
- what is the rate of moving memory from physical memory to disk
However, with Solaris, we need slightly different tools, and a bit more understanding.
Solaris Physical Memory Usage
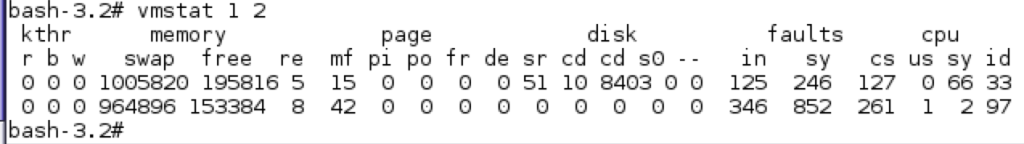
The simplest way is to run vmstat 1 2 and look at the second row. (The first line of vmstat is a global average of activity since the system booted.) The column headed free shows the amount of free memory in K bytes – and Solaris is nice enough to include the file system cache in this figure, so it is good representation of available memory. The system above has about 150M of free physical memory (some of which may be in use as a file system cache.) If you want to see a detailed breakdown, run echo ::memstat | mdb -k
Virtual Memory in Use
Reading the man pages for swap, you’d think the best command to see the amount of swap space in use would be swap -s, which is listed as reporting “summary information about total swap space usage”. That is what is does – but given that on Solaris the swap space also includes a portion of the physical memory, it’s less useful than you might think. I prefer to use swap -l, which, per the man page, is to just “List the status of all the swap areas.”
Comparing the output of these two commands:
bash-3.2# swap -s
total: 267032k bytes allocated + 86184k reserved = 353216k used, 964544k available
bash-3.2# swap -l
swapfile             dev  swaplo blocks   free
/dev/zvol/dsk/rpool/swap 181,1       8 2097144 2097144
bash-3.2#
If we look at swap -s, it seems we are using 353216k of (964544 + 353216)k total – or 26% is in use. However, looking at swap -l, it seems all the 2097144 blocks are free – so we have 0% in use. (The blocks in question are 512 bytes – so there is 1GB free – which is the total swap space on this system.)
So which is true? Both are – but remember swap -s includes the portion of physical memory in use as virtual swap. For performance and capacity monitoring – you don’t care about swap memory that is in fact backed by physical memory. (It’s obviously not going to have much of a performance penalty to swap in/out of physical memory.) Another issue is that the amount of physical memory used by the virtual swap system is subject to other demands for physical memory – so your percentage of swap used, as reported by swap -s, can vary quite a lot, without any use at all of the physical disk swap partitions, or real change in the workload of the system.
As with Linux, high swap usage itself is not indicative of a problem. Swap usage that is so high that there is no further free virtual memory to spawn processes is a Big Problem, so you want to make sure you never run out – but it is active swapping that will kill your performance.
Monitoring the rate of swapping, or memory pressure
As noted above, Solaris preserves a distinction between swapping (moving all memory for a process out to virtual memory) and paging (swapping out least used pages, instead of entire processes.)
These activities can be viewed with vmstat -S 1
 kthr      memory            page            disk          faults      cpu
 r b w   swap  free  si  so pi po  fr  de sr cd cd s0 --   in   sy   cs us sy id
 0 0 69 706068 6272   0   0 12 425 4532 0 209031 94 0 0 0 590 2853 3964 2 10 88
 0 0 69 702168 6264   0   0  4 388 4012 0 206960 133 0 0 0 686 2726 7806 2 11 87
The above vmstat output shows a system that has not swapped in or out any processes (the si and so columns), but is actively paging memory out (po) and to a lesser extent paging in (pi).
Normally, without the -S flag, vmstat only shows the paging information, not swapping – as it is quite rare for a system to have to resort to swapping processes out.
Solaris has another useful metric in the vmstat output: the scan rate (shown in the sr column). This is the pages scanned by the page scanner, a kernel thread which runs when the amount of free memory falls below a threshold, typically 1/64th of total physical memory. The page scanner looks for pages that haven’t been used recently to page out to the swap device, and so free up. If the scan rate is non-zero, then there is memory pressure on the server. If the scan rate is above the slowscan rate (which defaults to 100) for more than a second, then the system will be more aggressively looking for pages to free.
Thus on Solaris, the items to watch are the pi,po, and sr columns of vmstat.
SNMPd is not your friend
OK, so monitoring memory usage from within Solaris should be easy enough. But how about from your management station? Most people use SNMP to monitor their systems, which works well for many things. But not for Solaris swap rates. The standard MIB objects used are .1.3.6.1.4.1.2021.11.62.0 and .1.3.6.1.4.1.2021.11.63.0, or ssRawSwapIn and ssRawSwapOut. Sounds reasonable – but given that Solaris makes a distinction between swapping and paging, and that it rarely has to swap – this is not likely to be a useful metric. (In almost all cases, the amount of swapping will be zero.)
For example, consider this system:
bash-3.2# vmstat 1
 kthr memory page disk faults cpu
 r b w swap free re mf pi po fr de sr cd cd s0 -- in sy cs us sy id
 0 0 13 1047524 253784 5 30 1 7 10 0 410 7 8403 0 0 180 305 174 0 51 49
 1 0 65 783244 51480 6 16835 0 3084 3228 0 154059 23 0 0 0 481 34452 756 18 15 67
 0 0 65 731404 6268 7 4013 0 4088 6800 0 194145 77 0 0 0 510 8968 839 5 10 85
 0 0 65 718752 6272 21 6681 0 4088 9772 0 192439 132 0 0 0 800 14137 11622 8 15 77
 0 1 65 710584 6232 11 2025 0 3604 8531 0 188713 109 0 0 0 562 4880 3762 3 10 87
 0 0 65 707544 6256 440 1145 40 4048 4614 0 208458 173 0 0 0 905 3028 14583 3 29 68
 0 0 65 1303988 590132 13 288 1038 0 0 0 0 472 0 0 0 1236 1130 1079 1 9 90
 0 0 65 1303956 589768 12 31 20 0 0 0 0 20 0 0 0 438 1416 457 2 2 96
 0 0 65 1303956 589548 24 32 4 0 0 0 0 10 0 0 0 379 949 280 1 2 97
^C
bash-3.2# /opt/csw/bin/snmpwalk -c1 -cpublic 127.0.0.1 .1.3.6.1.4.1.2021.11.ssSwapOut
UCD-SNMP-MIB::ssSwapOut.0 = INTEGER: 0 kB
This system is under LOTS of memory pressure – almost 200,000 pages scanned per second, and around 4000 pages paged out per second. Yet according to the most commonly used OID by SNMP monitoring tools, there have been zero swap outs. This is correct, as no processes have been swapped out, only pages. But not very useful if you are trying to detect a low memory state that will kill performance on your server. (Linux, on the other hand, does not distinguish between paging and swapping, so reports the values of pages swapped in/out for these OIDs.)
So – how does your monitoring system get the useful metric of pages paged in or out, and the scan rate? There is no OID that reports the scan rate, or the rates of paging in/out. So default SNMP won’t work. This leaves two choices: extending your snmpd to return the values you want (which means changing snmpd on each server: hopefully not an issue if you use puppet or some other configuration management tool – which I’m sure you are, right?) or collecting the data via SSH to run a command. (The latter is what LogicMonitor uses for Solaris monitoring.)
In either case, you need to get the data to output in an easy format. vmstat 1 1 gives the data, but not in a terribly machine friendly format. Instead, use vmstat -s. This reports cumulative statistics about the system since boot – perfect for a monitoring system that can interpolate the difference between two samples as a rate.
The trick here is to realize what the metrics are, as the names are not the same as in the other forms of vmstat.
Thus where a vmstat -s output will look like this:
bash-3.2# vmstat -s
 15 swap ins
 12 swap outs
 75 pages swapped in
 1295 pages swapped out
 999103 total address trans. faults taken
 5191 page ins
 3988 page outs
 5208 pages paged in
 55210 pages paged out
 132724 total reclaims
 132722 reclaims from free list
 12355015 pages examined by the clock daemon
this can be translated to the more common form of vmstat columns, with some examples below:
| pages examined by the clock daemon | equivalent to sr column |
| pages paged in | equivalent to pi column |
| pages paged out | equivalent to po column |
It’s also useful to monitor and collect the other statistics (e.g. page ins – which are page in operations, each of which may be responsible for multiple pages), but these are the critical ones.
Just be aware that if you are relying on the same SNMP OIDs as you use for Linux – you are not in fact measuring Solaris paging activity in a useful way. (You are measuring swapping.)
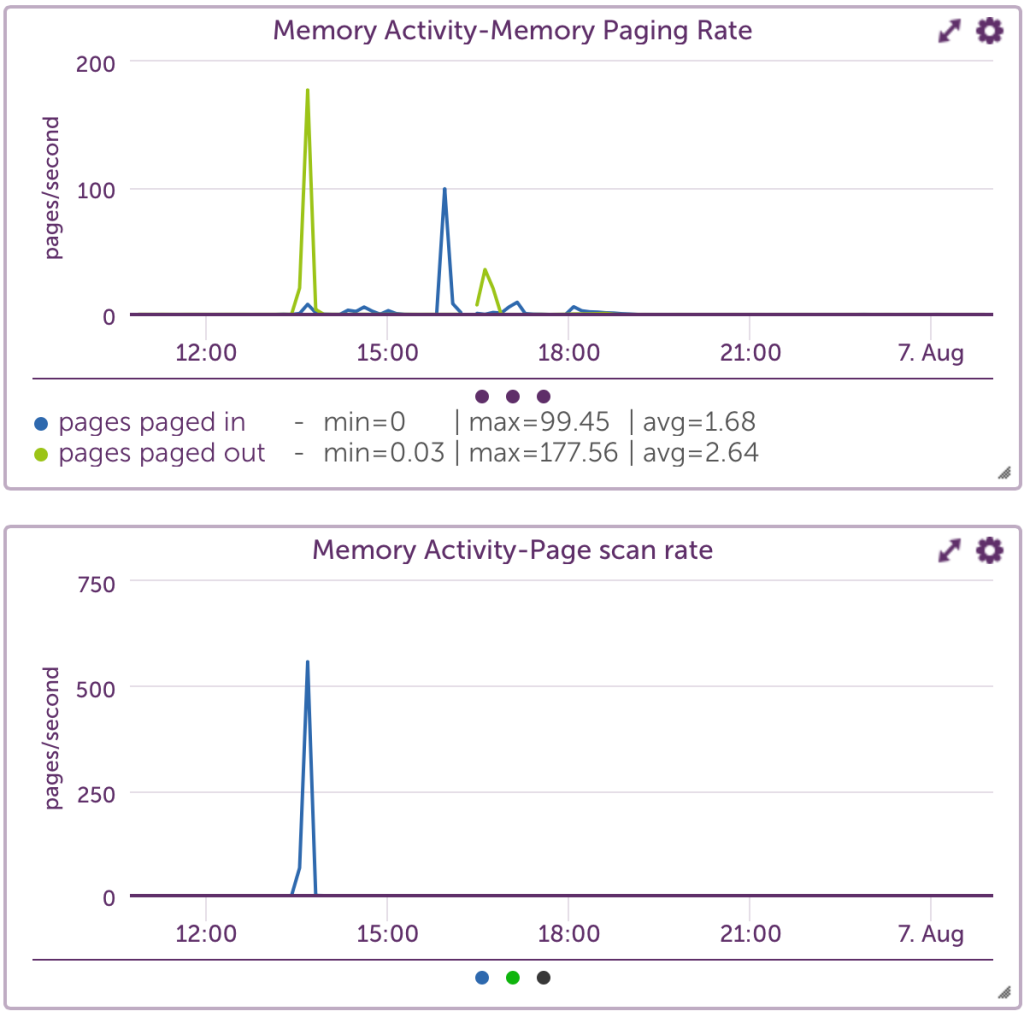
So ensure your monitoring system is in fact parsing the output of vmstat -s, so you get something like the below – and you should be good to go.
Want to see more? Follow us here:
On Facebook
On Twitter
On LinkedIn
Or, e-mail us @ [email protected]