
As LogicMonitor’s Financial Controller, I’m proud to share some exciting news from the LogicMonitor finance department. I know, I know … “exciting” and “finance” rarely go together … but if you’re adventurous enough to read on, you’ll hear about how we’re bringing accuracy and efficiency to our accounting operations using two leading technologies: Zuora and LogicMonitor.
As hopefully you already know, LogicMonitor is the automated IT performance monitoring platform. We’re fortunate to have a rapidly expanding customer base and an ever-growing number of devices being monitored by our customers around the globe. Even better, the LogicMonitor solution allows customers to easily add devices to monitoring and scale up or down depending on their needs. But with that comes complexity in the accounting world.
Our customers are charged, in part, based on the quantity of devices being monitored – which can change daily – so we needed a cutting edge solution to track and provide accurate billing information. We turned to Zuora, the leading SaaS finance and billing management offering to provide accurate financial reporting and track critical SaaS metrics. (Yes … SaaS working with SaaS … it’s the way the technology gods always wanted it to be).
For the technically inclined, here is a quick summary of how we report data to Zuora:
- We use Puppet as our configuration management tool. We’ve extended Puppet to add some specific facts from database queries– the current number of hosts, cloud services, web site service checks, etc, for each customer account. These facts are collected every 15 minutes, on every server, and reported back via Puppet’s MCollective agent, and stored in a MongoDB database.
- We periodically use Zuora’s SOAP API to create two Zuora Rate Plan Charge Data Export Objects. These dump all current records of subscription rate plan charges: one export is for the most recent subscription amendment; and one is for those subscriptions that have not been amended.
- We then aggregate the LogicMonitor billing data from MongoDB, where appropriate (e.g. for combining quantities across linked accounts); compare the current LogicMonitor counts to the current Zuora counts, and, if the amounts differ and are in a significant range, we issue an amendment to Zuora against that customer’s subscription to update the quantities to the current state. (Not all changes require amendments: e.g. if a customer has a 1000 device commit level, and their account is fluctuating between 950 and 980 devices – no need to tell Zuora.)
- During the amendment submission process, the integration parses each API response to detect success or failure per amendment, and proceeds to write the summary data to the integration’s summary document in its own MongoDB, to ensure the results and performance may be monitored.
However, with an expanding customer base and growing volume of devices being monitored, therein lies the challenge for someone with the word “Control” right smack in his job title … How do I know that the information in Zuora is accurate? How can I be assured that the device count being tracked by LogicMonitor is being fed completely and accurately into Zuora?
For that quandary we turned to an old and trusted solution … our own platform. You see … at LogicMonitor we’re kind of obsessed with monitoring. We monitor our servers, we monitor customer satisfaction reports, we monitor marketing leads … hell, we even monitor the levels and temperature of beer in our office kegerator. So when Finance came asking for monitoring and controls, it was only natural for our Technology Operations to use LogicMonitor to track and monitor the sync between LogicMonitor and Zuora. This allowed us to get real-time alerts on any connectivity errors or data integrity concerns.
We use LogicMonitor’s native MongoDB monitoring for this purpose. While the most common use of our MongoDB monitoring is to easily monitor the replication, performance and availability of MongoDB databases, it’s easily extended to monitor business specific metrics.
We constantly query metrics relating to our Zuora update process, allowing us to see at a glance if the attempt to update subscriptions in Zuora succeeded or failed (for example, a subscription using a pricing scheme that was defined incorrectly, without a price for more than 100 devices, would have it’s amendment fail if the amendment attempted to specify 110 devices in use – a case we uncovered due to our monitoring.)
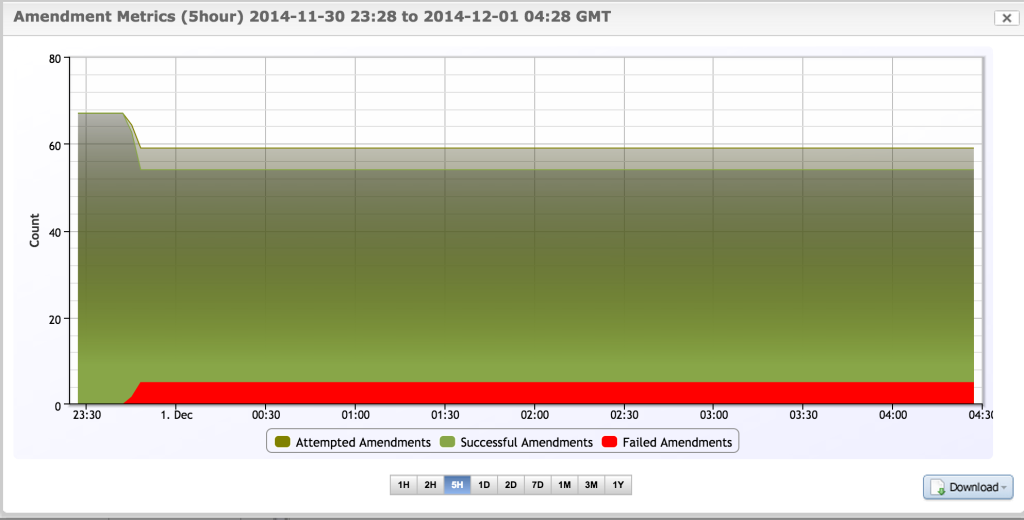
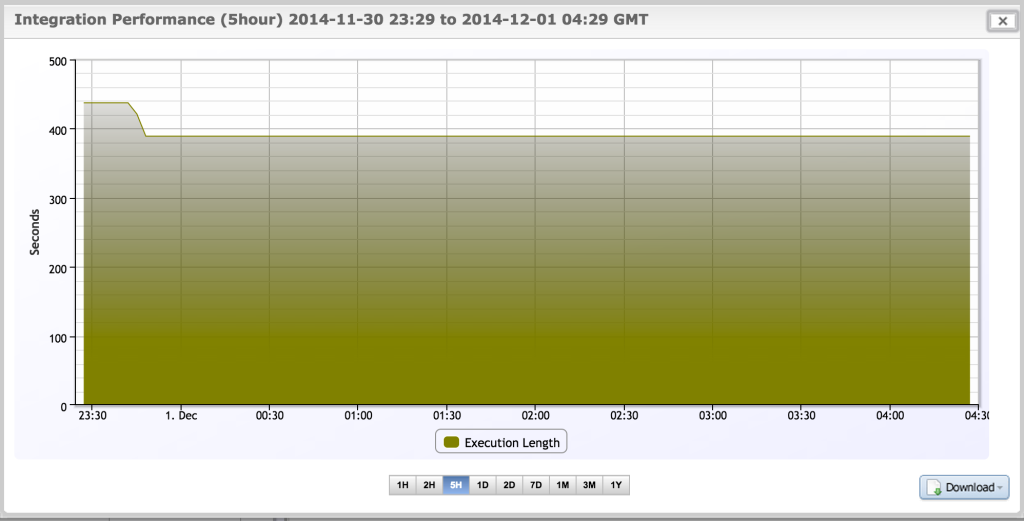
We also query facts that impact the integrity of the process, such as accounts without valid subscriptions; accounts with an active state present more than once in our infrastructure; script failures, and the execution time of the synchronization process.

All these anomalous states now generate real time alerts, so our diligent Finance team can fix the underlying issue, before it adversely impacts our customers with incorrect charges (or worse – from my point of view – our audit results!)
We hope you enjoyed hearing a little bit about the inner workings of the LogicMonitor Finance team.