Configuration Monitoring
LogicMonitor’s configuration monitoring allows you to view, monitor, manage and alert on device configurations all within a single platform. Correlate configuration file monitoring and storage with infrastructure performance across networks, data centers and customer locations.
Configuration monitoring without the hassle
Configuration monitoring with LM Envision integrates configuration monitoring directly into LogicMonitor’s infrastructure platform using a combination of active discovery, change detection, customizable alert checks, and automatic storage of configuration file history. Out-of-the-box support for Groovy and Powershell scripts give visibility into performance and availability while speeding up service problem resolution and freeing up resources.
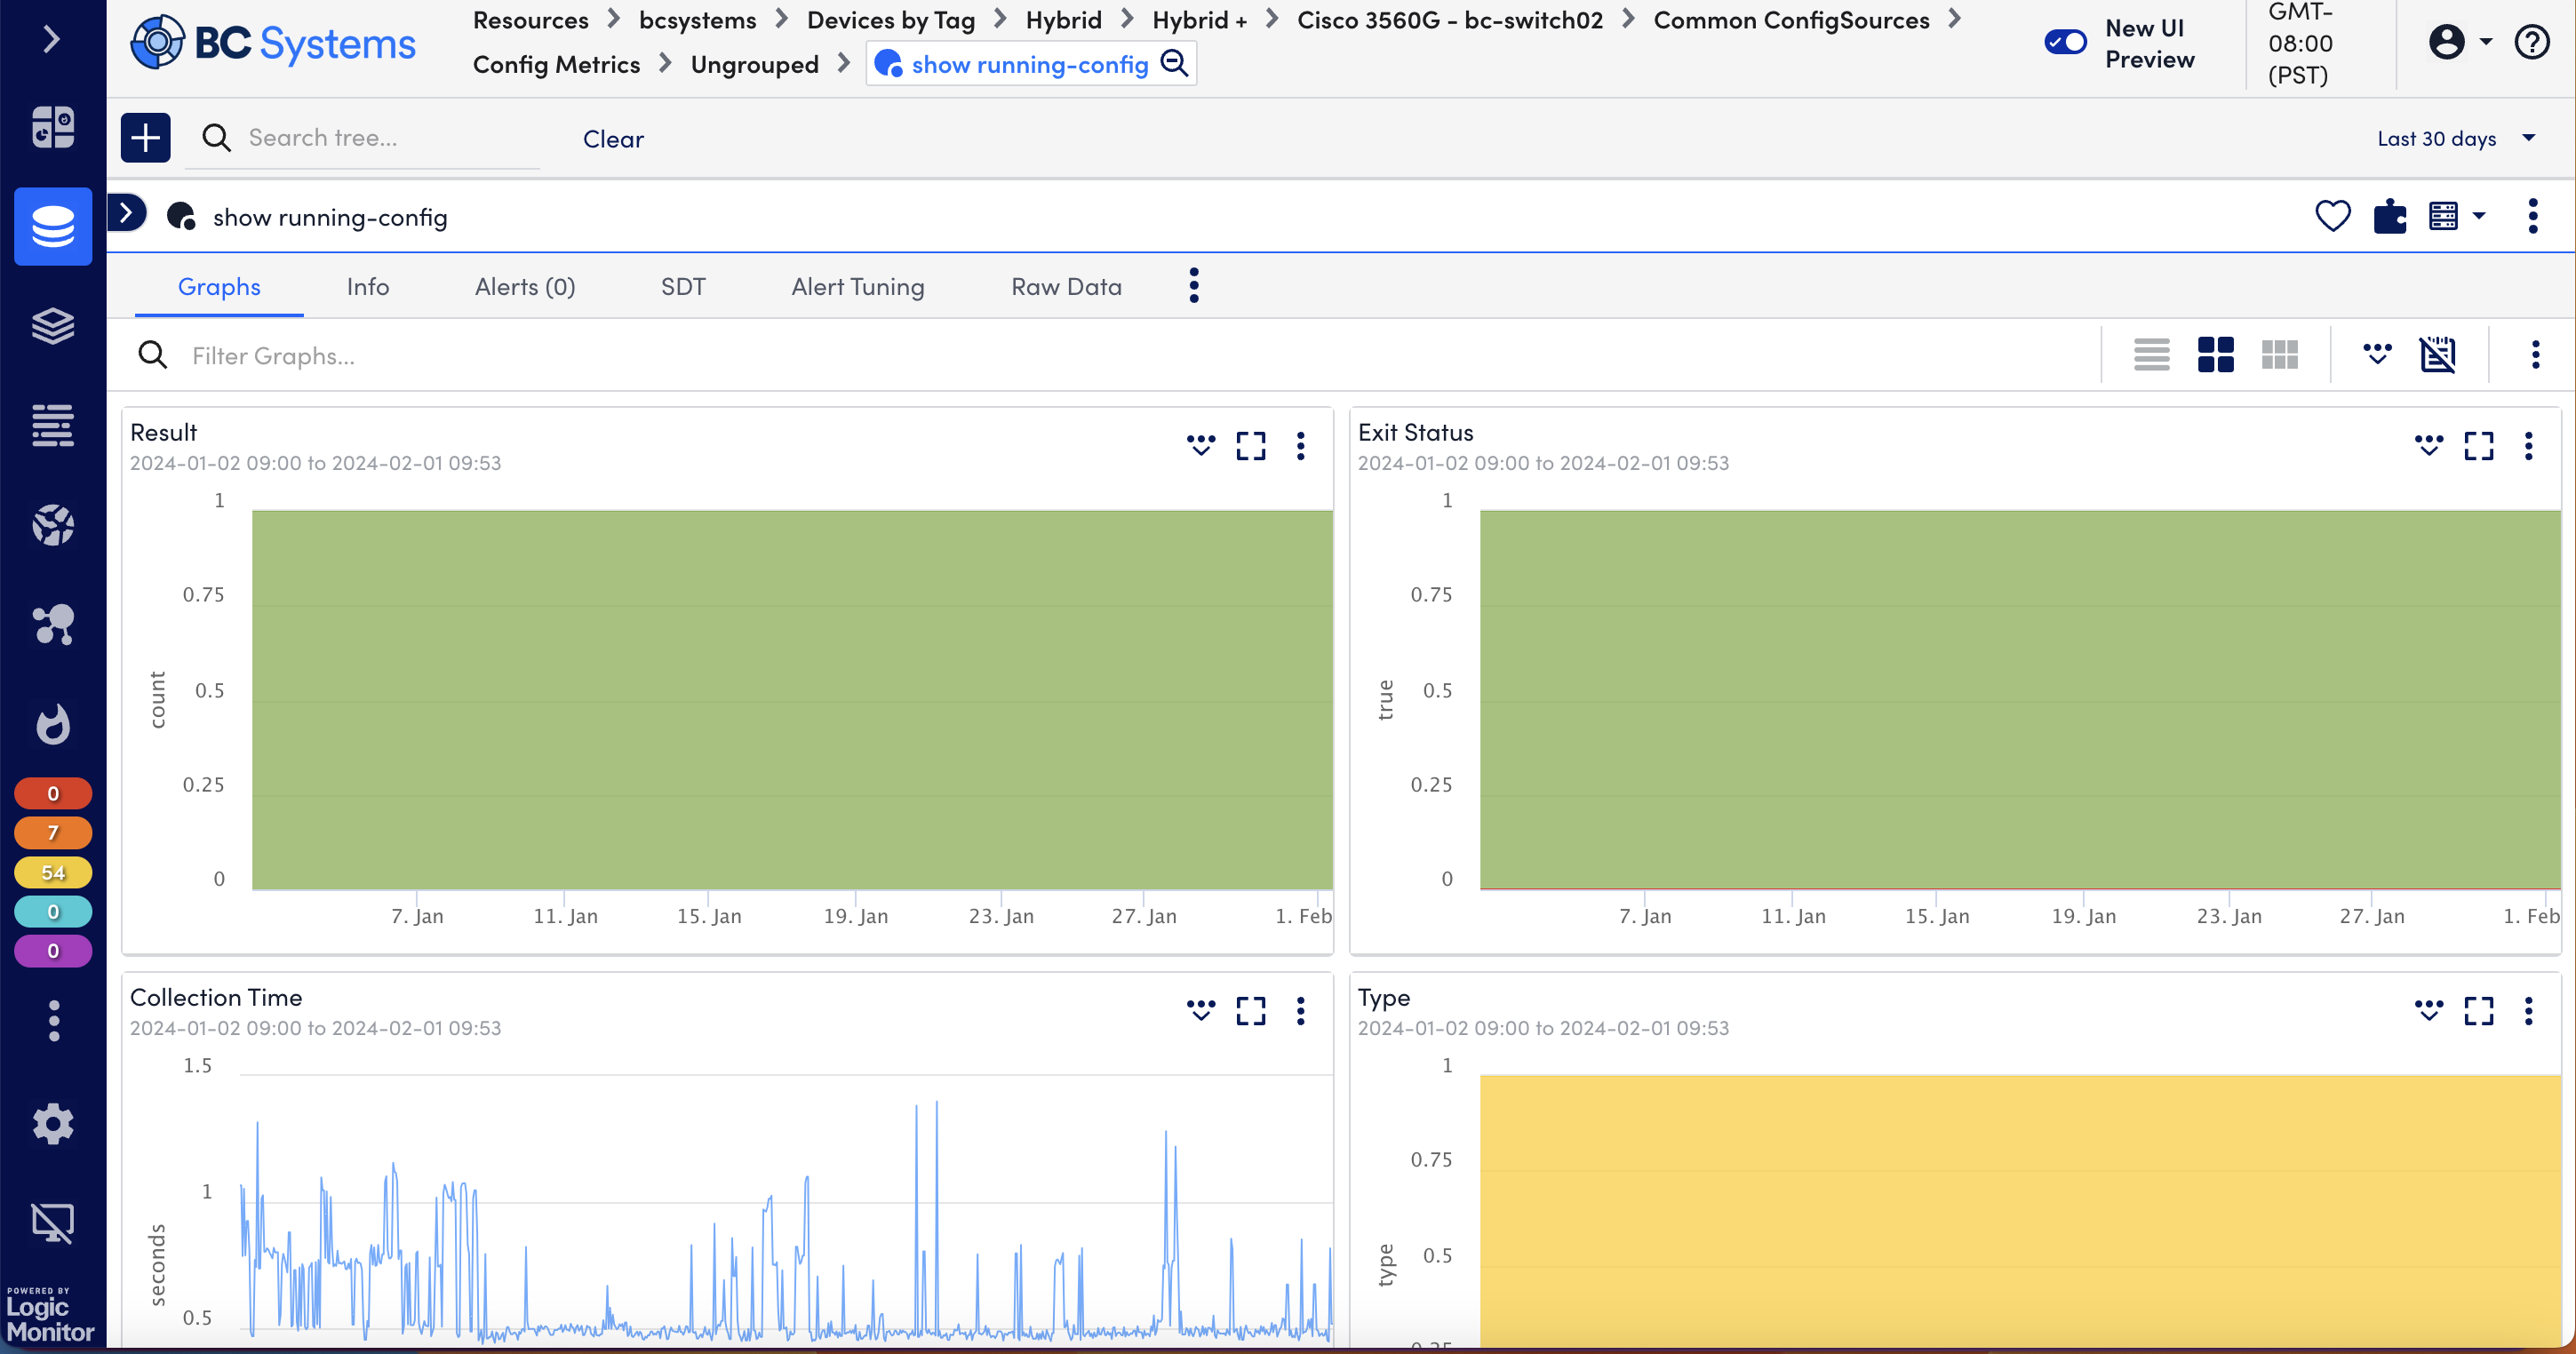
ConfigSources
ConfigChecks
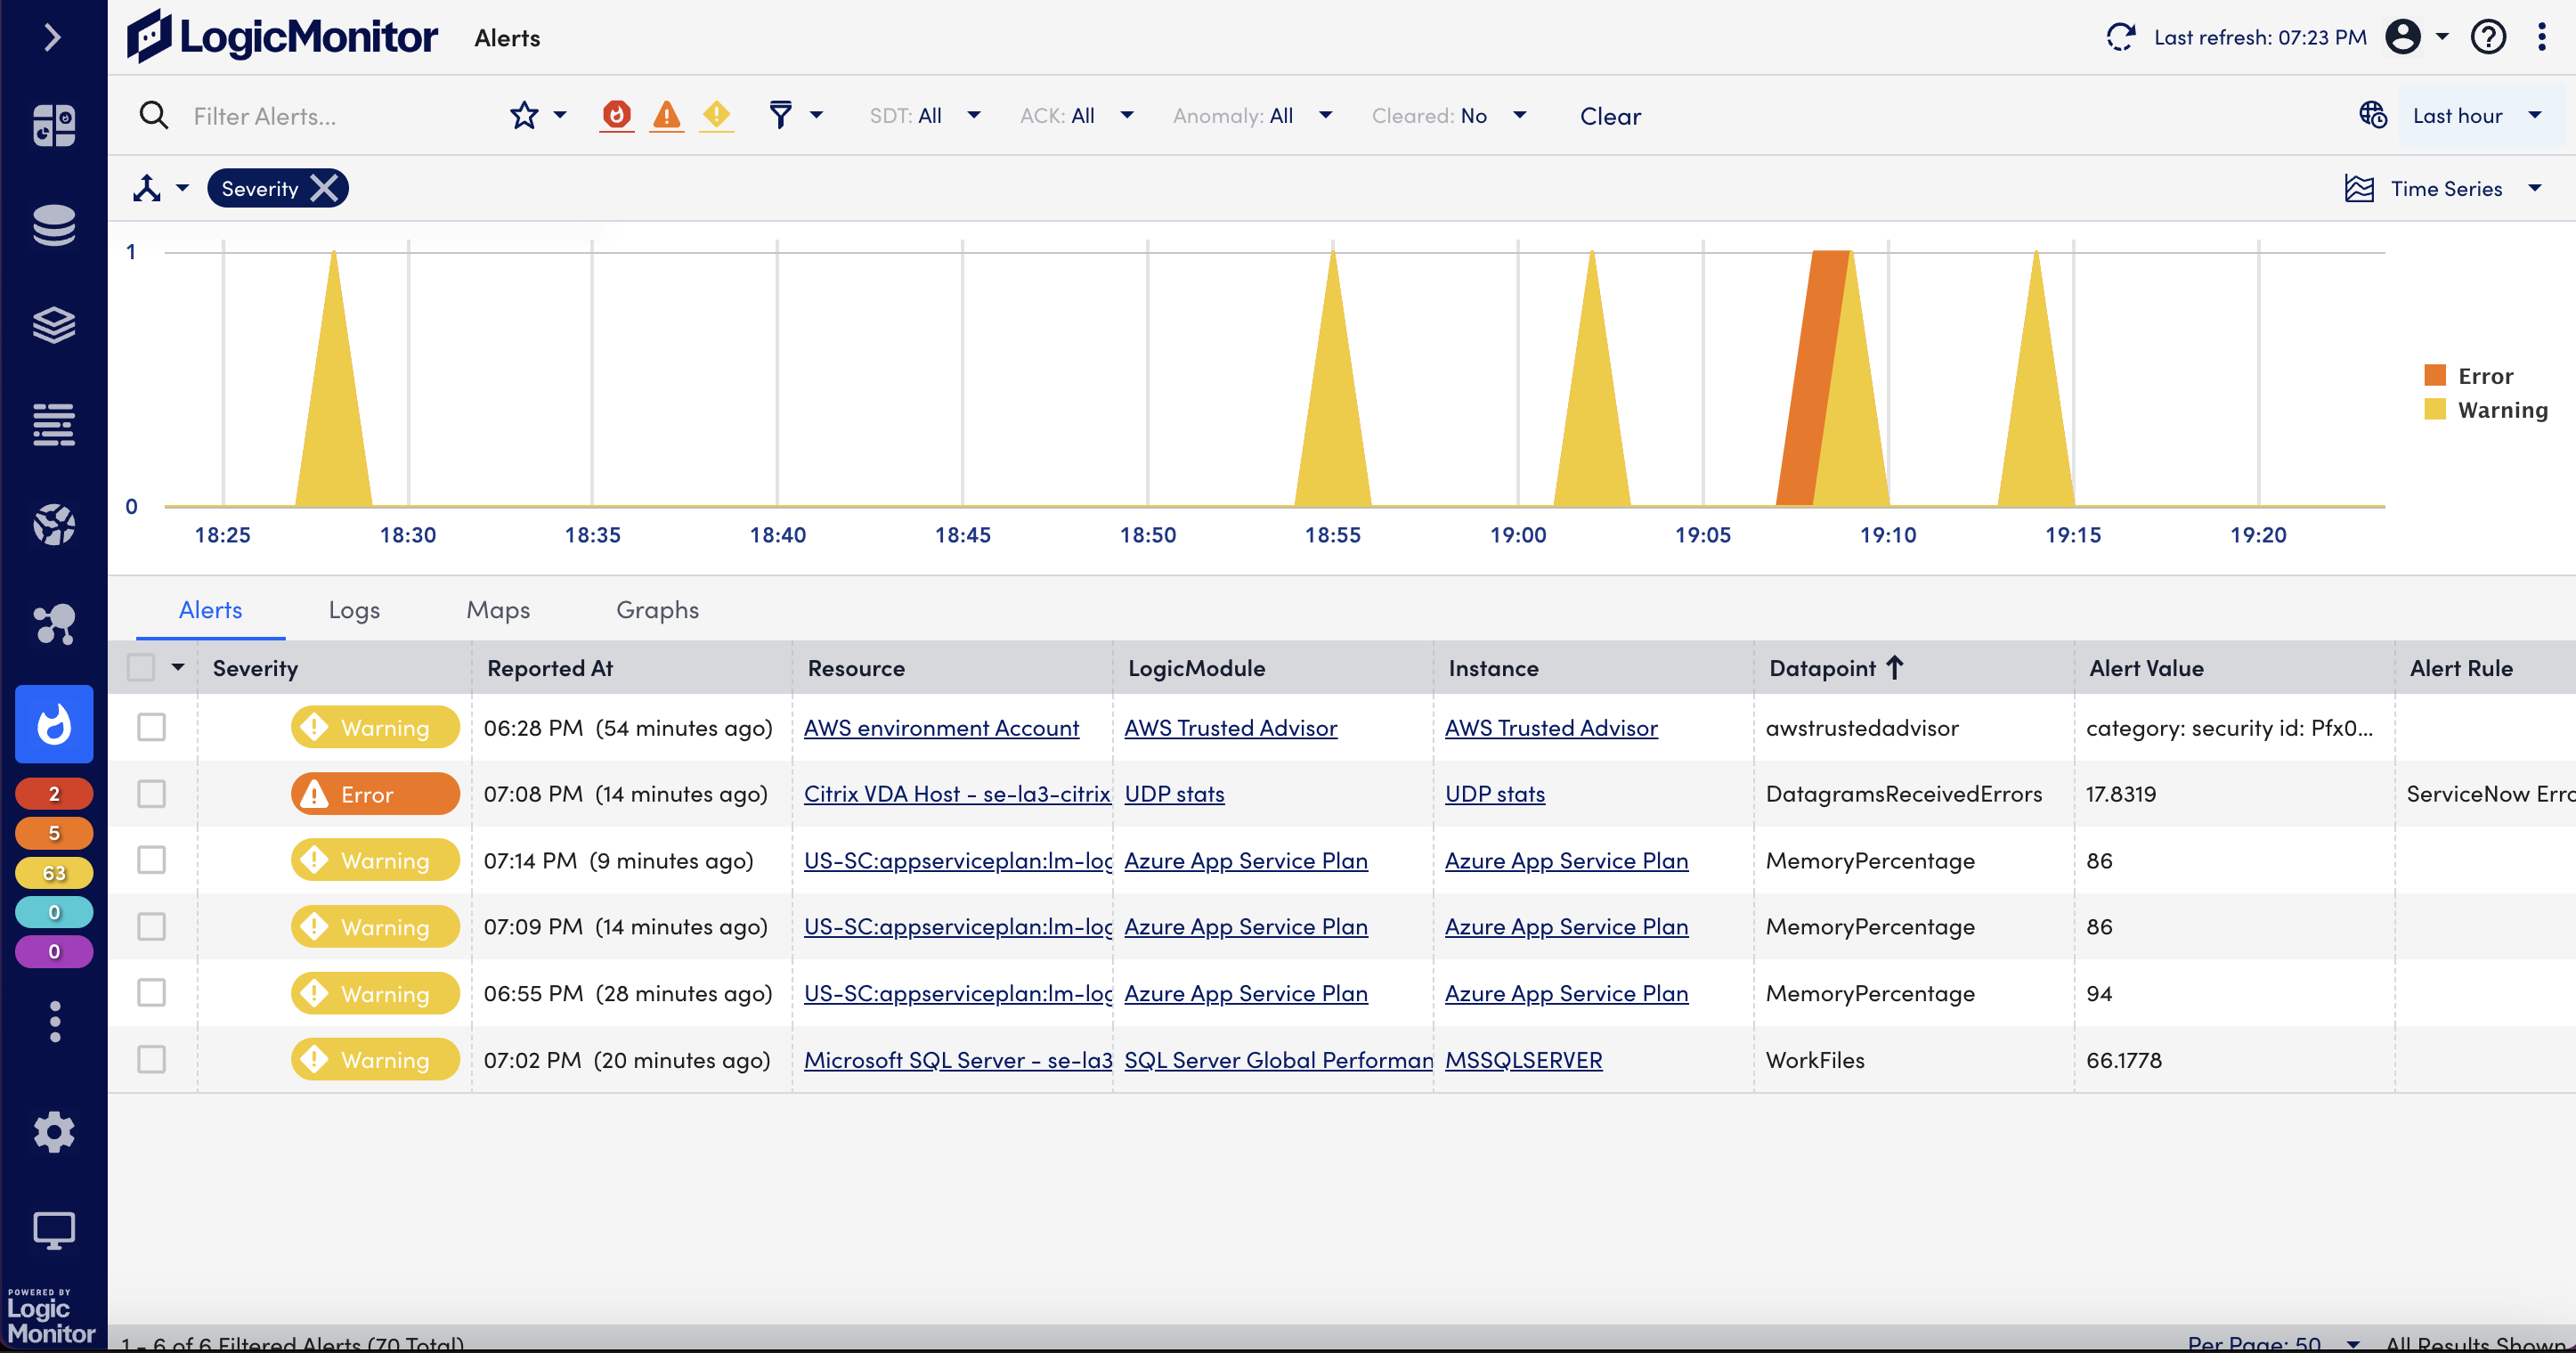
Troubleshooting
LM Config fits with the whole mindset of why iVision uses LogicMonitor in the first place: its flexibility.
GREG LASKEY NETWORK ANALYST/SECURITY, ECUMEN
Configuration Monitoring Benefits
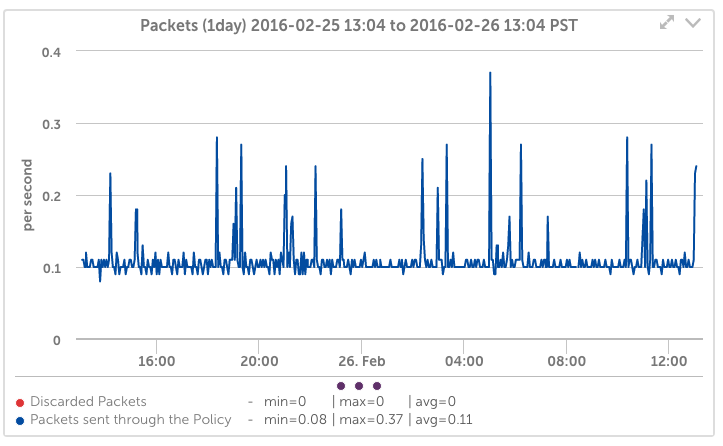
Correlate performance to configuration
In addition to increasing compliance and consolidating tools, putting configuration and infrastructure monitoring in the same platform allows teams to correlate performance data with changes to device configurations.
Enable DevOps with an IaC approach
Alert on configuration changes the same way you alert on performance metrics.
Consolidate tools
Consolidate tools and put configurations in the same window as your infrastructure monitoring.
Eliminate complexity
Maintain standardization and compliance policies even as your business scales in size and complexity.
Streamline development
Flag policy violations when they happen and update configurations on the fly without bringing development to a standstill.
Scale effortlessly
Partner with the only monitoring solution that drives transformation and scales with you. Our configuration monitoring ensures your infrastructure stays healthy as infrastructure complexity grows.
Configuration Monitoring FAQs
- What is LM Config?
A feature which provides configuration file monitoring and storage directly in the LogicMonitor platform using a combination of Active Discovery, change detection, customizable alert checks, and automatic storage of configuration file history.
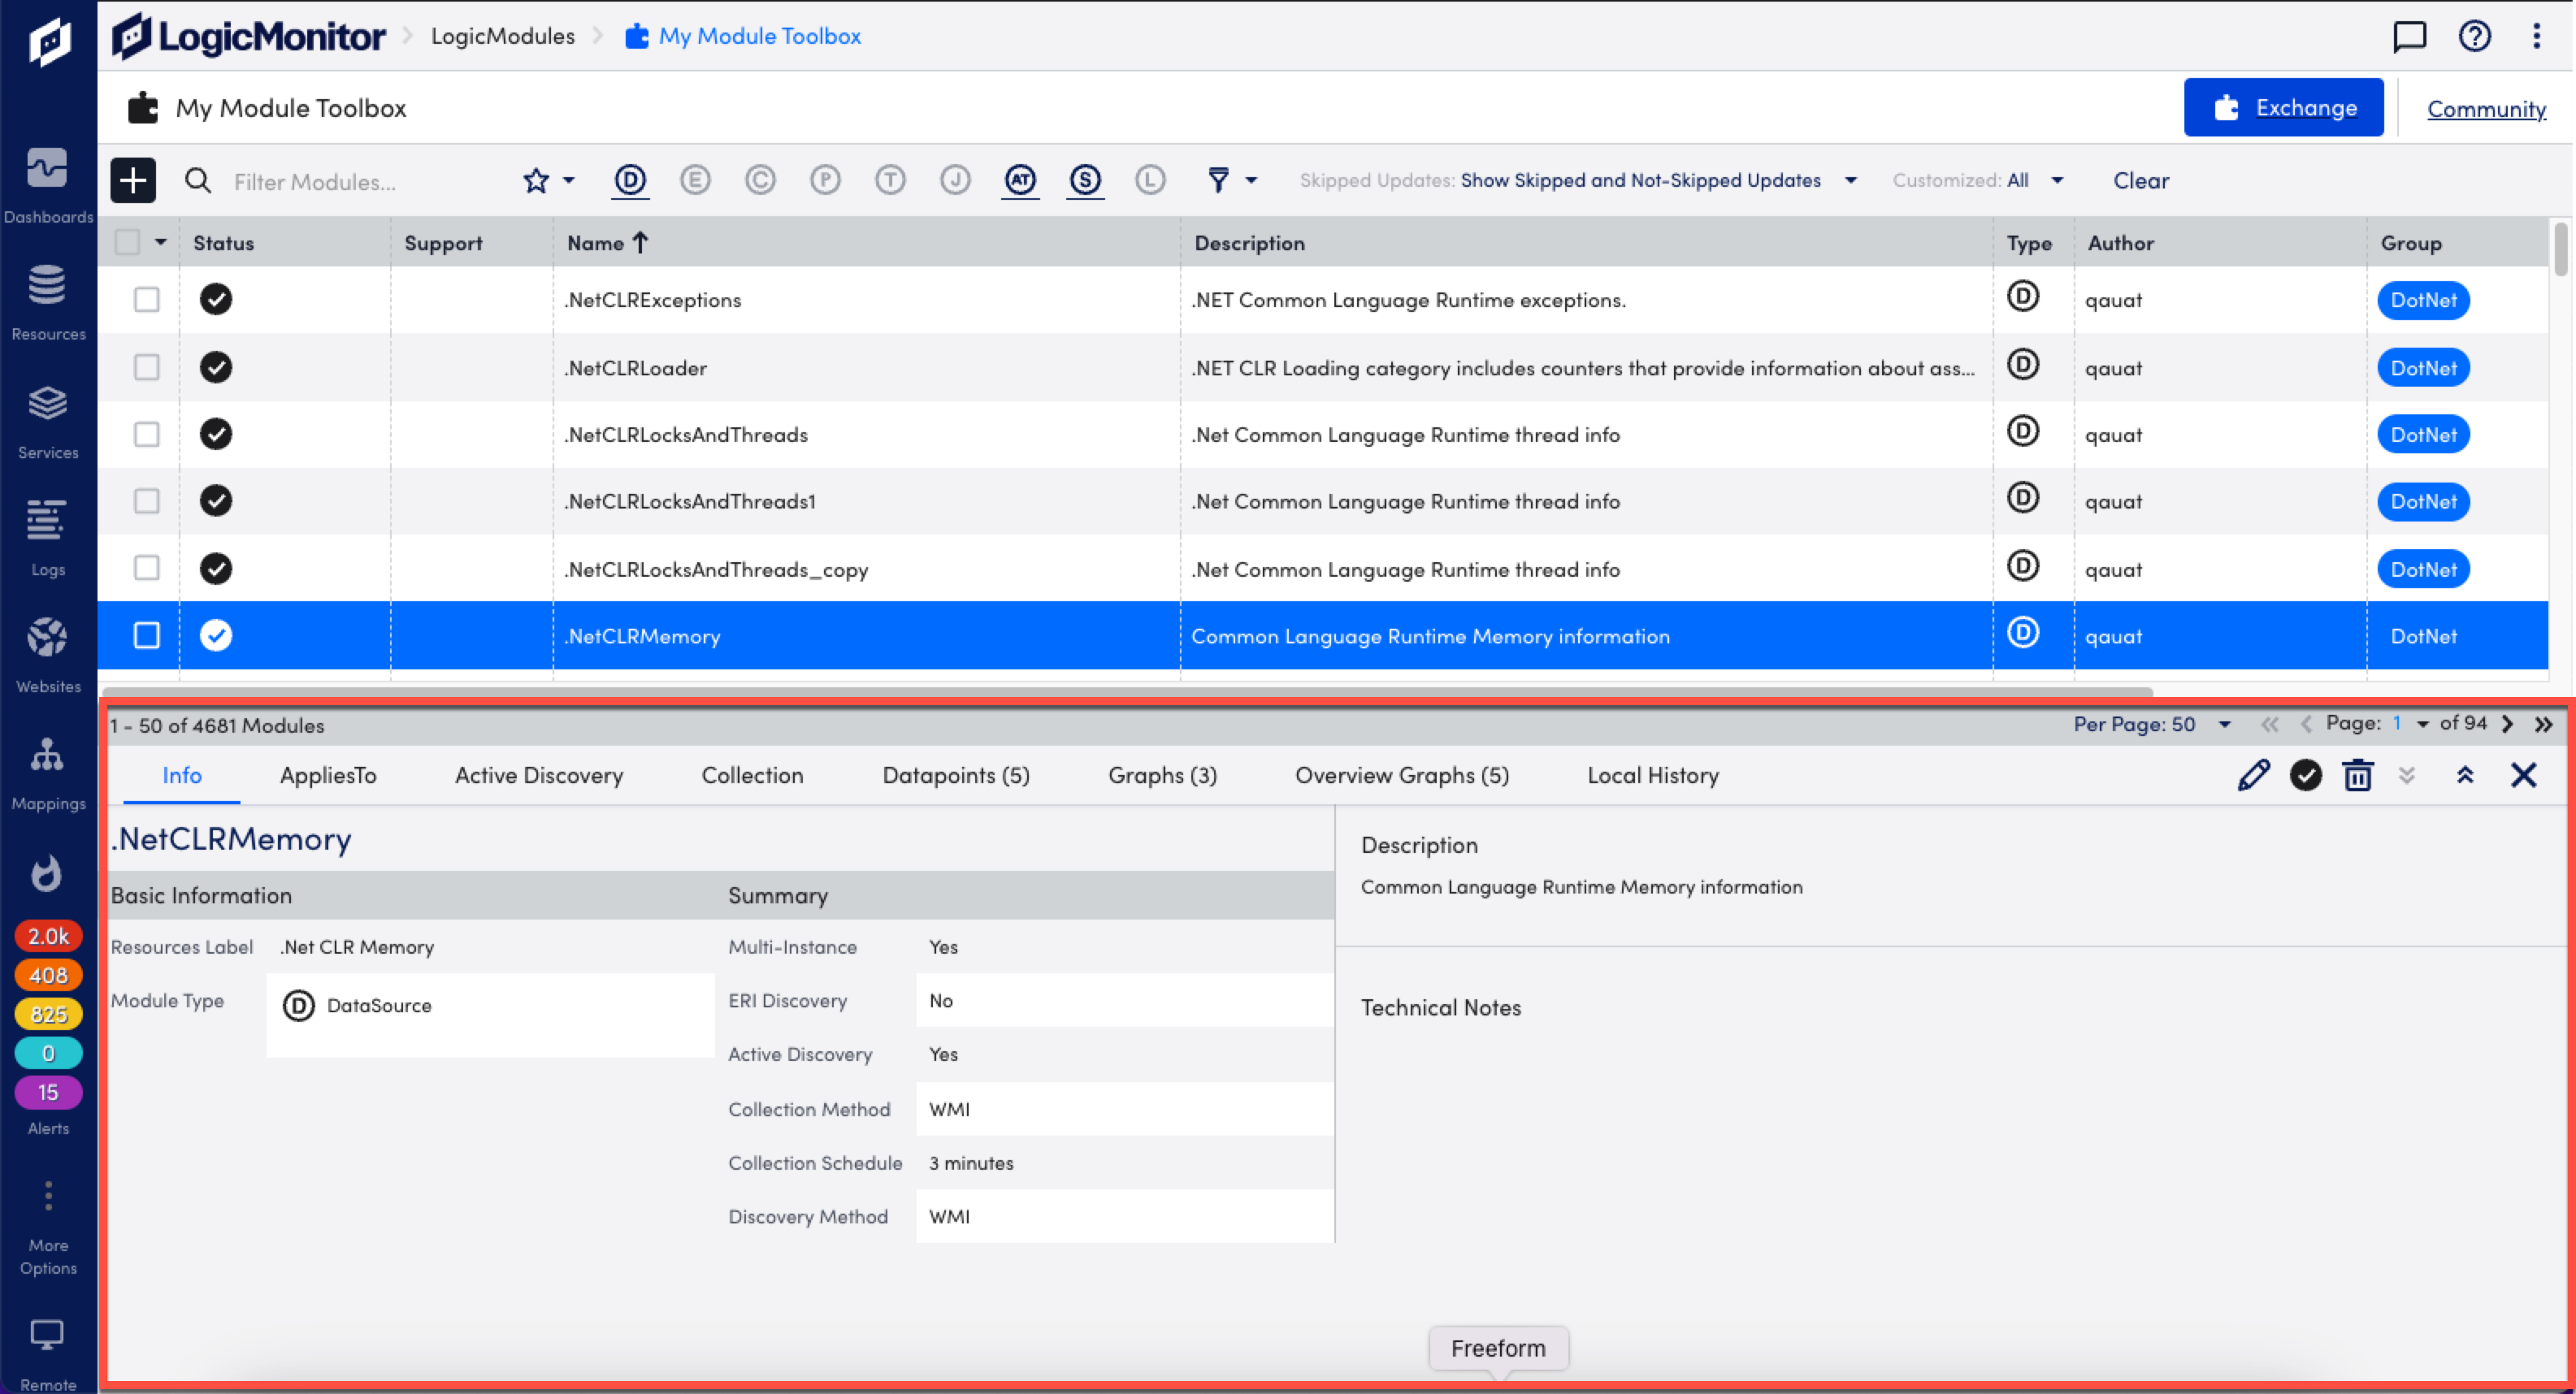
- What are ConfigSources?
ConfigSources define how the LM Collector should retrieve data from a monitored device, as well as which devices should be monitored.
- Why are config files important?
A configuration file tells a device how it should function. These files are often highly customized for a particular application and changes to them can have profound effects on an IT environment. A misconfigured configuration file on a single device can bring down an entire network.
- What kinds of devices use config files?
Primarily network devices such as routers, switches, and firewalls. But also applications like Apache, MySQL, and our own Collector.
- What Is Configuration Management?
A systems engineering process for establishing and maintaining consistency of a product’s performance, functional, and physical attributes with its requirements, design, and operational information throughout its life.
Sign up for your free 14-day trial
Go beyond website monitoring with full access to the LogicMonitor platform. Comprehensive monitoring and alerting for unlimited devices and the full suite of core platform features.
Features include:
- AIOps early warning system
- Automated device discovery
- Alerting and escalation chains
- 2000+ monitoring integrations
- 100+ pre-built dashboards
- Comprehensive training modules
- 24/7 chat support
Sign up today
Related Solutions


More resources