
One of our long time customers, Appfolio, who makes great SaaS property management software, asked how they could use LogicMonitor to monitor the size of some files across their fleet of Linux servers. A simple request, but not as simple as one might hope. Why not? LogicMonitor usually uses SNMP to monitor Linux servers, as that way there is no need for extra software to be installed on any server. (It should be noted that some people deploy LogicMonitor collectors as agents, deploying one per server. In this case, you could use a script based datasource to simply run ‘ls’ on arbitrary files – but that’s for a different blog entry.) While SNMP has many defined OIDs (a fancy way of saying questions that can be asked and answered), there is no defined OID for “how big is arbitrary file X?” Which means that by default, there is no way to remotely query a system, using SNMP, to determine a file size.
Extending SNMPd
Luckily, the Net-SNMP daemon used on virtually all Linux distributions can be extended to provide this (and many other kinds) of functionality. For example, to monitor the size of the /var/spool/rsyslog file, simply add a line such as:
extend lm-rsyslog-size /usr/bin/du /var/spool/rsyslog
to snmpd.conf, and restart snmpd. This tells the SNMP daemon to run the specified commands when certain OIDs are queried, and return the results. This will create some new OID entries under the tree .1.3.6.1.4.1.8072.1.3.2, with big long dotted decimal indexes that make it hard to know what the object is – especially if you have multiple extend commands in snmpd.conf. However, with a walk of .1.3.6.1.4.1.8072.1.3.2.2.1.2, you can see the commands that have been added as snmp extensions:
snmpwalk servername .1.3.6.1.4.1.8072.1.3.2.2.1.2
 Walking OID .1.3.6.1.4.1.8072.1.3.2.2.1.2  version=v2c, timeout=3 seconds:
 14.114.97.98.98.105.116.109.113.45.114.101.97.100.121 => /usr/sbin/rabbitmqctl
 15.108.109.45.114.115.121.115.108.111.103.45.115.105.122.101 => /usr/bin/du
So the index for the du command we added is 15.108.109.45.114.115.121.115.108.111.103.45.115.105.122.101 – which, the astute among you will notice, happens to be the octet string representation of “lm-rsyslog-size” (although with one prior character.) So now we can query either the table .1.3.6.1.4.1.8072.1.3.2.3.1.1 (nsExtendOutput1Line), which gives the first line of the output of the command when run, or .1.3.6.1.4.1.8072.1.3.2.3.1.2, which gives the full (multi-line) output, using the index we figured out above. In this case, the output of ‘du’ against a single file is a single line, so the OIDs are equivalent. e.g.
>>!snmpget servername .1.3.6.1.4.1.8072.1.3.2.3.1.1.15.108.109.45.114.115.121.115.108.111.103.45.115.105.122.101
Getting OIDs from host=servername, version=v2c, timeout=3 seconds: .1.3.6.1.4.1.8072.1.3.2.3.1.1.15.108.109. 45.114.115.121.115.108.111.103.45.115.105.122.101 => 1025360 /var/spool/rsyslog
Getting the data into LogicMonitor
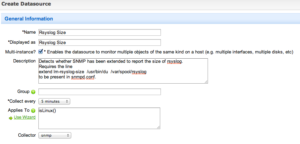
Ok, we have extended snmpd so we can get the data we want via SNMP. (And if we are clever, we’ve pushed this out to all our systems via our IT automation tool: puppet, chef, Ansible, or what-have-you.) How do we monitor and alert on this? We create a datasource. From Settings…Datasources, click New Datasource. Set the General Information section:
Set the Active Discovery Section as below:
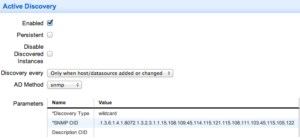
“Wait”, I hear you ask. “Why are we using Active Discovery when this snmp extension is only reporting the size of a single file?” Well – we can’t assume every Linux server will respond to this OID, which you just created. So, we test for it’s presence in ActiveDiscovery. If it responds, we’ll monitor it. If not, we won’t create the instance. (Note that the index we add in the discovery OID is one number shorter than the index we found above, as Active Discovery always does an SNMP walk, not a get, so it wants to find at least one entry in the walked result.)
Now we just need to add a single Normal Datapoint to the datasource:
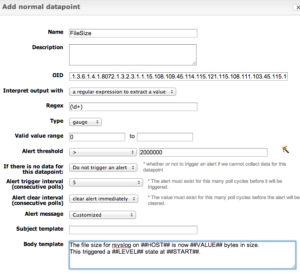
Because the output of the command is both the size of the file and the file path, we use a regular expression capture group to extract the digits at the start. Save, and we are done. You can also add a graph to track the file size over time, etc, or add additional thresholds for error and critical states, etc. All the usual LogicMonitor goodness.
Want to see more? Follow us here:
On Facebook
On Twitter
On LinkedIn
Or, e-mail us @ [email protected]