
Infrastructure Monitoring
Comprehensive infrastructure monitoring with contextual visibility into your ever-expanding and dynamic IT landscape. Experience predictive insights and intelligent troubleshooting to drive efficiency, increase productivity, and reduce risk for maximum enterprise growth and transformation.
Out-of-the-box infrastructure monitoring for industry-leading solutions, including:


Predictive infrastructure insights to reduce downtime
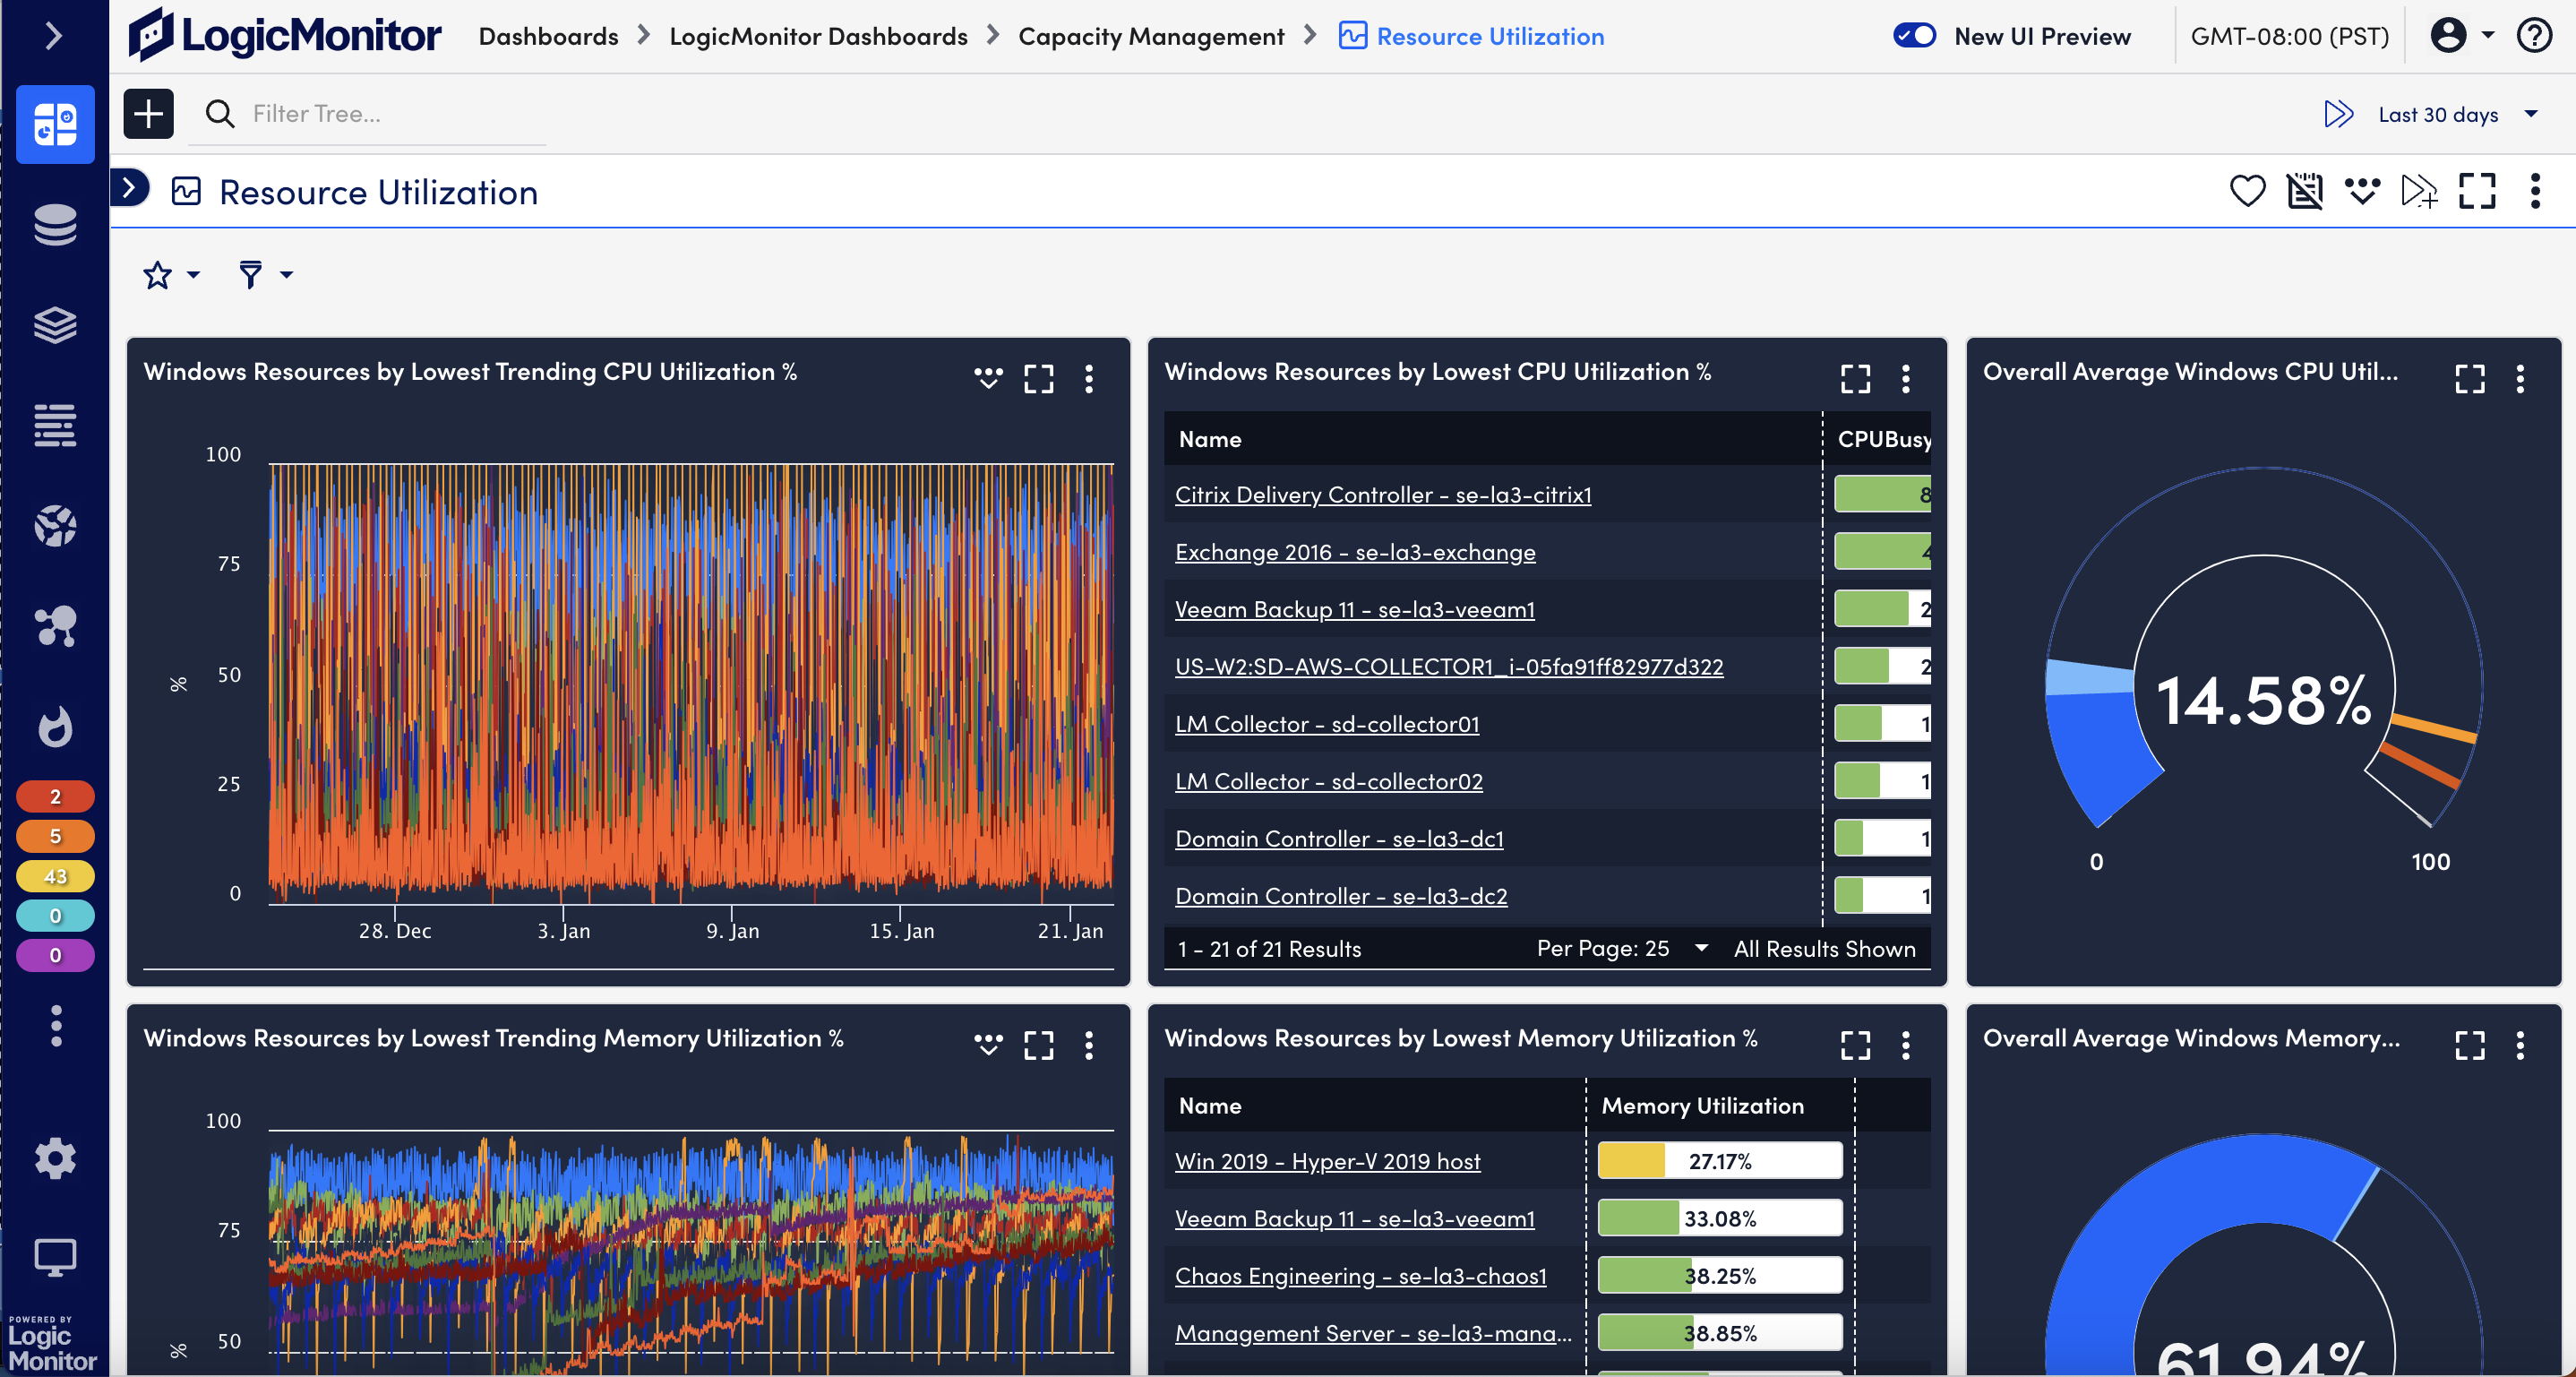
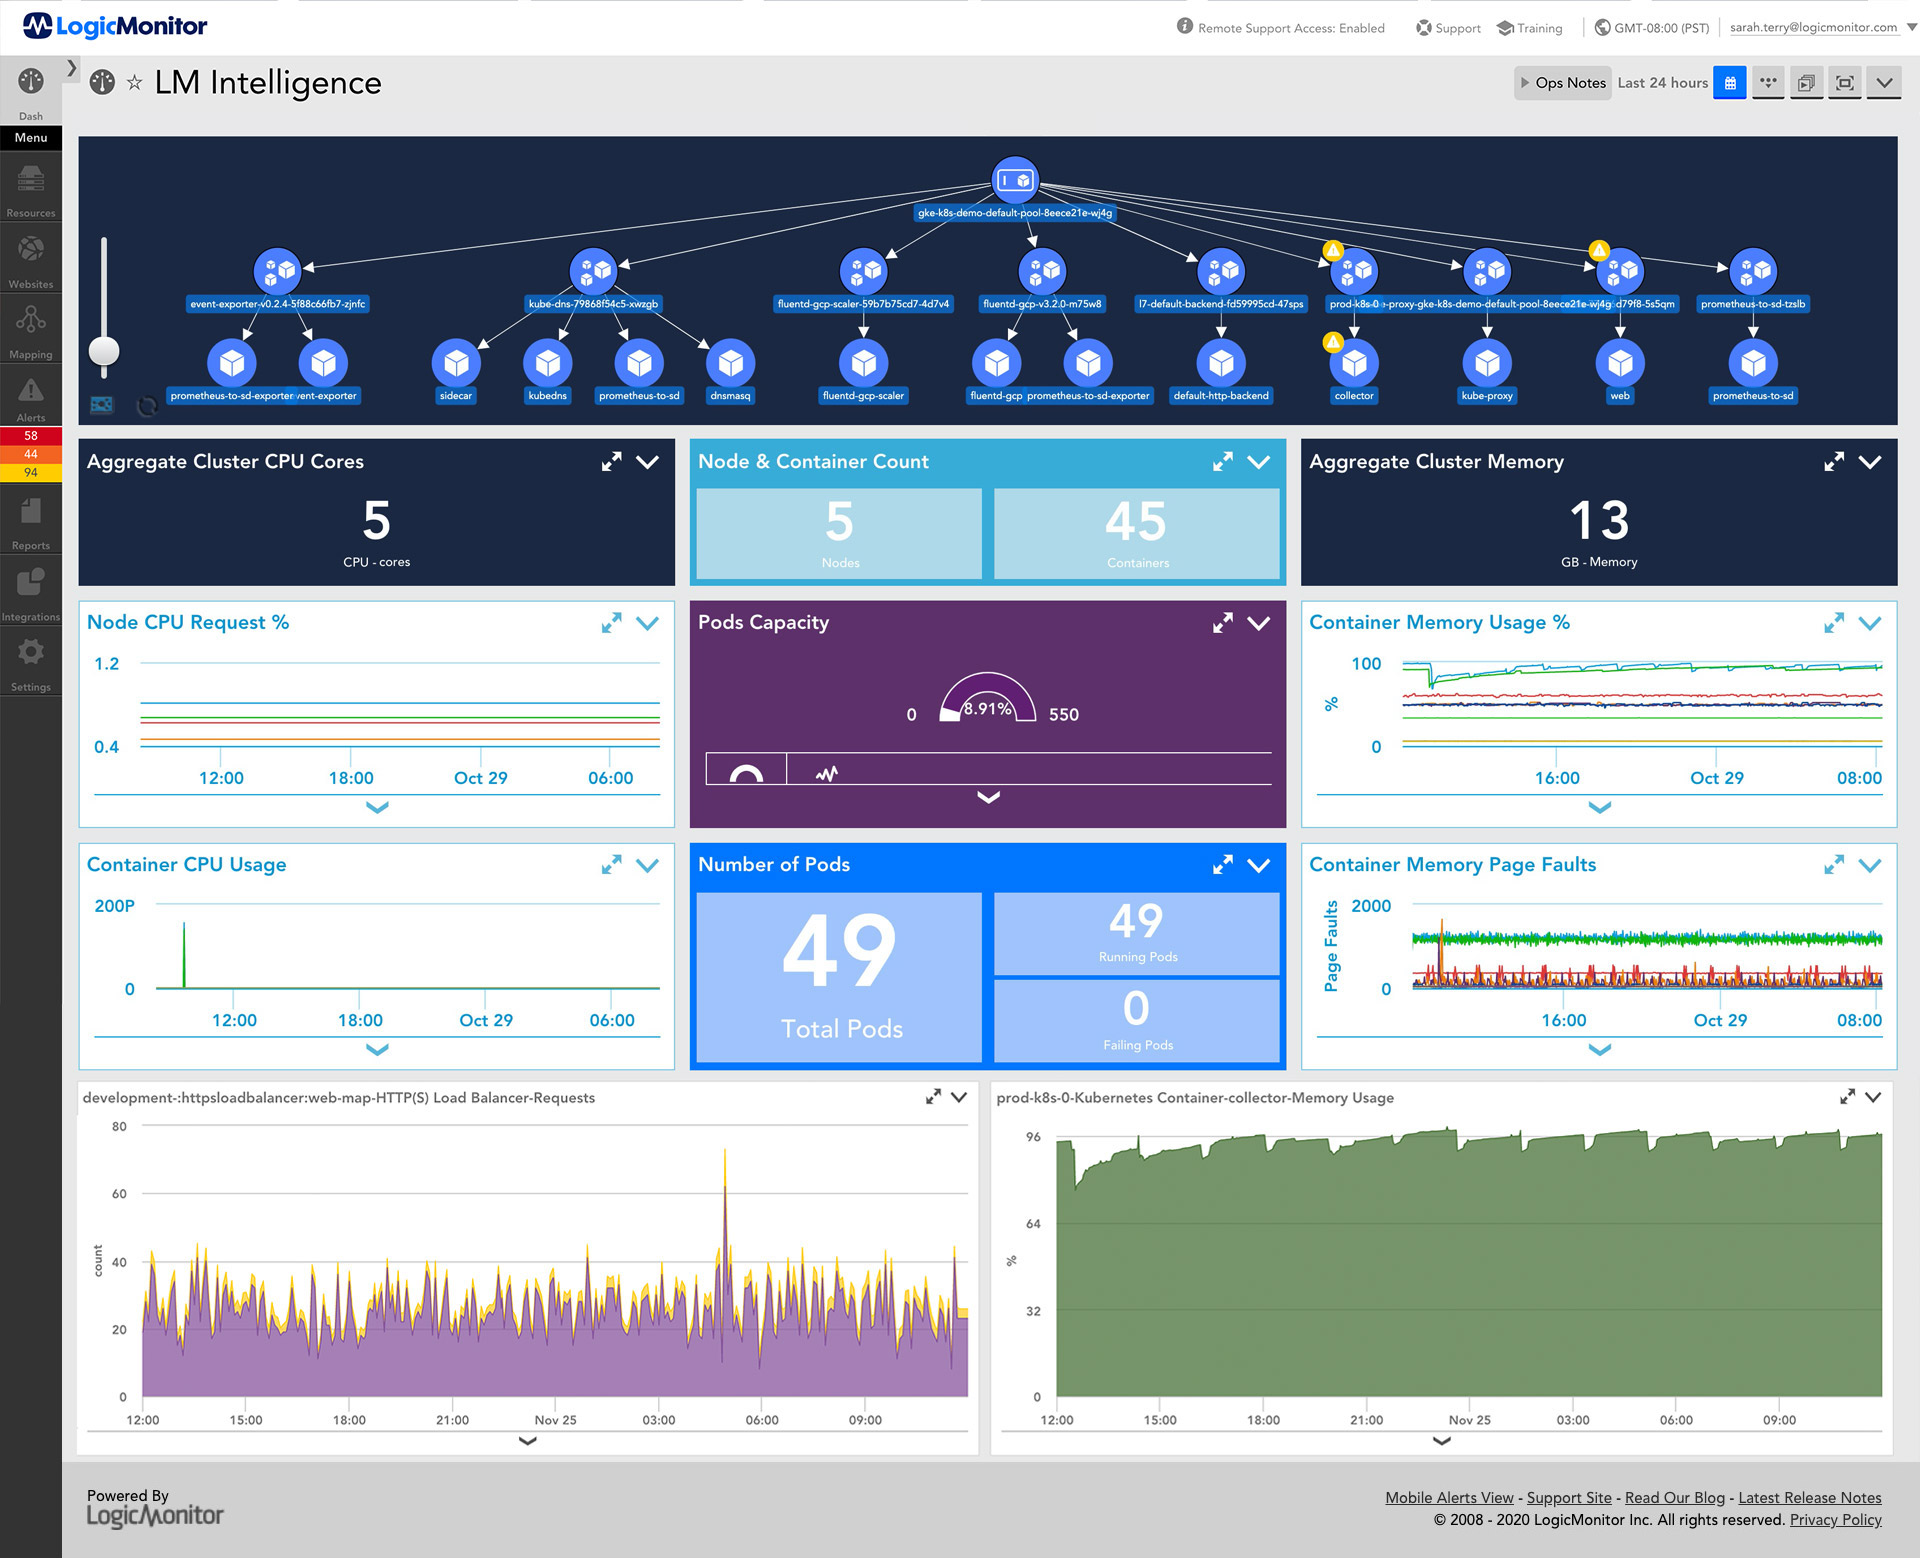
Experience comprehensive visibility into infrastructure topology, availability, and performance, with correlation across dynamic IT infrastructure devices and resources. LogicMonitor is easier, faster, and lighter touch than alternatives, accelerating time to value. Automatically discover resources, collect data, and surface insightful alerts and dashboards/reports for proactive out-of-the-box monitoring across 2000+ hybrid technologies, and empower your engineers with built-in best practices, powerful product documentation, world-class tech support, and a customer community.
Consolidate monitoring tools with a single platform
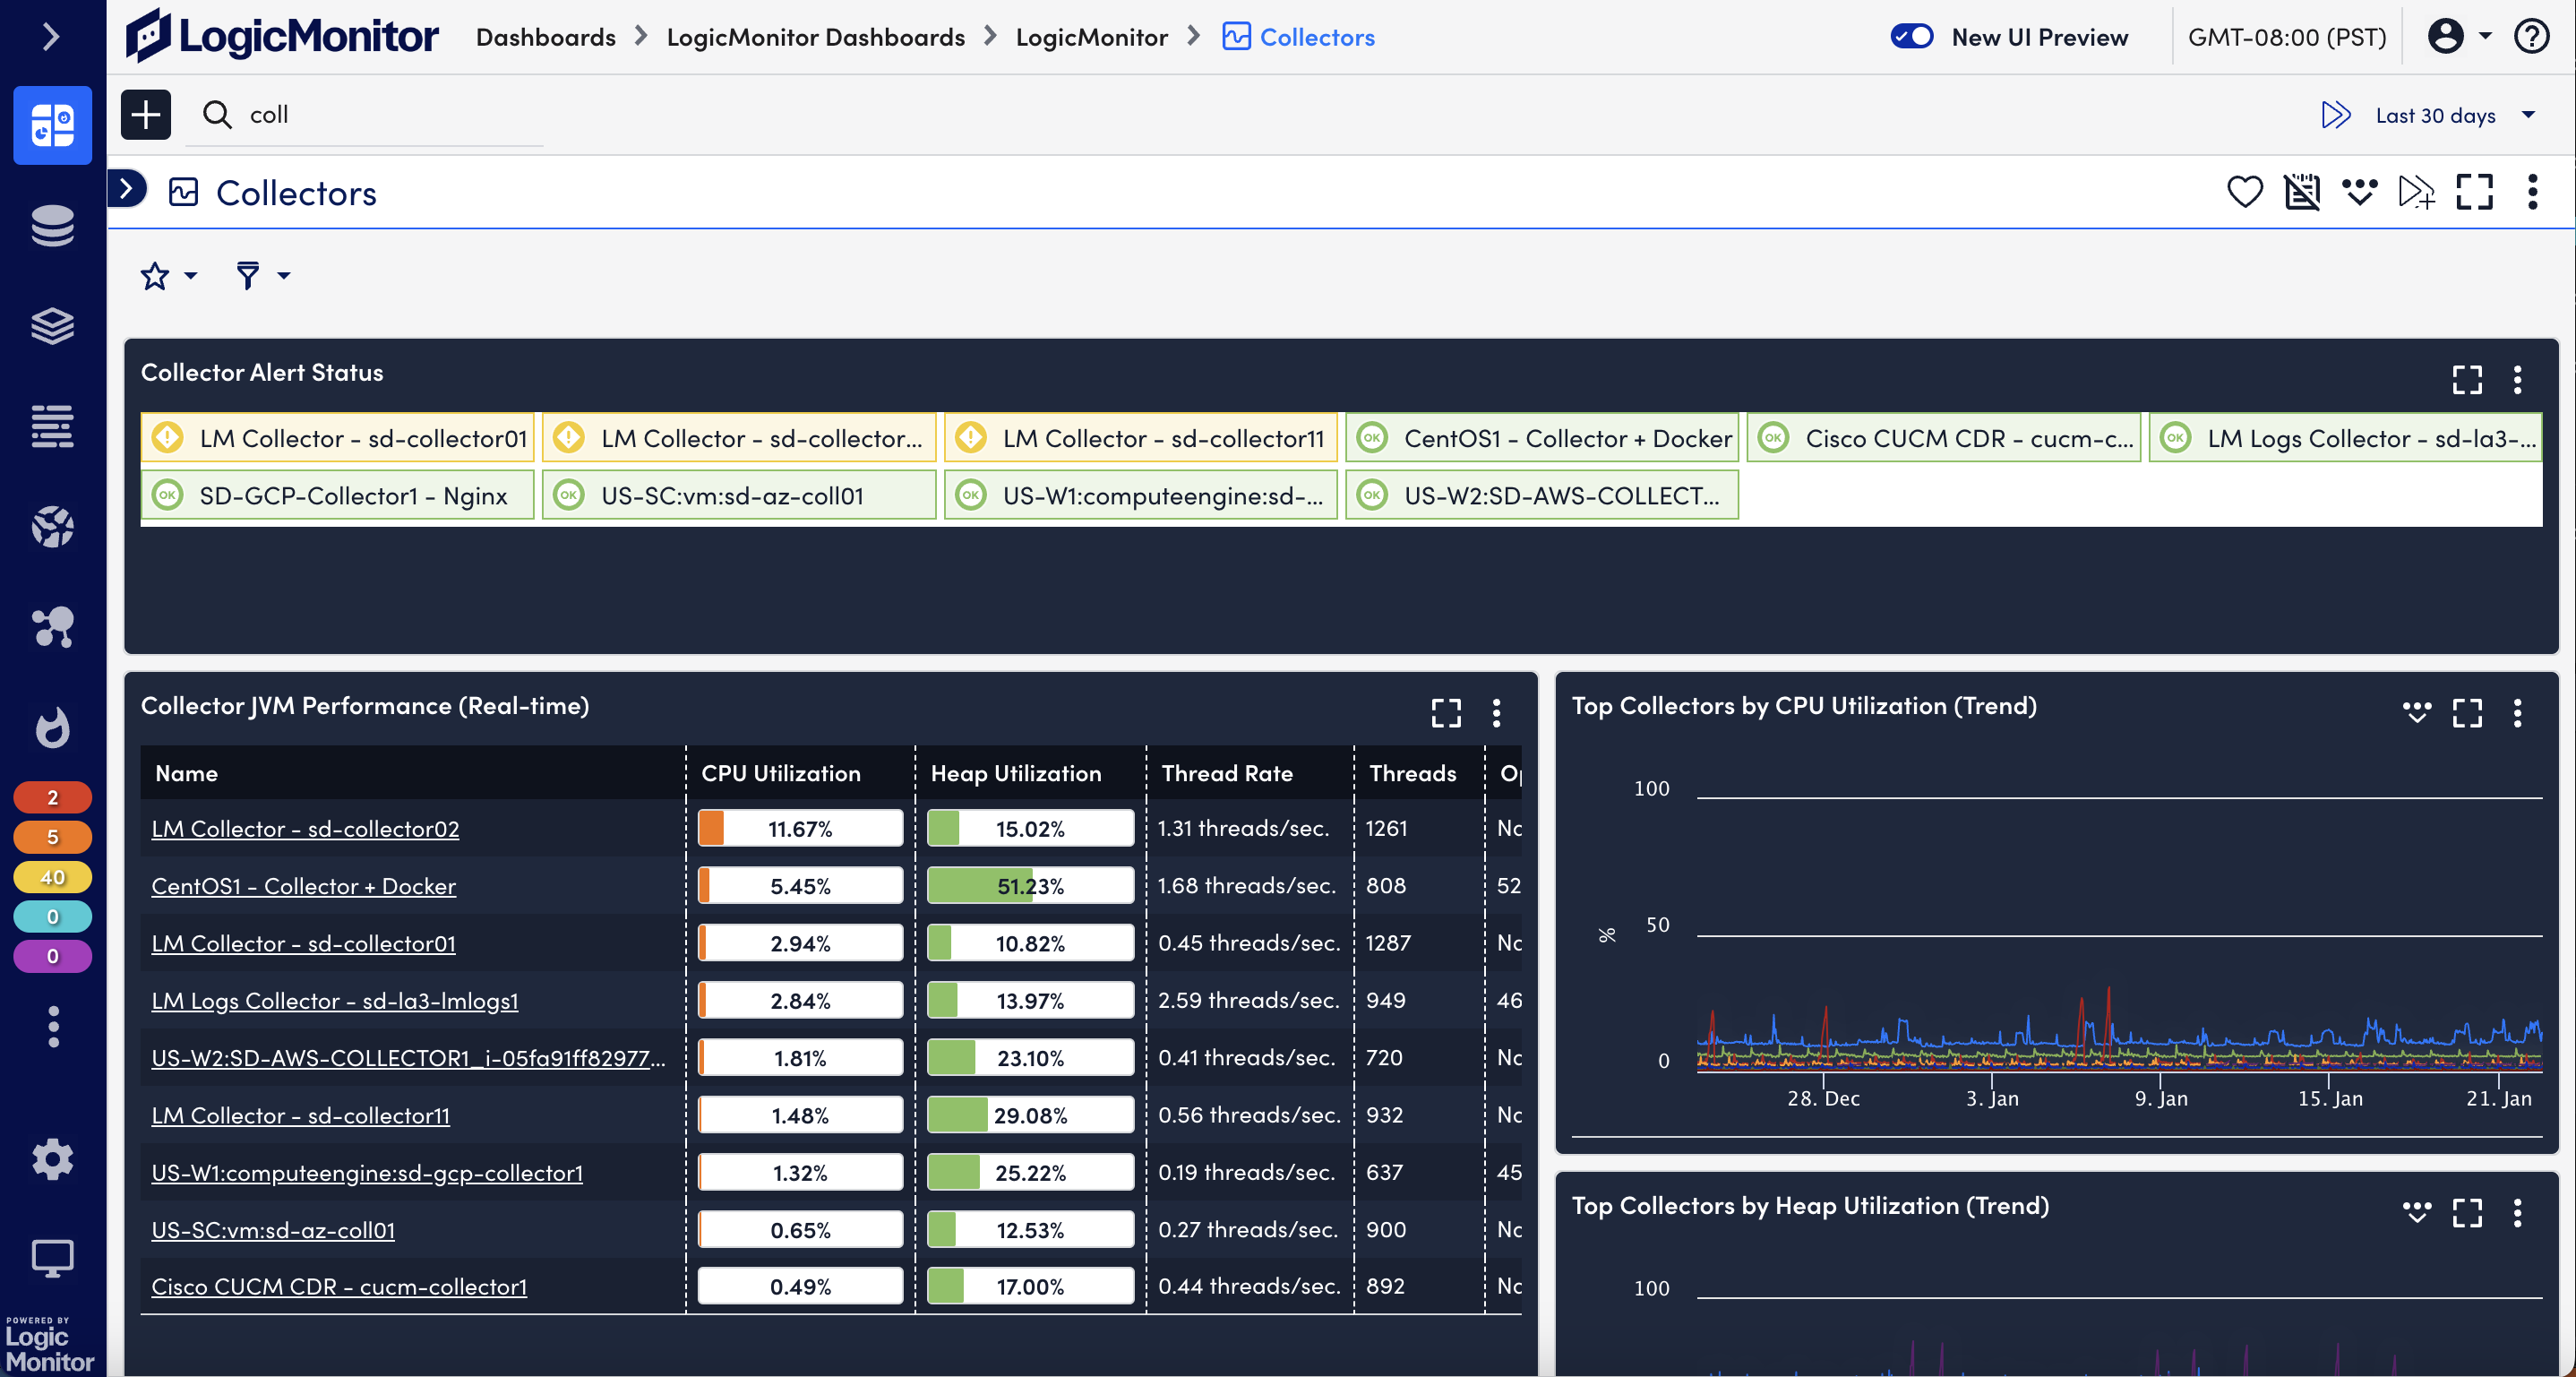
- Agentless collectors automatically discover new devices and configuration changes for monitoring, alerting, and graphing
- Automatically correlate data to provide answers on how to model, avoid issues, and optimize your IT environment
- Dynamic alert thresholds remove noise; workflows and escalation chains are tailored to your environment
- Leverage prebuilt workflow and monitoring integrations and templates
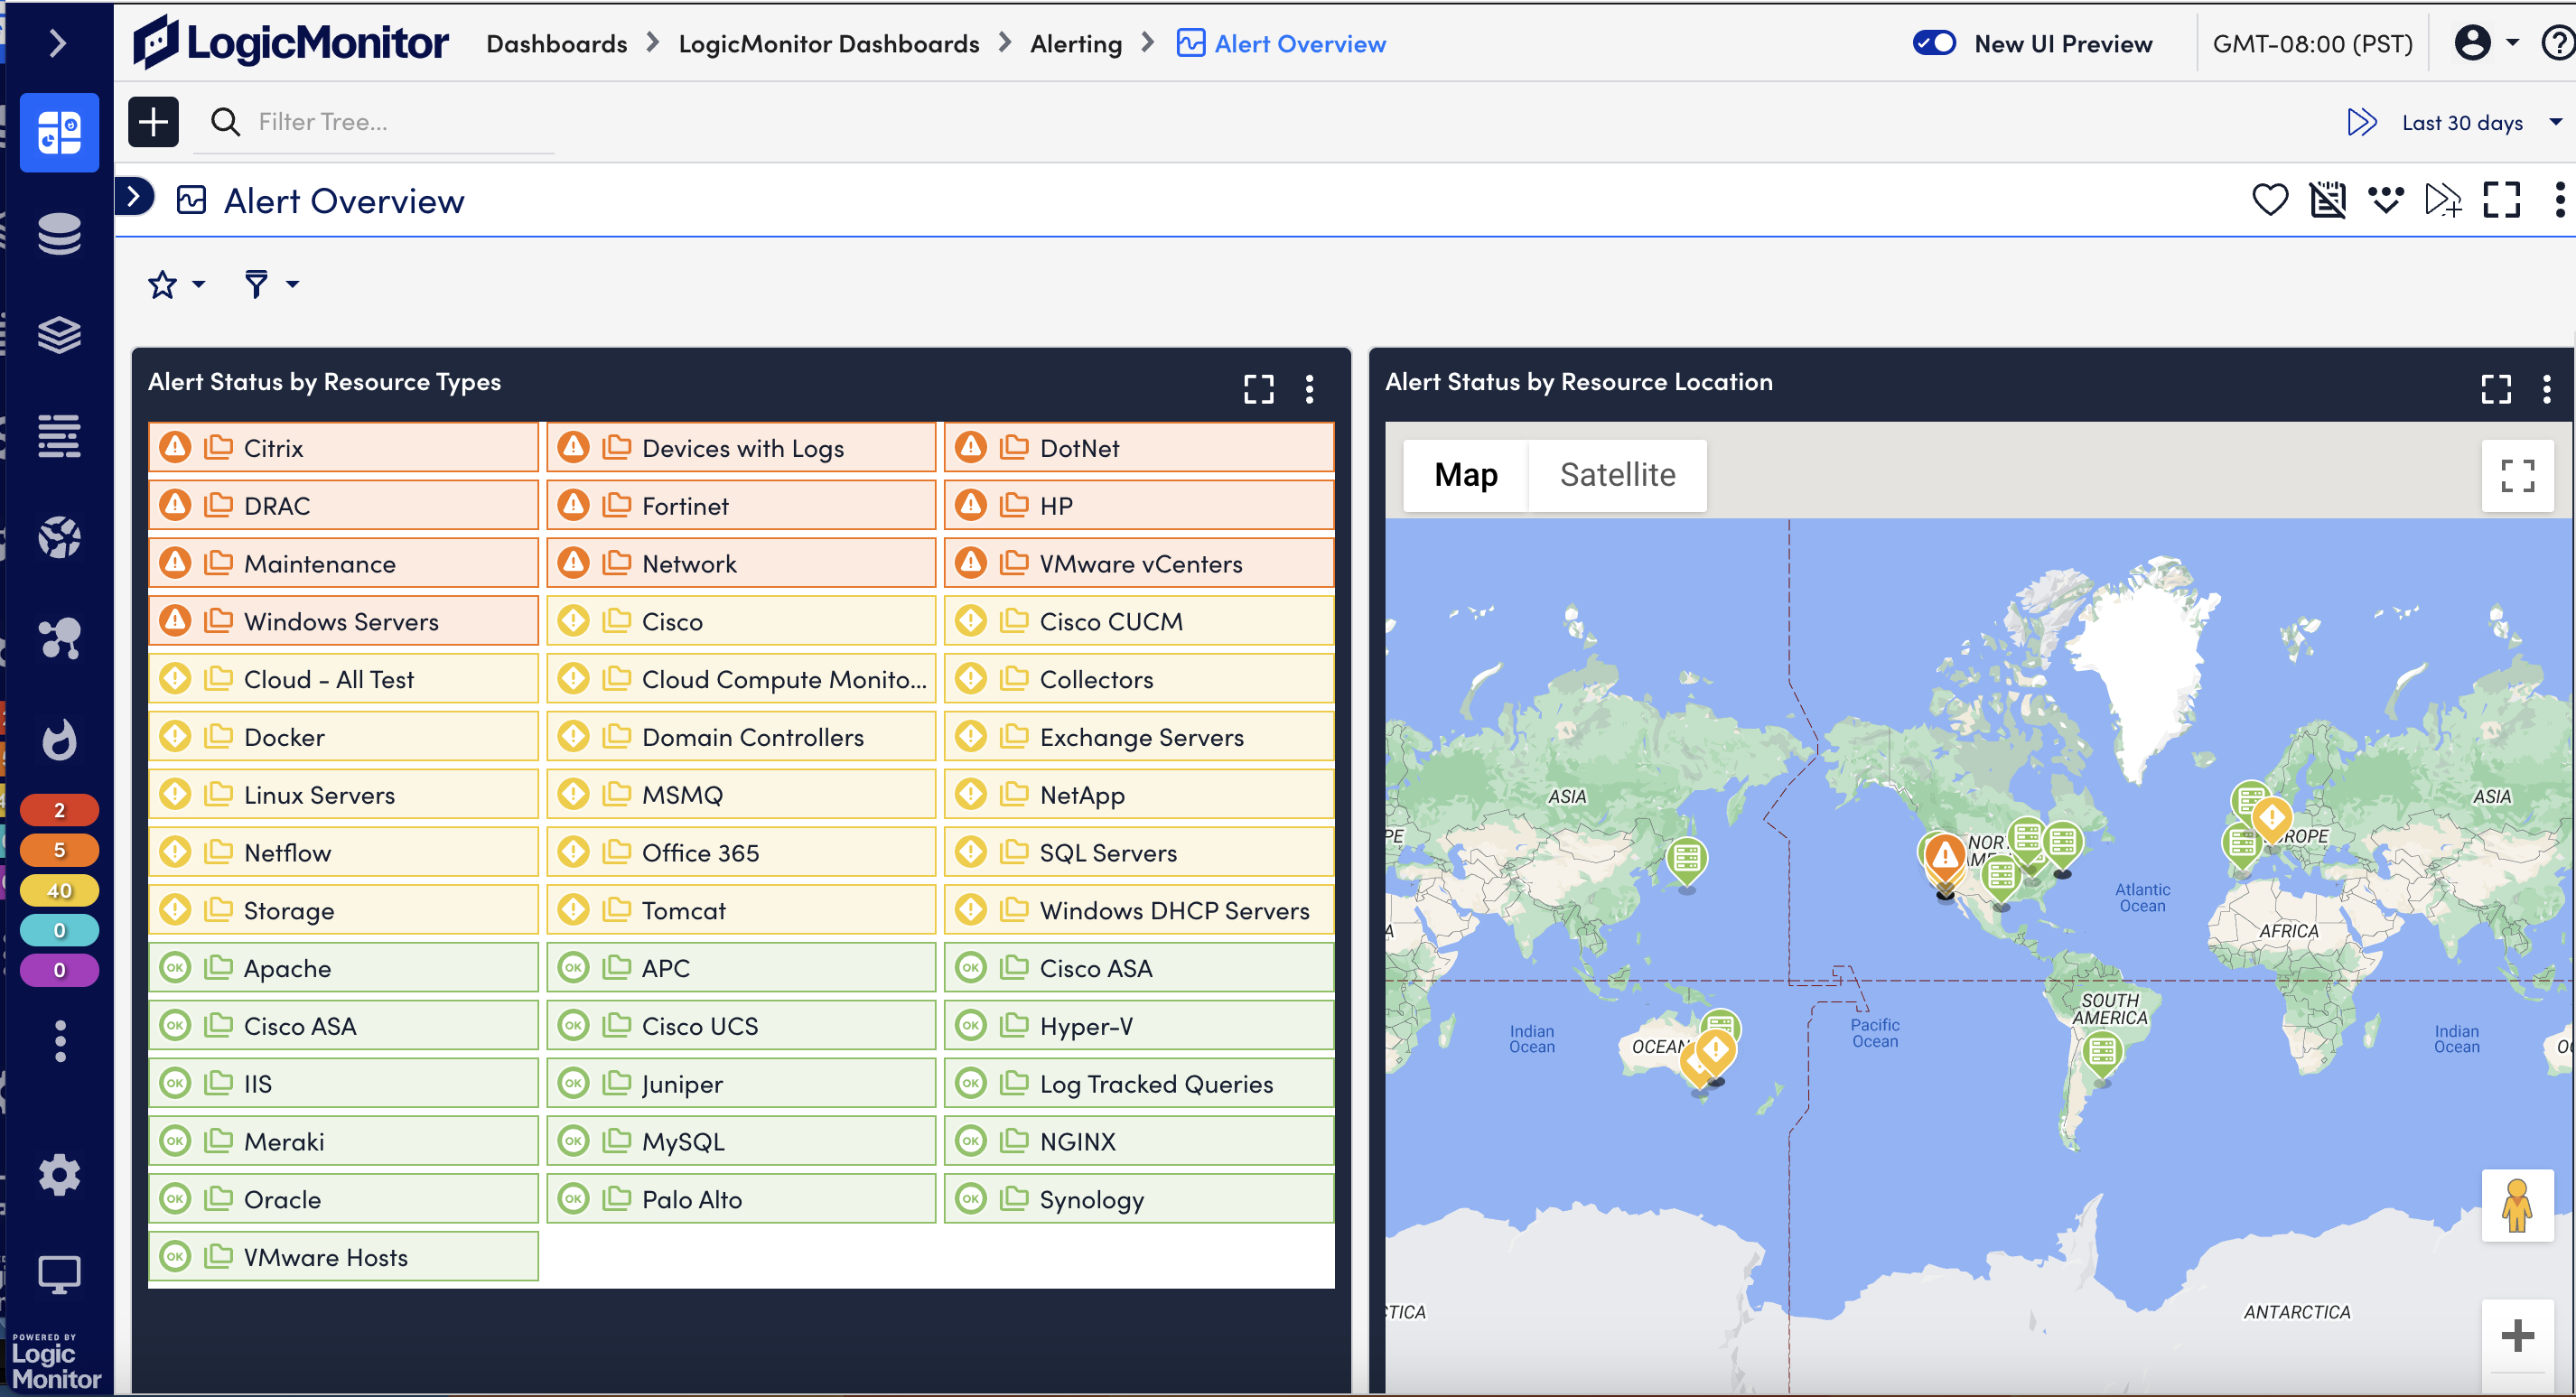
- Eliminate visibility gaps with topology mapping, anomaly detection, and more
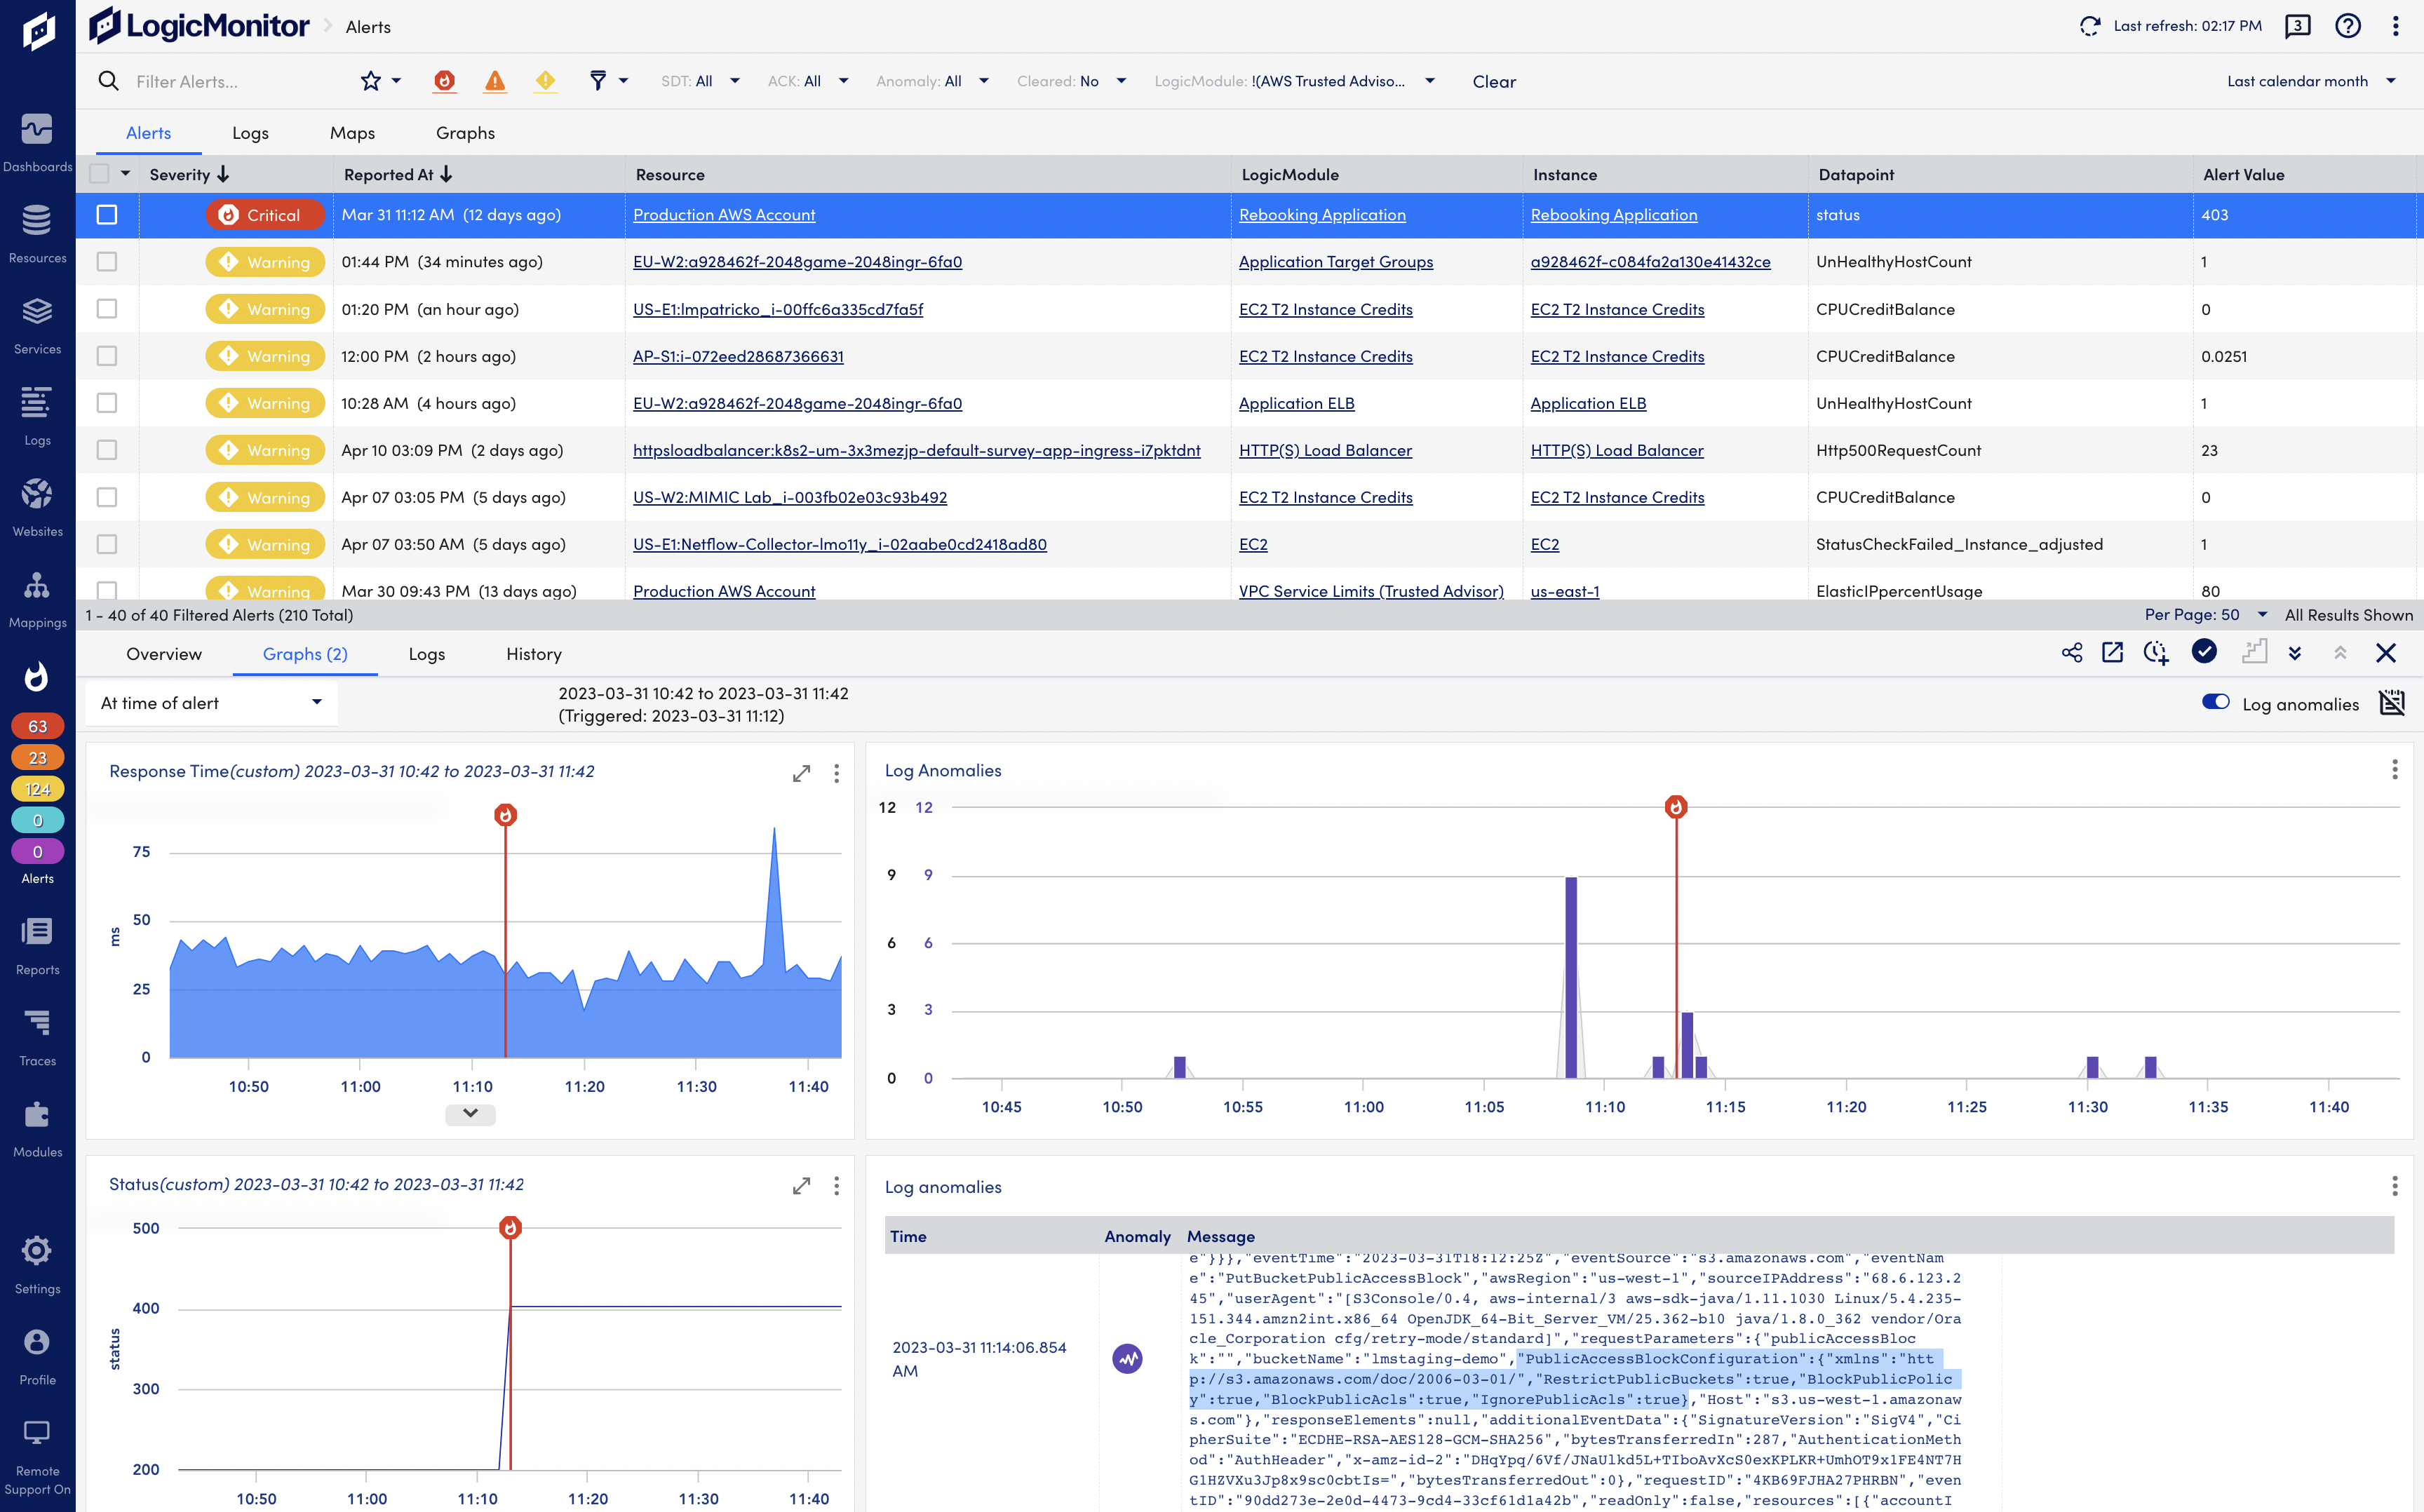
Quickly resolve outages and surface the most critical alerts with intelligent troubleshooting
- Intelligent alerting with dynamic thresholds identify anomalies and generate alerts to anticipate and immediately spot problems
- Receive advanced insights with forecasting into resource utilization and conditions to detect warning signs affecting operational health
- Simplify the process of receiving and updating infrastructure performance alerts with 2,000+ OOTB integrations for workflow and ticketing systems
Drive growth and transformation with scalable and extensible Infrastructure Monitoring
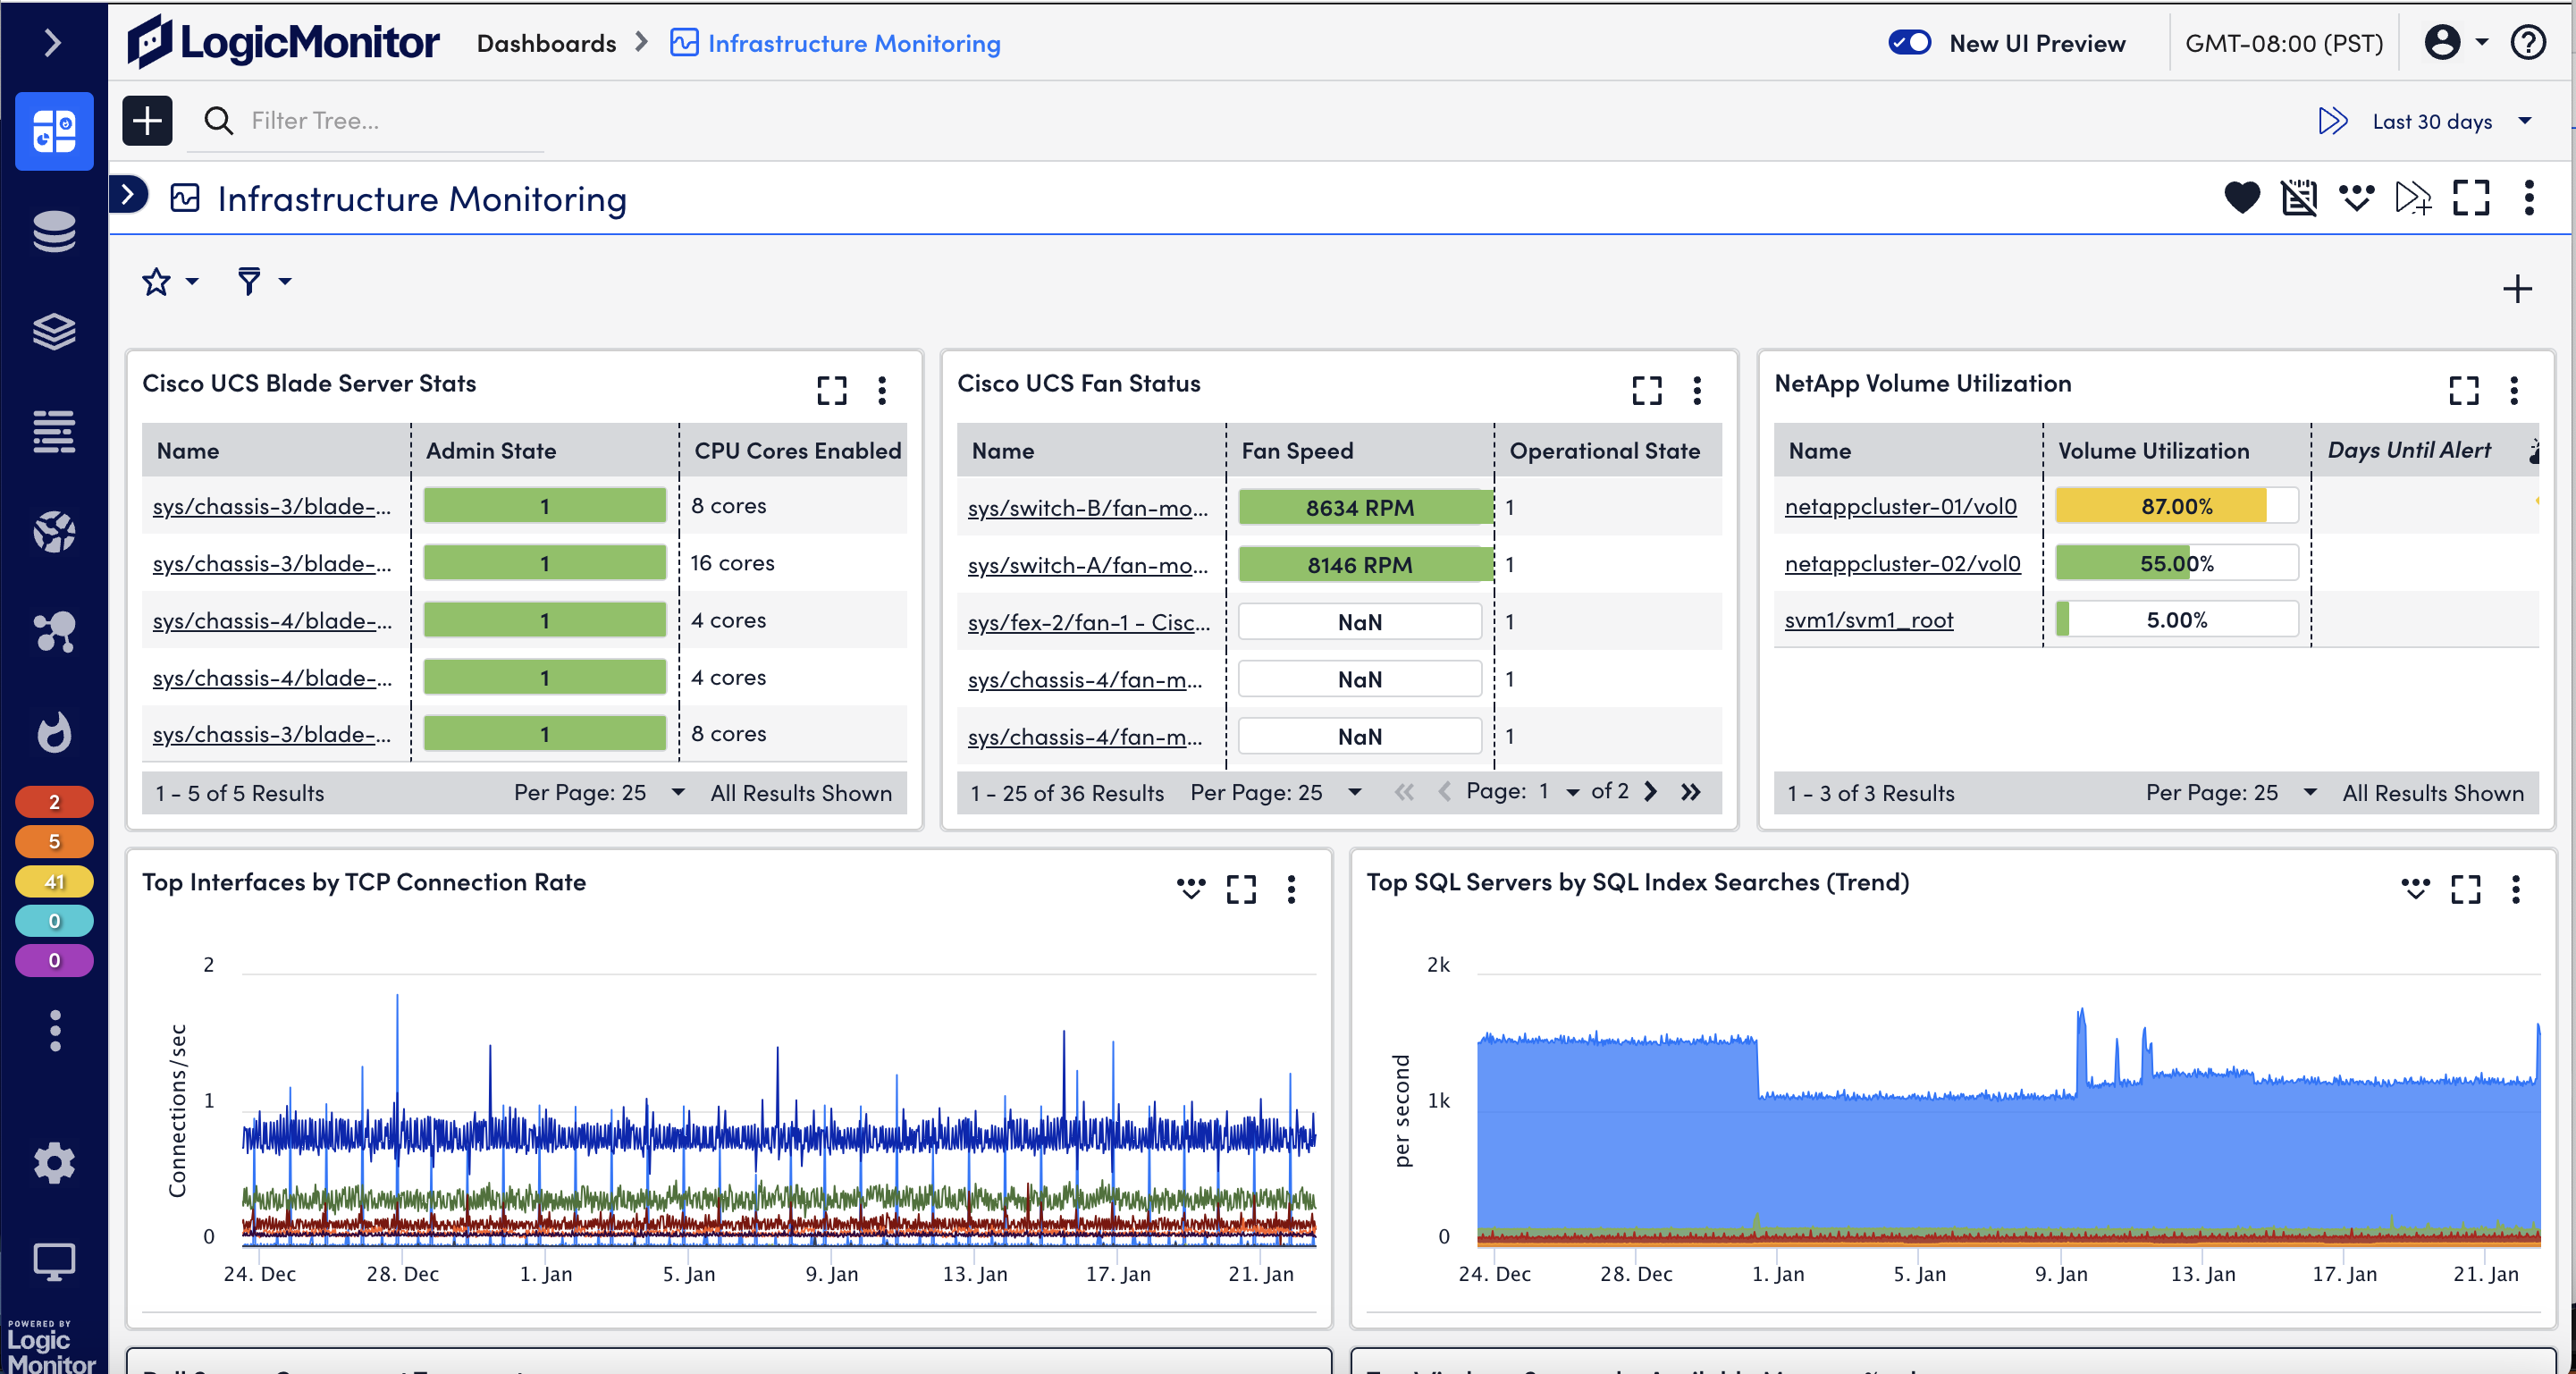
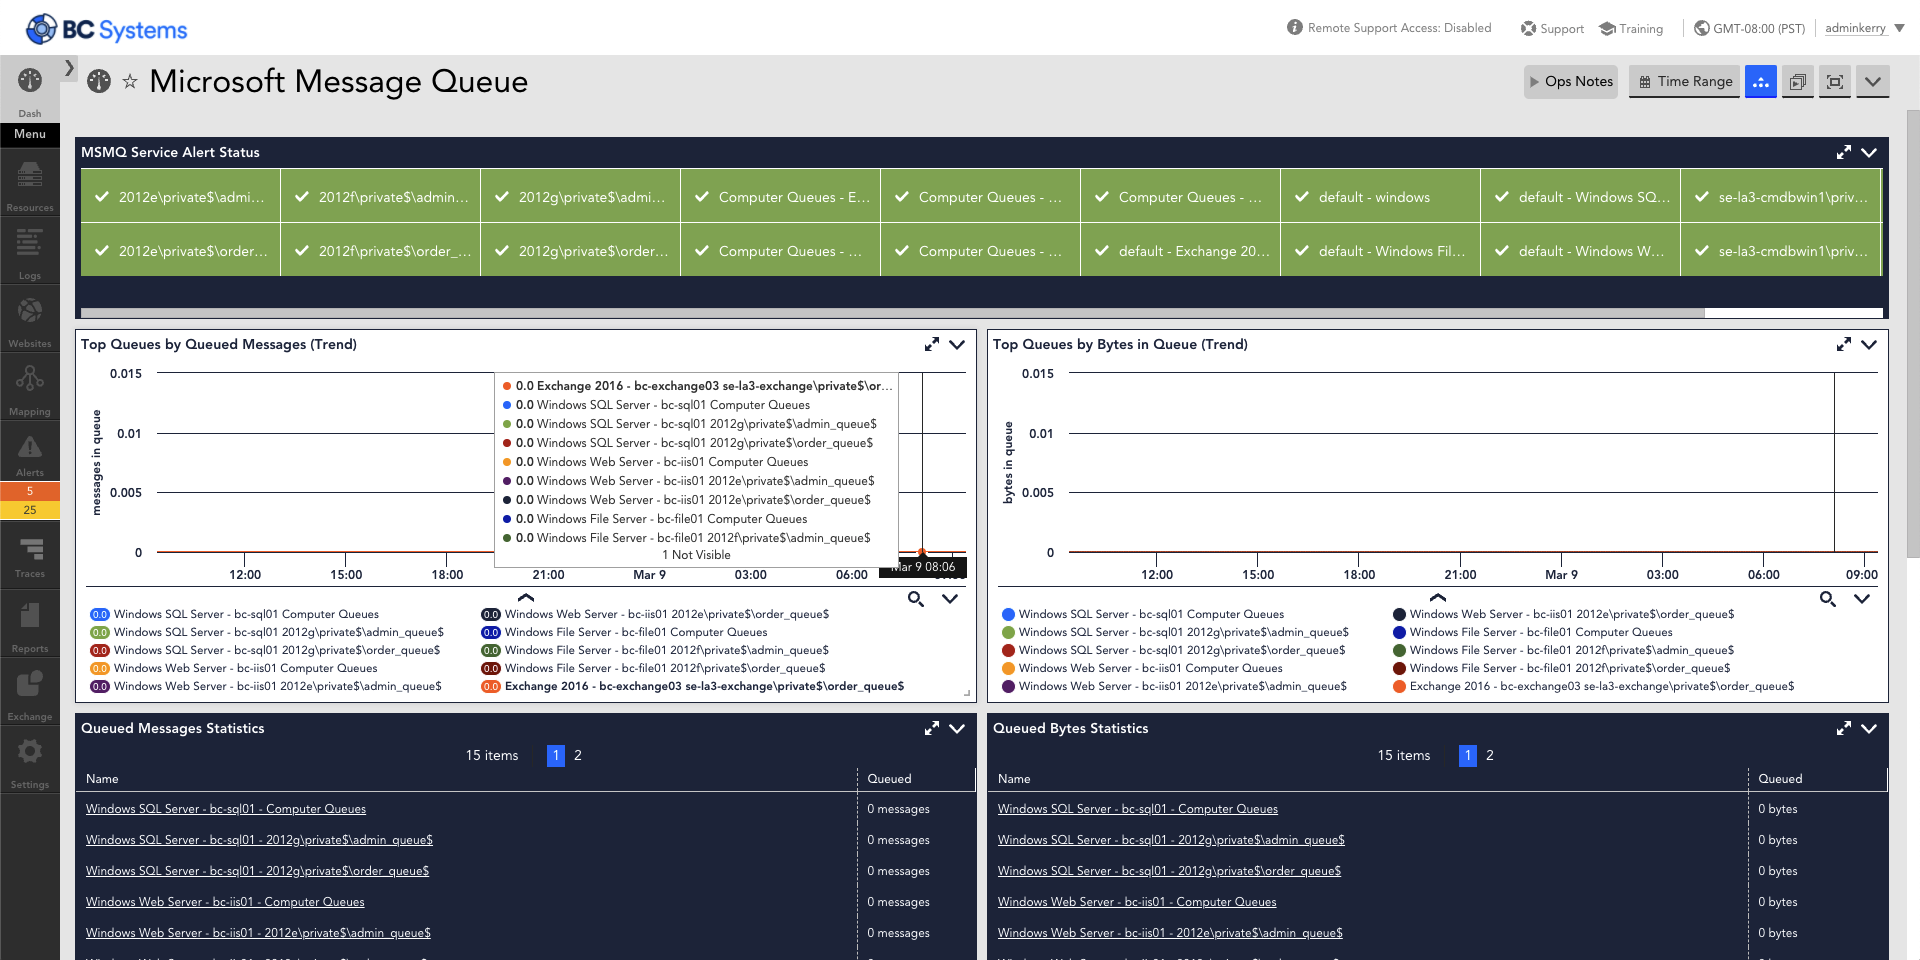
- Pre-built dashboards offer complete insight into performance data that match each business need to provide enterprise extensibility
- Visually represent updated relationships among devices to streamline troubleshooting with dynamic topology mapping
- Role Based Access Control (RBAC) creates viewing permissions for dashboards, resources, or websites to minimize accidental or malicious configurations changes
Increase efficiency, drive proficiency
- Lightning Fast Implementation across your complex, geographically-diverse infrastructure with the industry’s most intelligent collection engine
- Reduce mean time to resolution (MTTR) of incidents by avoiding blind spots and inefficiencies across your hybrid landscape
- Meet and exceed SLA’s, accelerating time-to-value
- Decrease time maintaining the solution and operationalizing your infrastructure
- World-class support with monitoring experts
See LogicMonitor in action


Our customers say it best
Track your company’s network and devices with LogicMonitor.
It’s great since we don’t have to install bothersome agents on the devices or hardware that we want to monitor. I didn’t even need to consult the instructions or contact customer support when I wanted to add a device; the process is simple and easy to follow.
Feb 12, 2024
The tool for strategic Managed Services partners
SolarWinds had the big breach just as we left it. We loved how powerful it was, and how customizable – however, it is an ON-Prem tool, and as a growing MSP, that dynamic didn’t and couldn’t scale.
Nov 21, 2022

Help businesses spend less time on manual tasks and consolidate existing tools
LogicMonitor dynamically scales with our network’s growth. Whether we add new devices or expand into the cloud, the platform adapts seamlessly, eliminating the need for constant manual configuration. Excels in providing comprehensive visibility into our network infrastructure. It auto-discovers devices and monitors various network components, including servers, switches, routers, and cloud services.
Sep 22, 2023
Infrastructure monitoring benefits
Make informed business decisions
Correlate IT data across infrastructure devices and resources
Individual devices are grouped together into instances for a comprehensive view into health and performance. Correlate key log events with corresponding infrastructure resources for immediate context for active troubleshooting.
Empower Ops teams with key insights from context-rich IT metrics and log data to manage and maintain hybrid infrastructure environments seamlessly.
Focus on impactful, performance-related activity without having to decipher between normal and abnormal device health.
Reduce length of downtime episodes
Gain predictive insights into infrastructure and network issues
LogicMonitor’s infrastructure monitoring platform analyzes billions of metrics and data points from millions of IT devices and resources to proactively detect potential infrastructure deficiencies.
AI-powered anomaly detection paired with dynamic thresholds identifies anomalies that generate intelligent alerting with the appropriate severity.
Escalation chains ensure the right teams or third-party applications are notified, and out-of-the-box integrations with ticketing systems promote swift resolution, significantly reducing the cost of IT operations.
Future-proof your monitoring
with unmatched flexibility for your hybrid infrastructure
LogicMonitor’s agentless and vendor-agnostic infrastructure monitoring works for hybrid infrastructures across enterprises of any size. An extensive library of easy to add or modify modules eliminates the burden of integration complications and allows for improved allocation of resources and time-consuming monitoring activities.
Auto-discover new infrastructure and detect environment changes with preset templates to capture data for dashboards within a single solution. Elevate Ops teams away from operational challenges to focus their efforts on strategic innovations.
Get more out of LogicMonitor


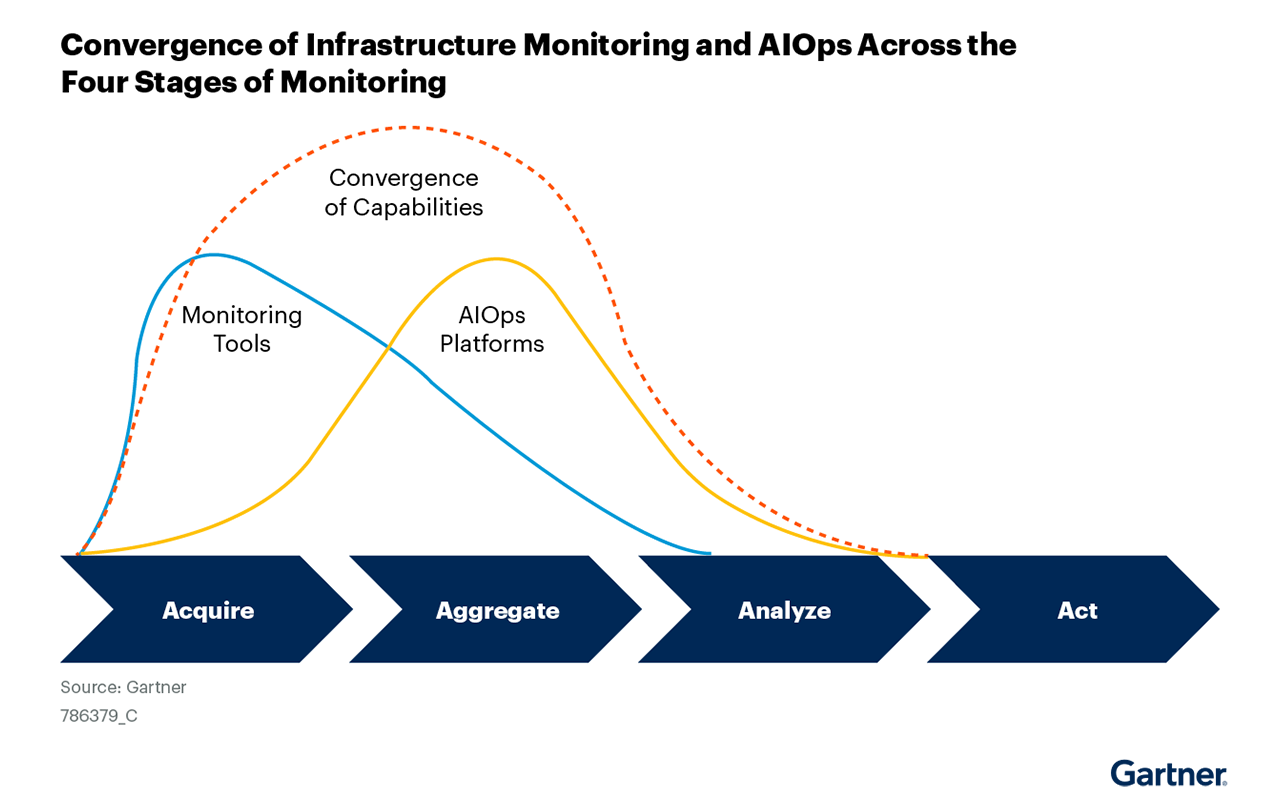
Analyst Report
Gartner® Market Guide for Infrastructure Monitoring Tools
Interested in the current state of infrastructure monitoring? Download the Gartner Market Guide for Infrastructure Monitoring Tools.
Trusted by over 2000 companies


Infrastructure monitoring frequently asked questions
- What is infrastructure monitoring?
Infrastructure monitoring is the real-time collection and analysis of the devices within an IT infrastructure. An IT infrastructure can contain on-premises devices, such as servers and network tools, cloud solutions, such as public and private cloud, as well as the entire IT tech stack needed for a company.
- What is infrastructure management?
Infrastructure management is the ability to perform tasks within an IT infrastructure, based on it’s analyzed health.
- Infrastructure monitoring vs infrastructure management
Infrastructure monitoring differs from infrastructure management in that it includes both the passive monitoring, as well as the traditional management within an IT infrastructure.
- What does ITIM mean?
ITIM stands for IT infrastructure monitoring.
- Is LogicMonitor agent-based or agentless?
LogicMonitor uses an agentless collector to gather data for connected devices. No physical equipment necessary!
- How is infrastructure data collected?
Infrastructure data is gathered via Collectors, which are small nodes used to grab the definied metrics within a device.
More infrastructure monitoring resources

accelerate growth / 02.07.24