
Apache
Apache Web Server powers your mission critical sites. Whether internal or customer-facing, you need to know when your web-server performance is under heavy load or not performing optimally. LogicMonitor provides agentless and proactive monitoring of your Apache instances so that it can maintain performance and scale with confidence.

Benefits of monitoring Apache with LogicMonitor
Agentless and Proactive Monitoring for Apache
LogicMonitor’s agentless architecture allows you to deploy anywhere and start collecting critical Apache metrics, such as Busy-Workers and Response-Time, within minutes.
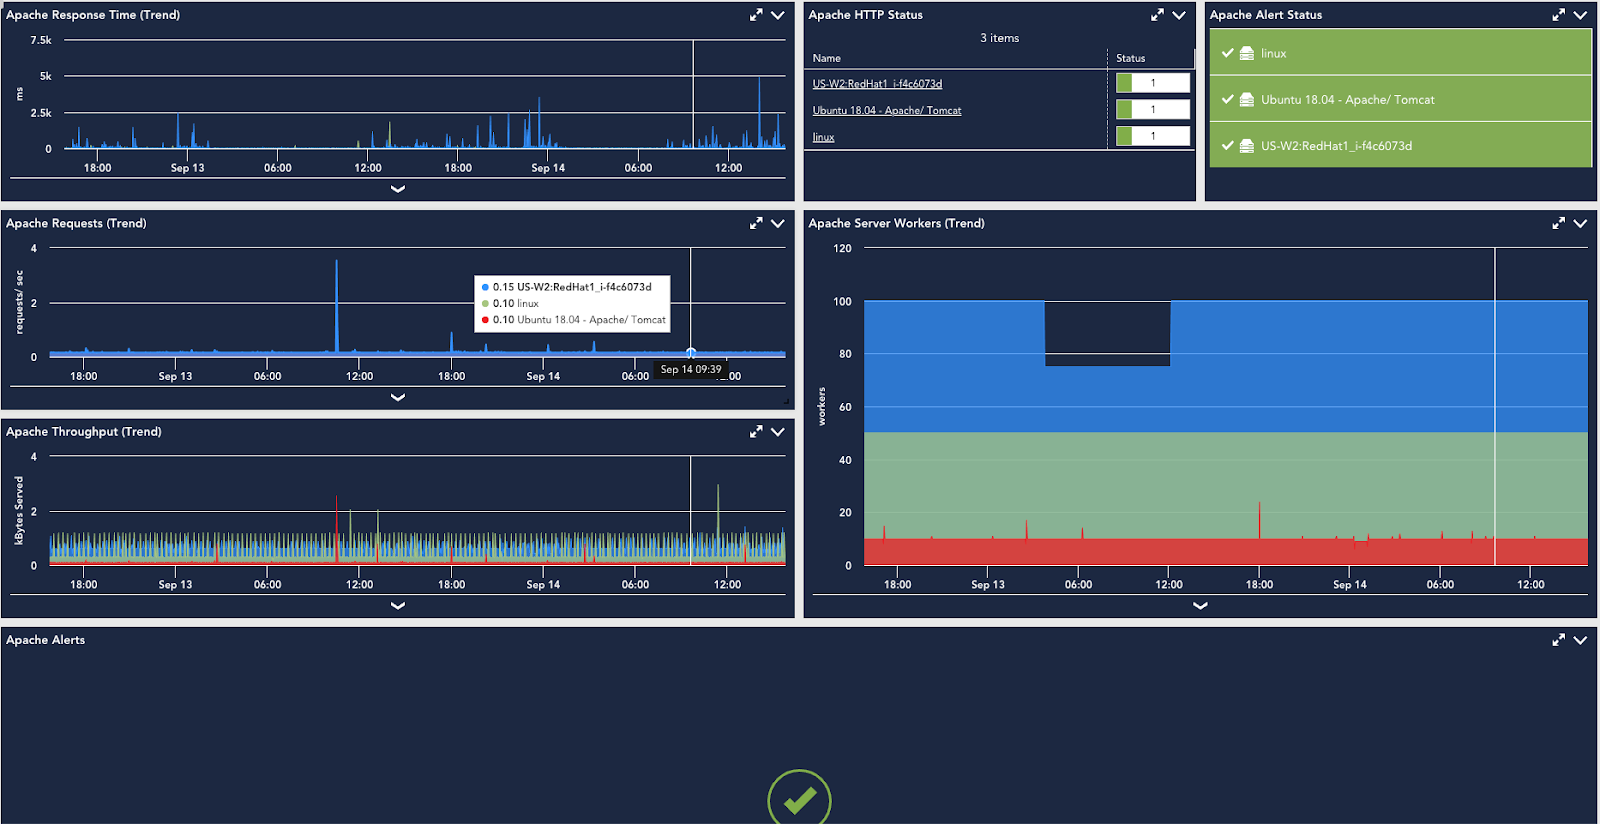
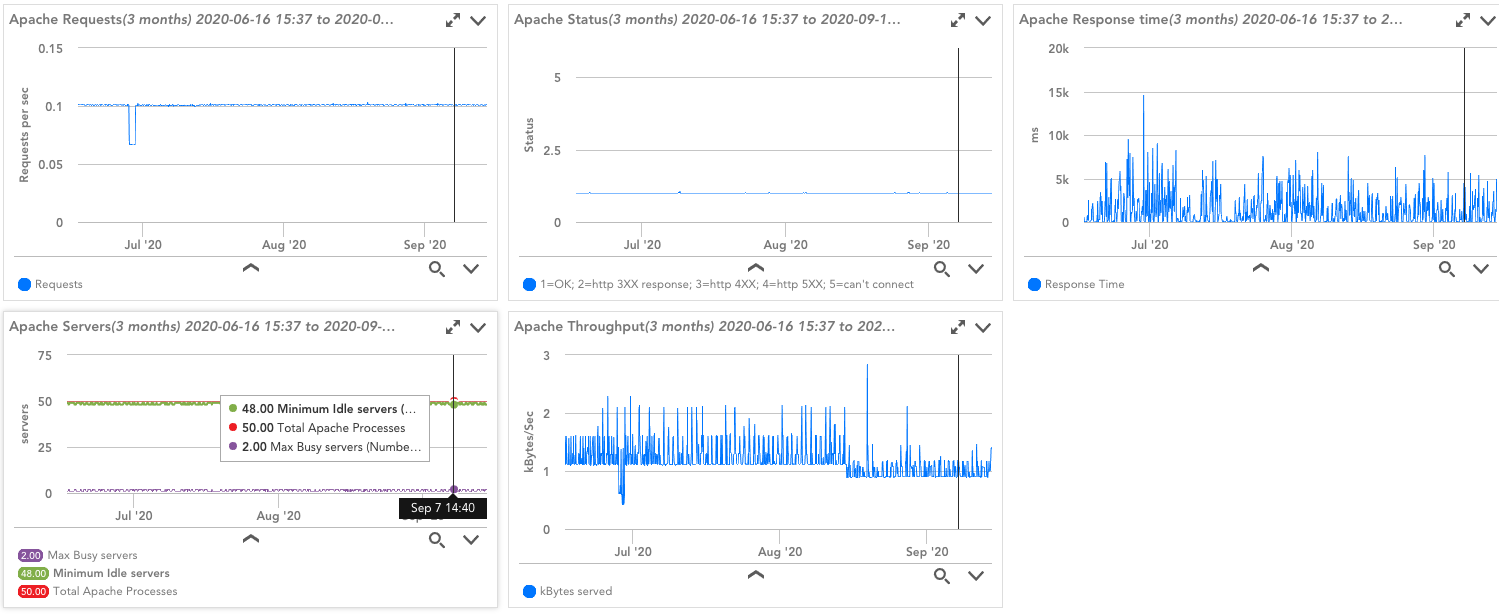
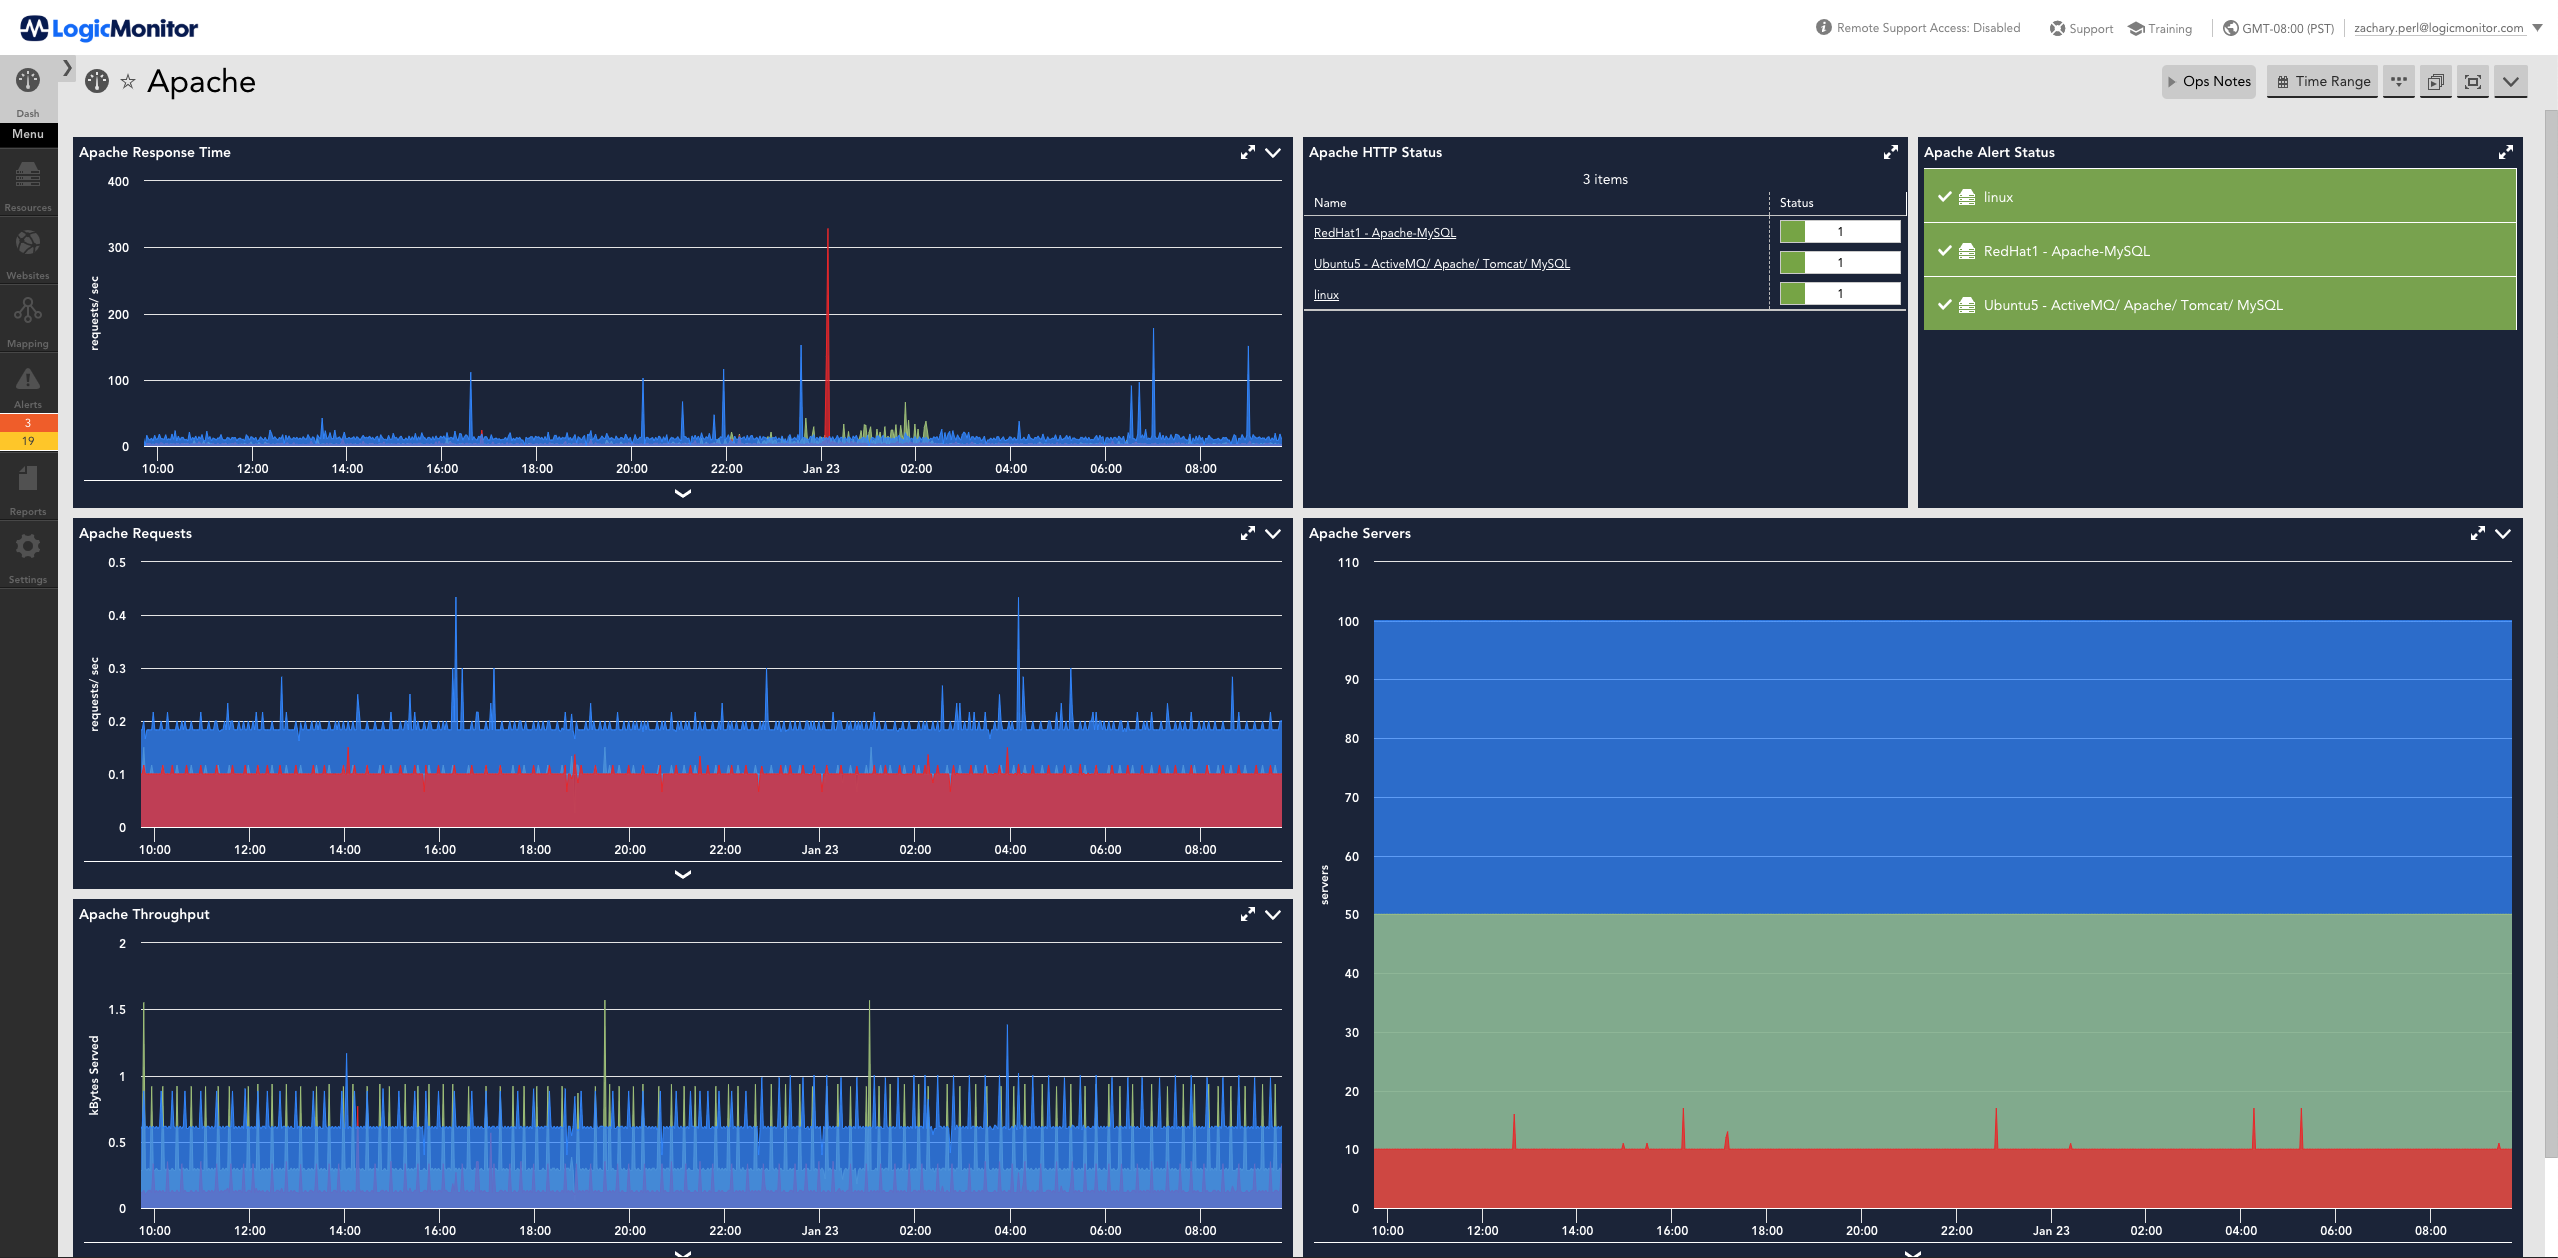
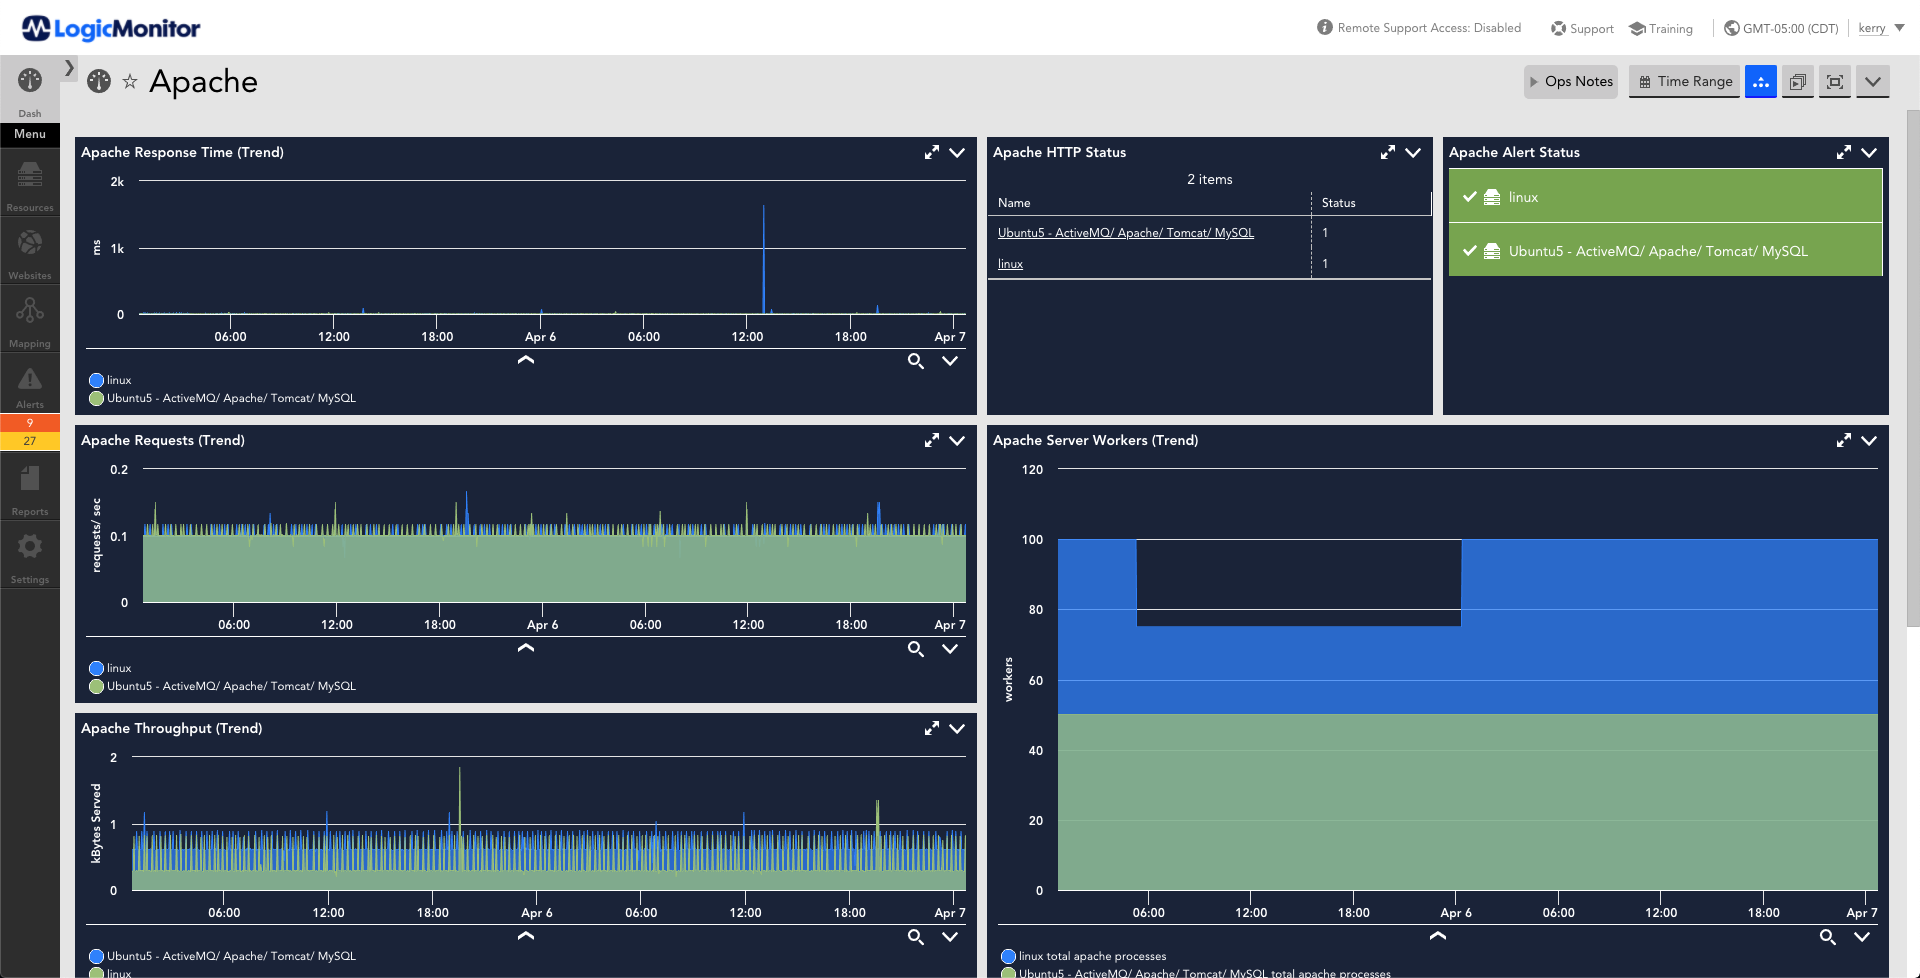
Contextualize and Correlate your data on pre-built Dashboards
Out-of-the-box dashboards help you contextualize and compare performance across your fleet of Apache Web Servers. Quickly identify performance bottlenecks and improper load-balancing.
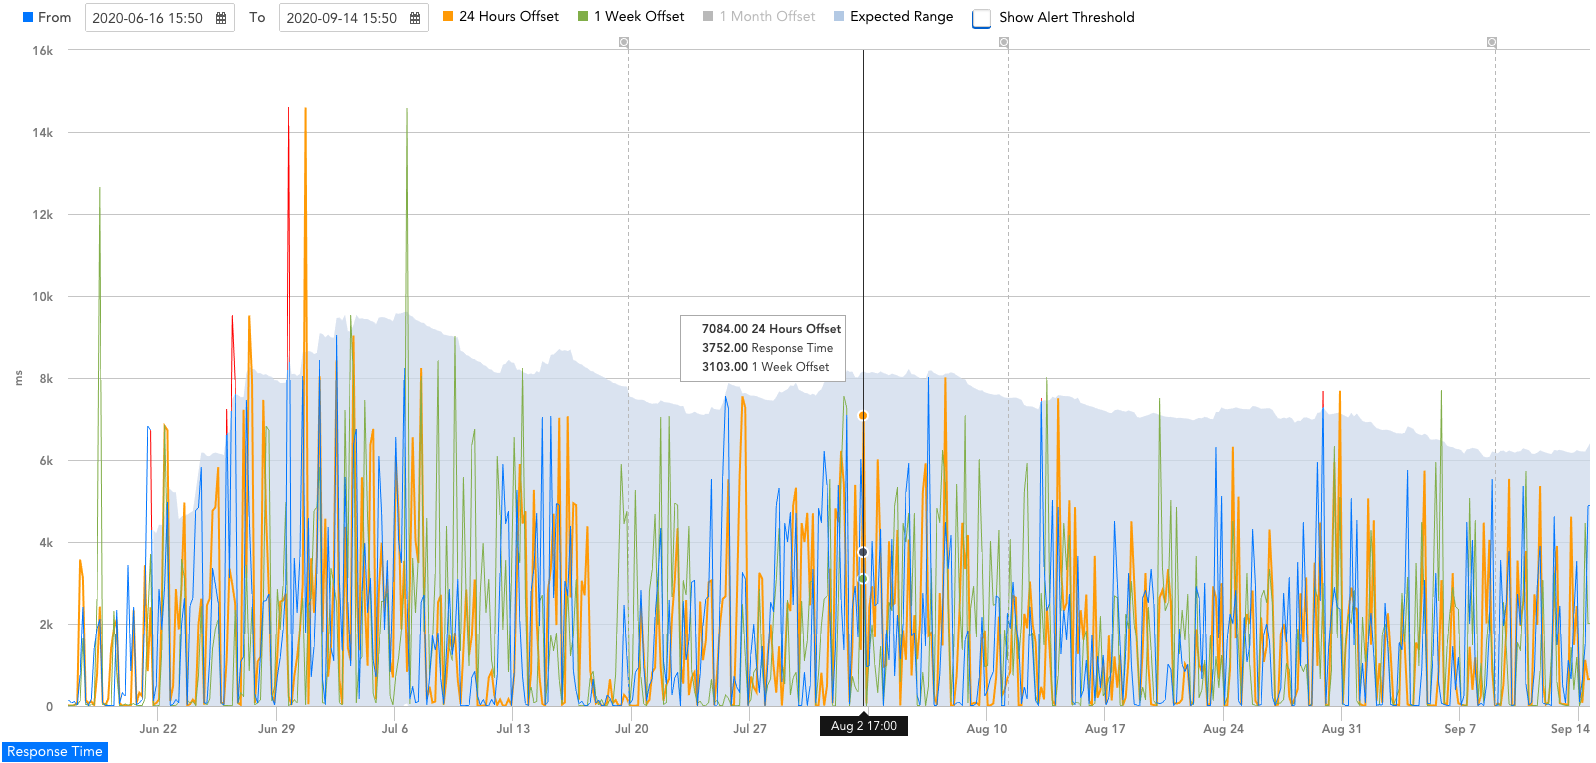
Immediately alert on irregular Apache Web Server behavior
Take advantage of LogicMonitor’s machine-learning so that you are alerted to irregular behavior on your Apache instances, while also reducing alert-noise from recognized norms.
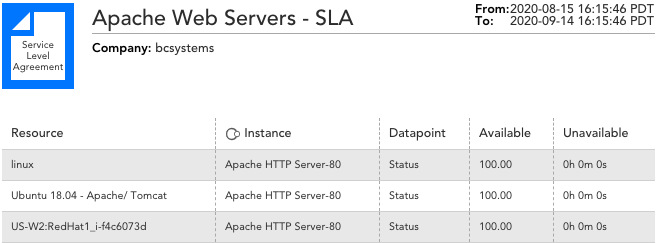
Accurately Report on Trends and Forecasts
LogicMonitor stores all of your collected metrics for up to two years – no roll-ups or aggregation. This means you can confidently report on trends, forecasts, and SLA’s of your Web Server availability and performance.
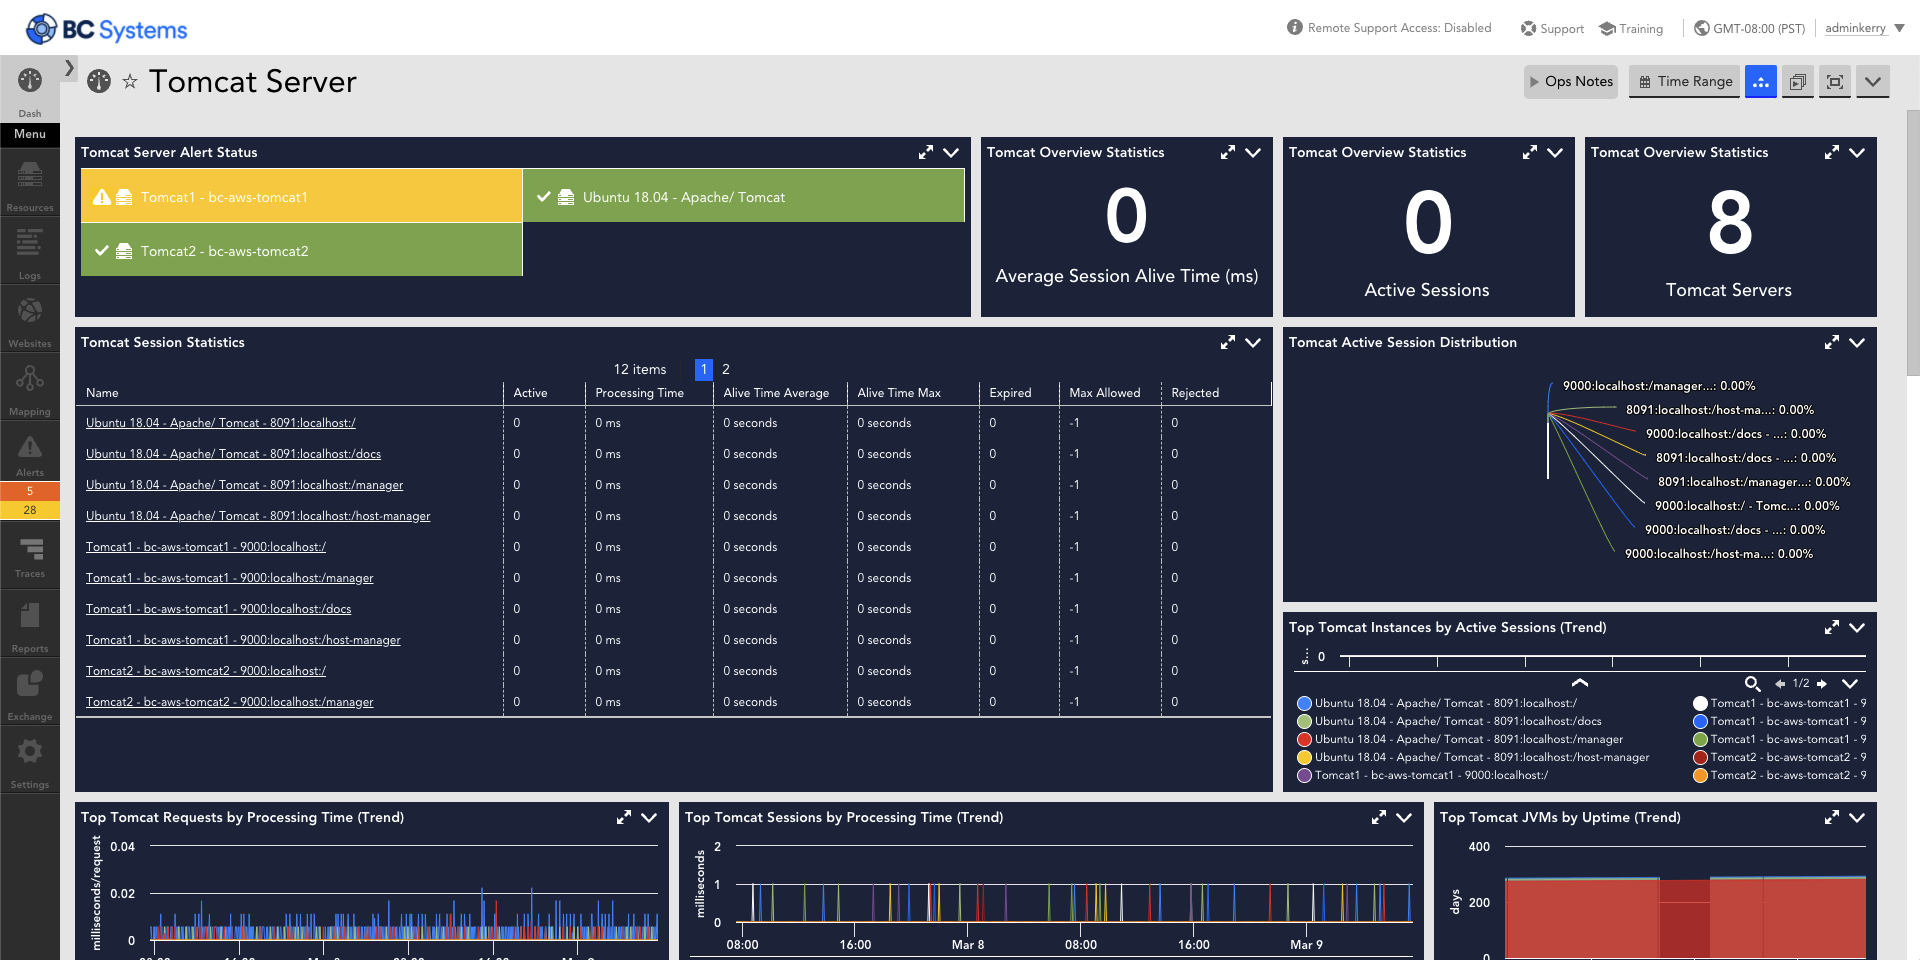
Apache Tomcat
For each Tomcat instance found, LogicMonitor automatically monitors, trends, and alerts on KPIs, allowing you to build out dashboards that show the data critical to your IT Operations. Predefined alert thresholds provide recommendations for settings that may need tuning or instances that may need optimization. Along with the Tomcat data, LogicMonitor provides health visibility of the host, network, and other components that the Tomcat server relies on.
Zookeeper
You chose ZooKeeper as a high-performance coordination service for distributed applications so you didn’t have to write one from scratch; now you don’t have to write ZooKeeper monitoring from scratch, either. LogicMonitor discovers all your ZooKeeper servers, and monitors, graphs, and alerts on them automatically.
Hadoop
LogicMonitor seamlessly discovers your Hadoop clusters, providing automatic monitoring, graphing, and alerting. LogicMonitor keeps a vigilant eye on critical Hadoop metrics like job status, CPU usage, memory usage, and disk space, alerting you immediately about any potential bottlenecks or performance hiccups. By choosing LogicMonitor’s Hadoop integration, you can focus on capitalizing on Hadoop’s powerful data processing, while LogicMonitor takes care of your monitoring requirements.
Kafka
LogicMonitor efficiently discovers all your Apache Kafka clusters, providing automated monitoring, graphing, and alerting for them. With LogicMonitor, you can seamlessly track key metrics like message rates, latency, and consumer lag, while promptly receiving alerts on any performance issues or anomalies.

More Apache resources
Apache Monitoring
Documentation
What Is Apache Kafka and How Do You Monitor It?
Blog
3 Simple steps to Apache Monitoring
Blog
Apache Hive Monitoring
Documentation
Apache Hadoop Monitoring
Documentation
v.131 Release: New Monitoring for Apache Hadoop; Extended Topology Coverage
Release Notes
Kafka
Documentation