

Kubernetes Monitoring
LogicMonitor ensures you fully harness Kubernetes’ power while maintaining complete control. From tracking resource utilization to proactive anomaly detection, our platform has been designed to deliver deep insights and immediate alerts at every level of your Kubernetes infrastructure.
A better way to collaborate, communicate, and automate
Longer storage life, simpler setup
Avoid the hassle of managing storage solutions for performance data with granular data retention for up to two years. Avoid the burden and overhead of having an agent on every node with a solution that simply runs as two Pods in the cluster.
Customize your dashboards and alerts to work for you
Out-of-the-box dashboards will help you optimize your cluster. Pre-configured alert thresholds ensure that you receive meaningful alerts right from the start, so you can proactively prevent downtime.
Get the most out of automation
Maximize performance with automated monitoring for Kubernetes Pods, Nodes, Services, Containers, and standard applications, all based on best practices.
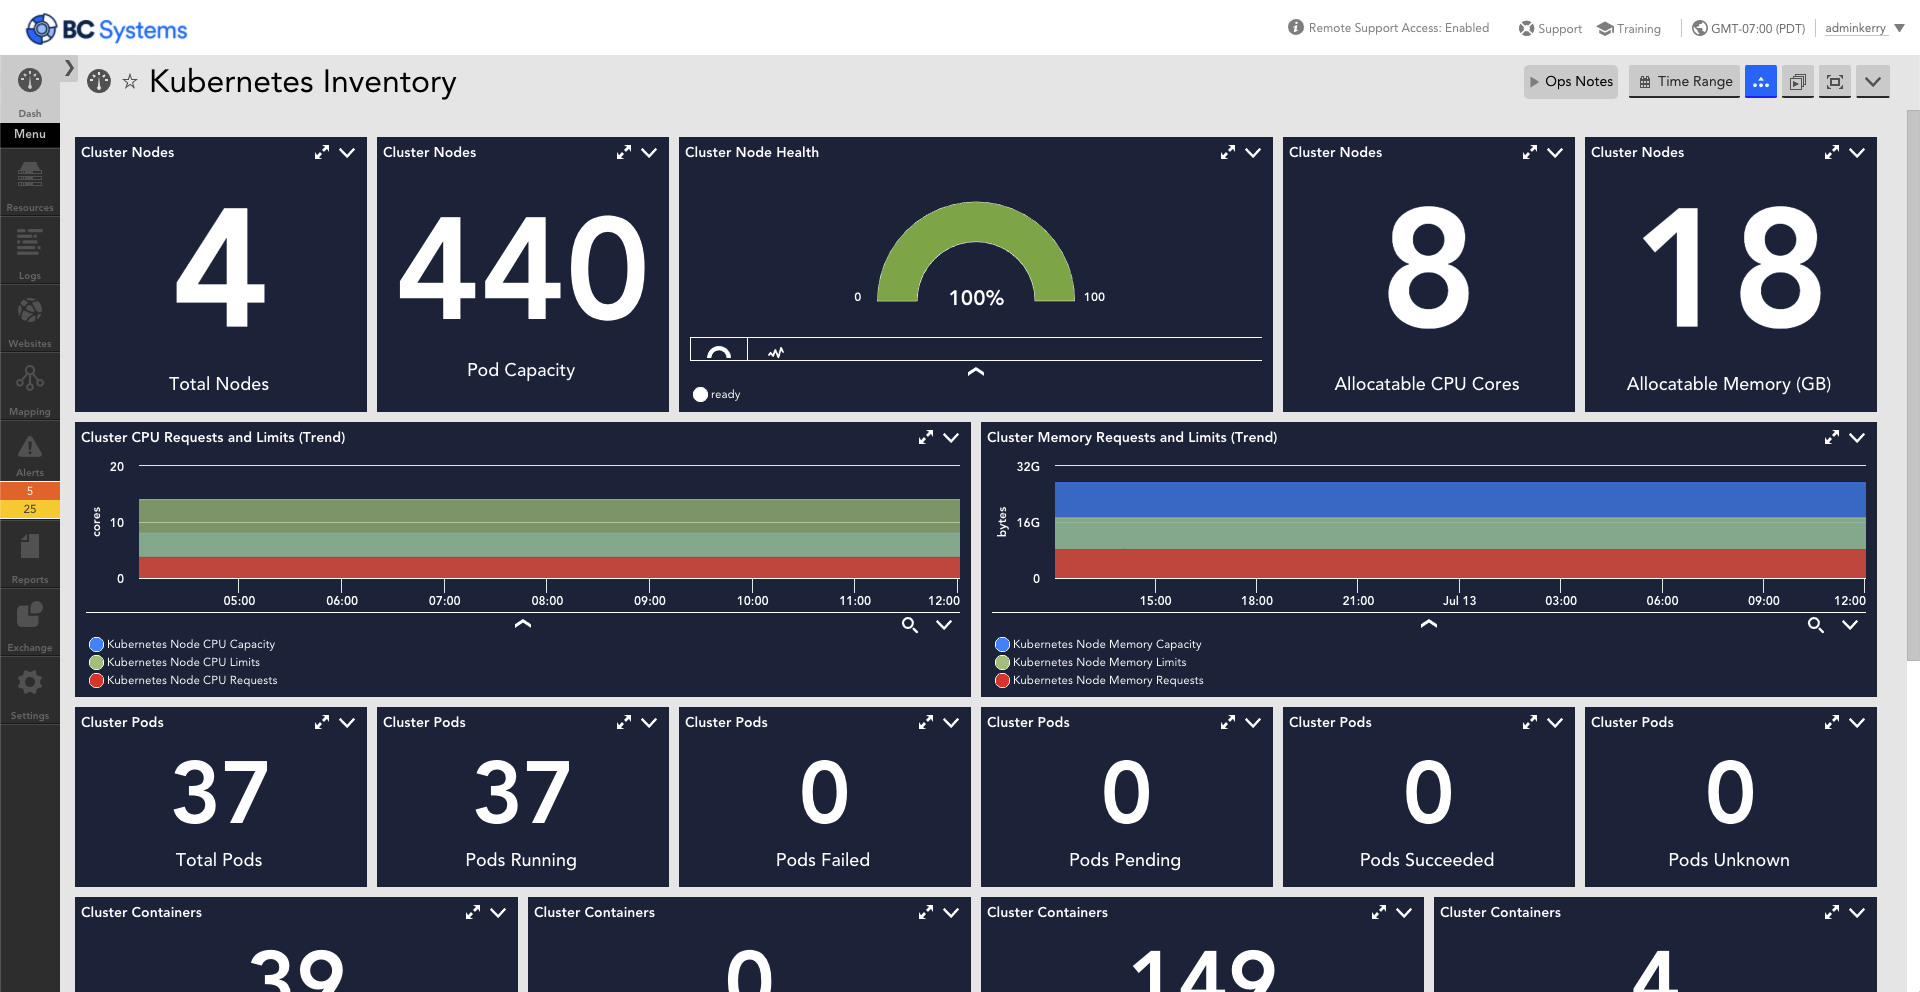
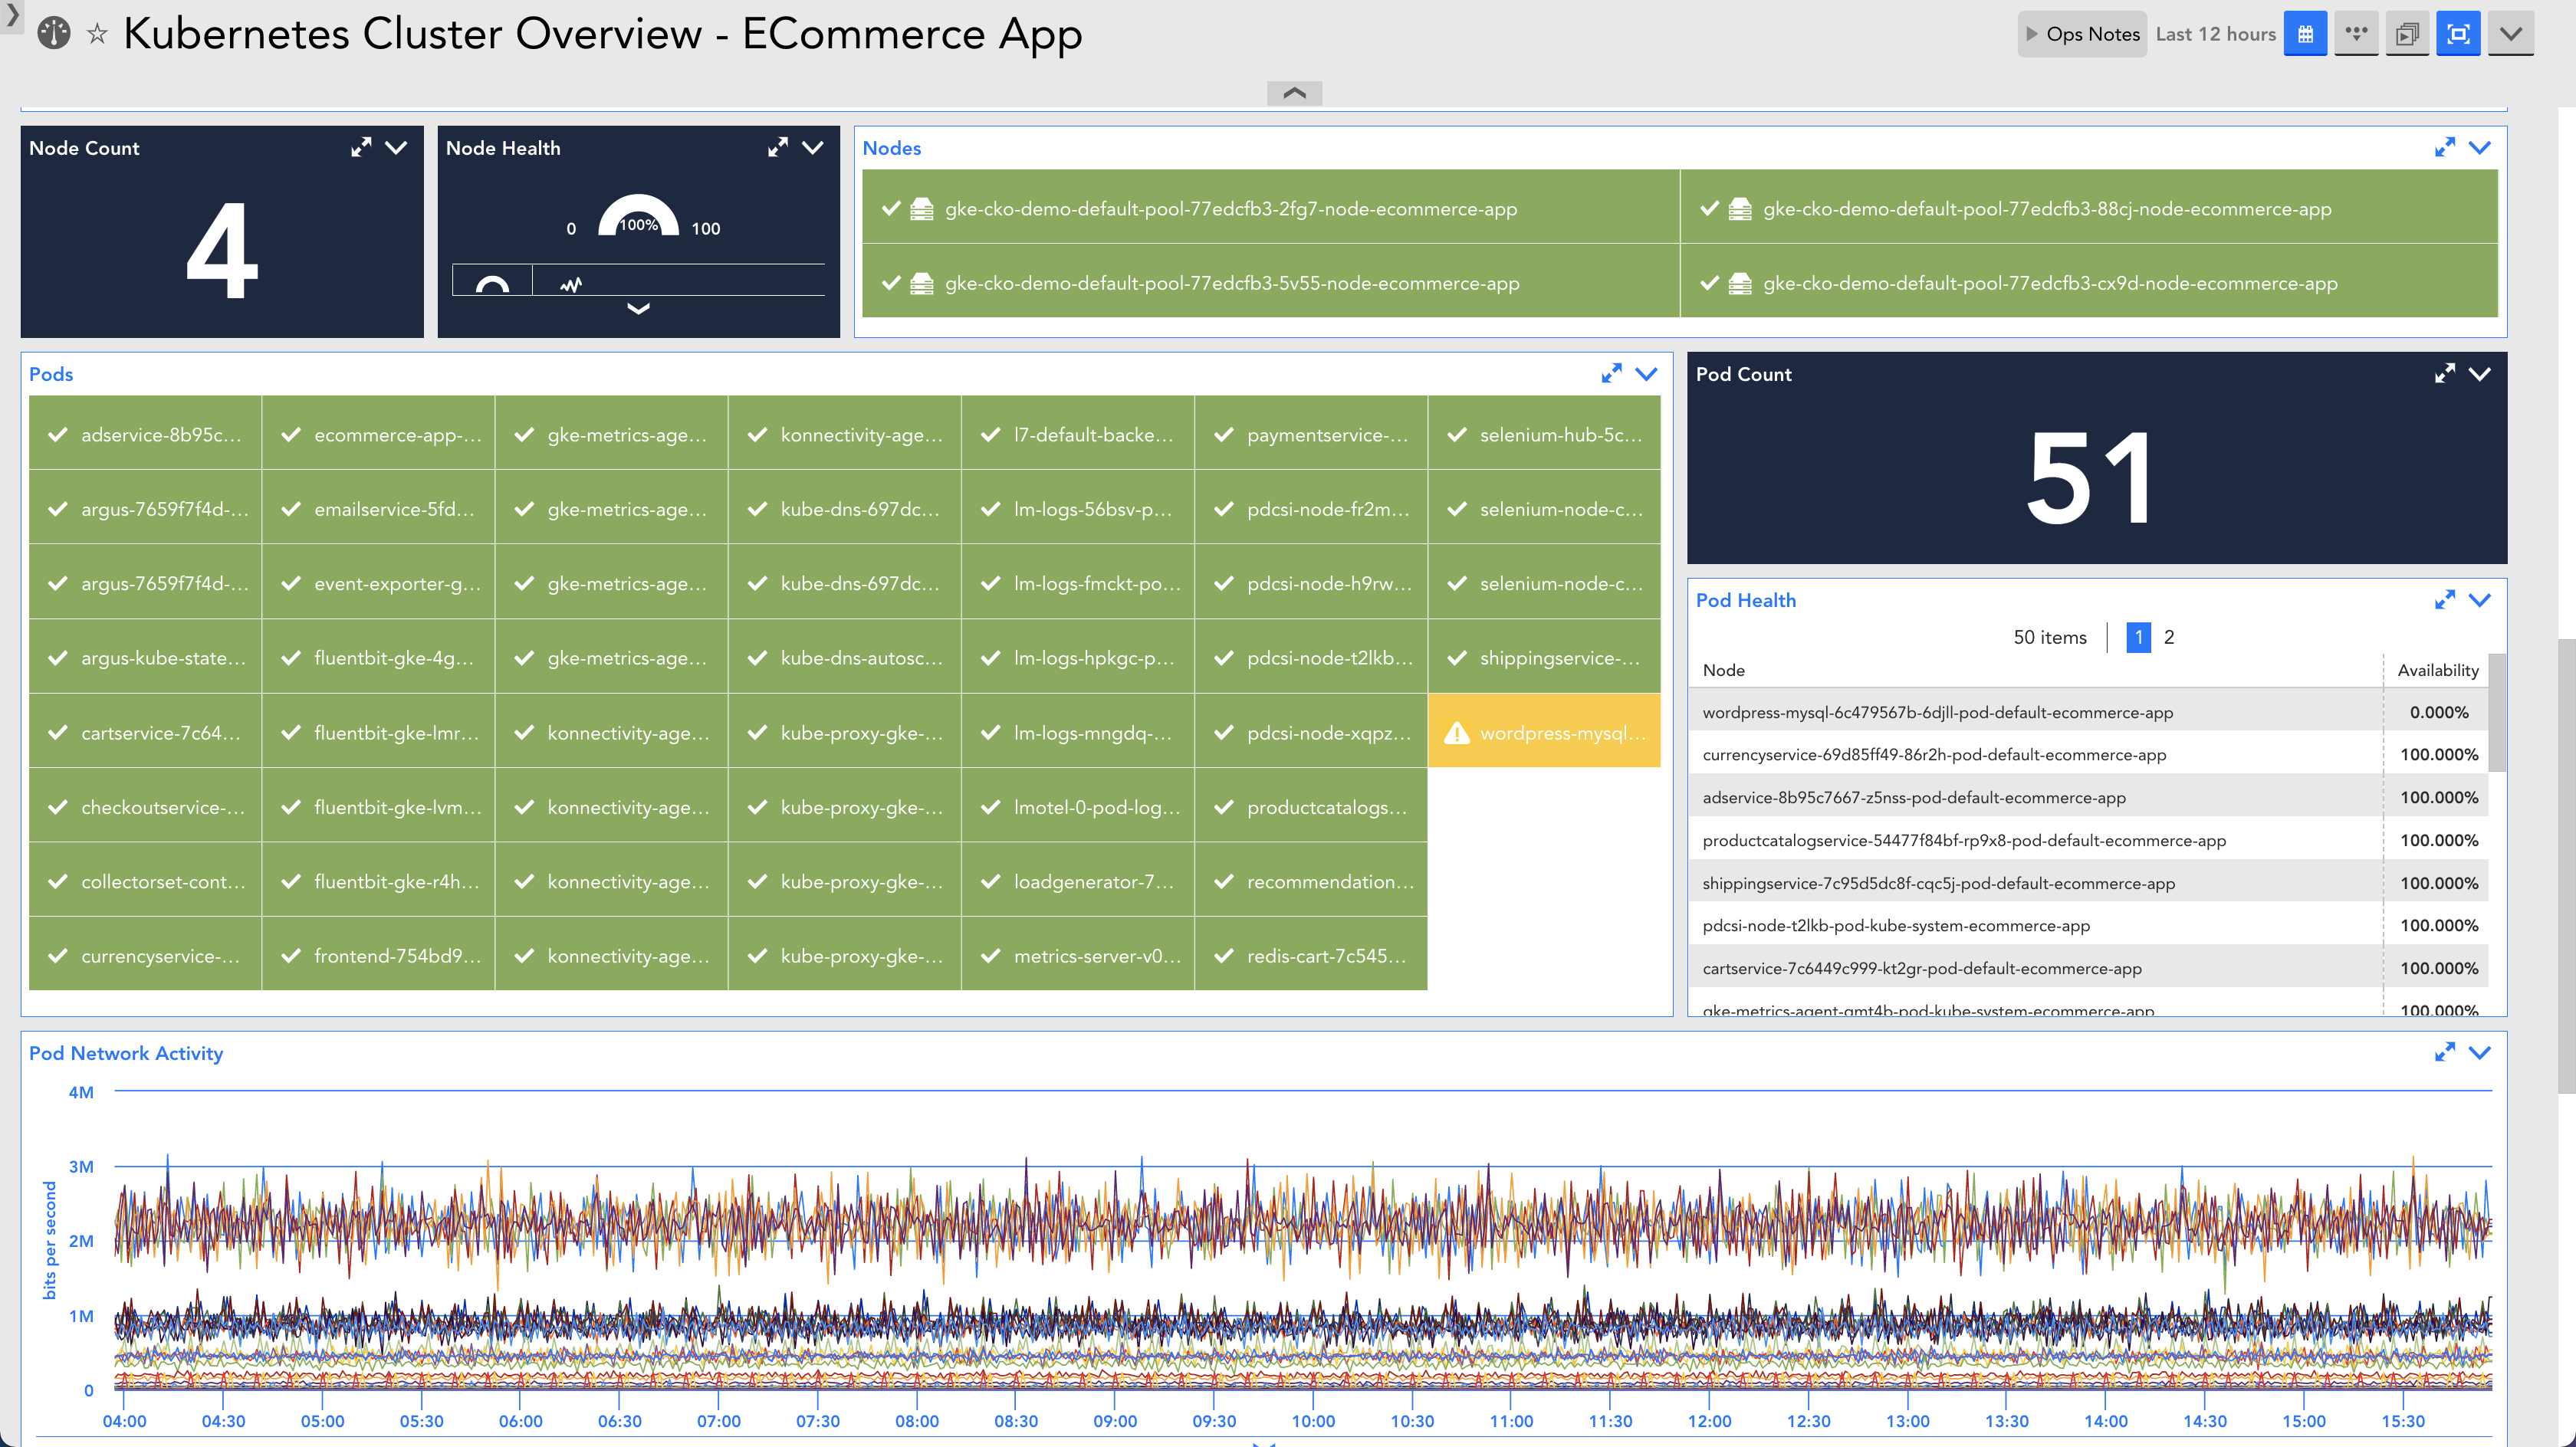
Maintain healthy clusters
Maintaining the health of your Kubernetes clusters is pivotal to ensuring smooth and reliable operations. With LogicMonitor, you gain comprehensive visibility into your Kubernetes clusters’ status, including individual node health, pod status, and resource utilization. This holistic view, coupled with proactive alerts, enables you to quickly identify and mitigate any issues, ensuring your clusters remain robust, responsive, and ready to meet your operational demands.
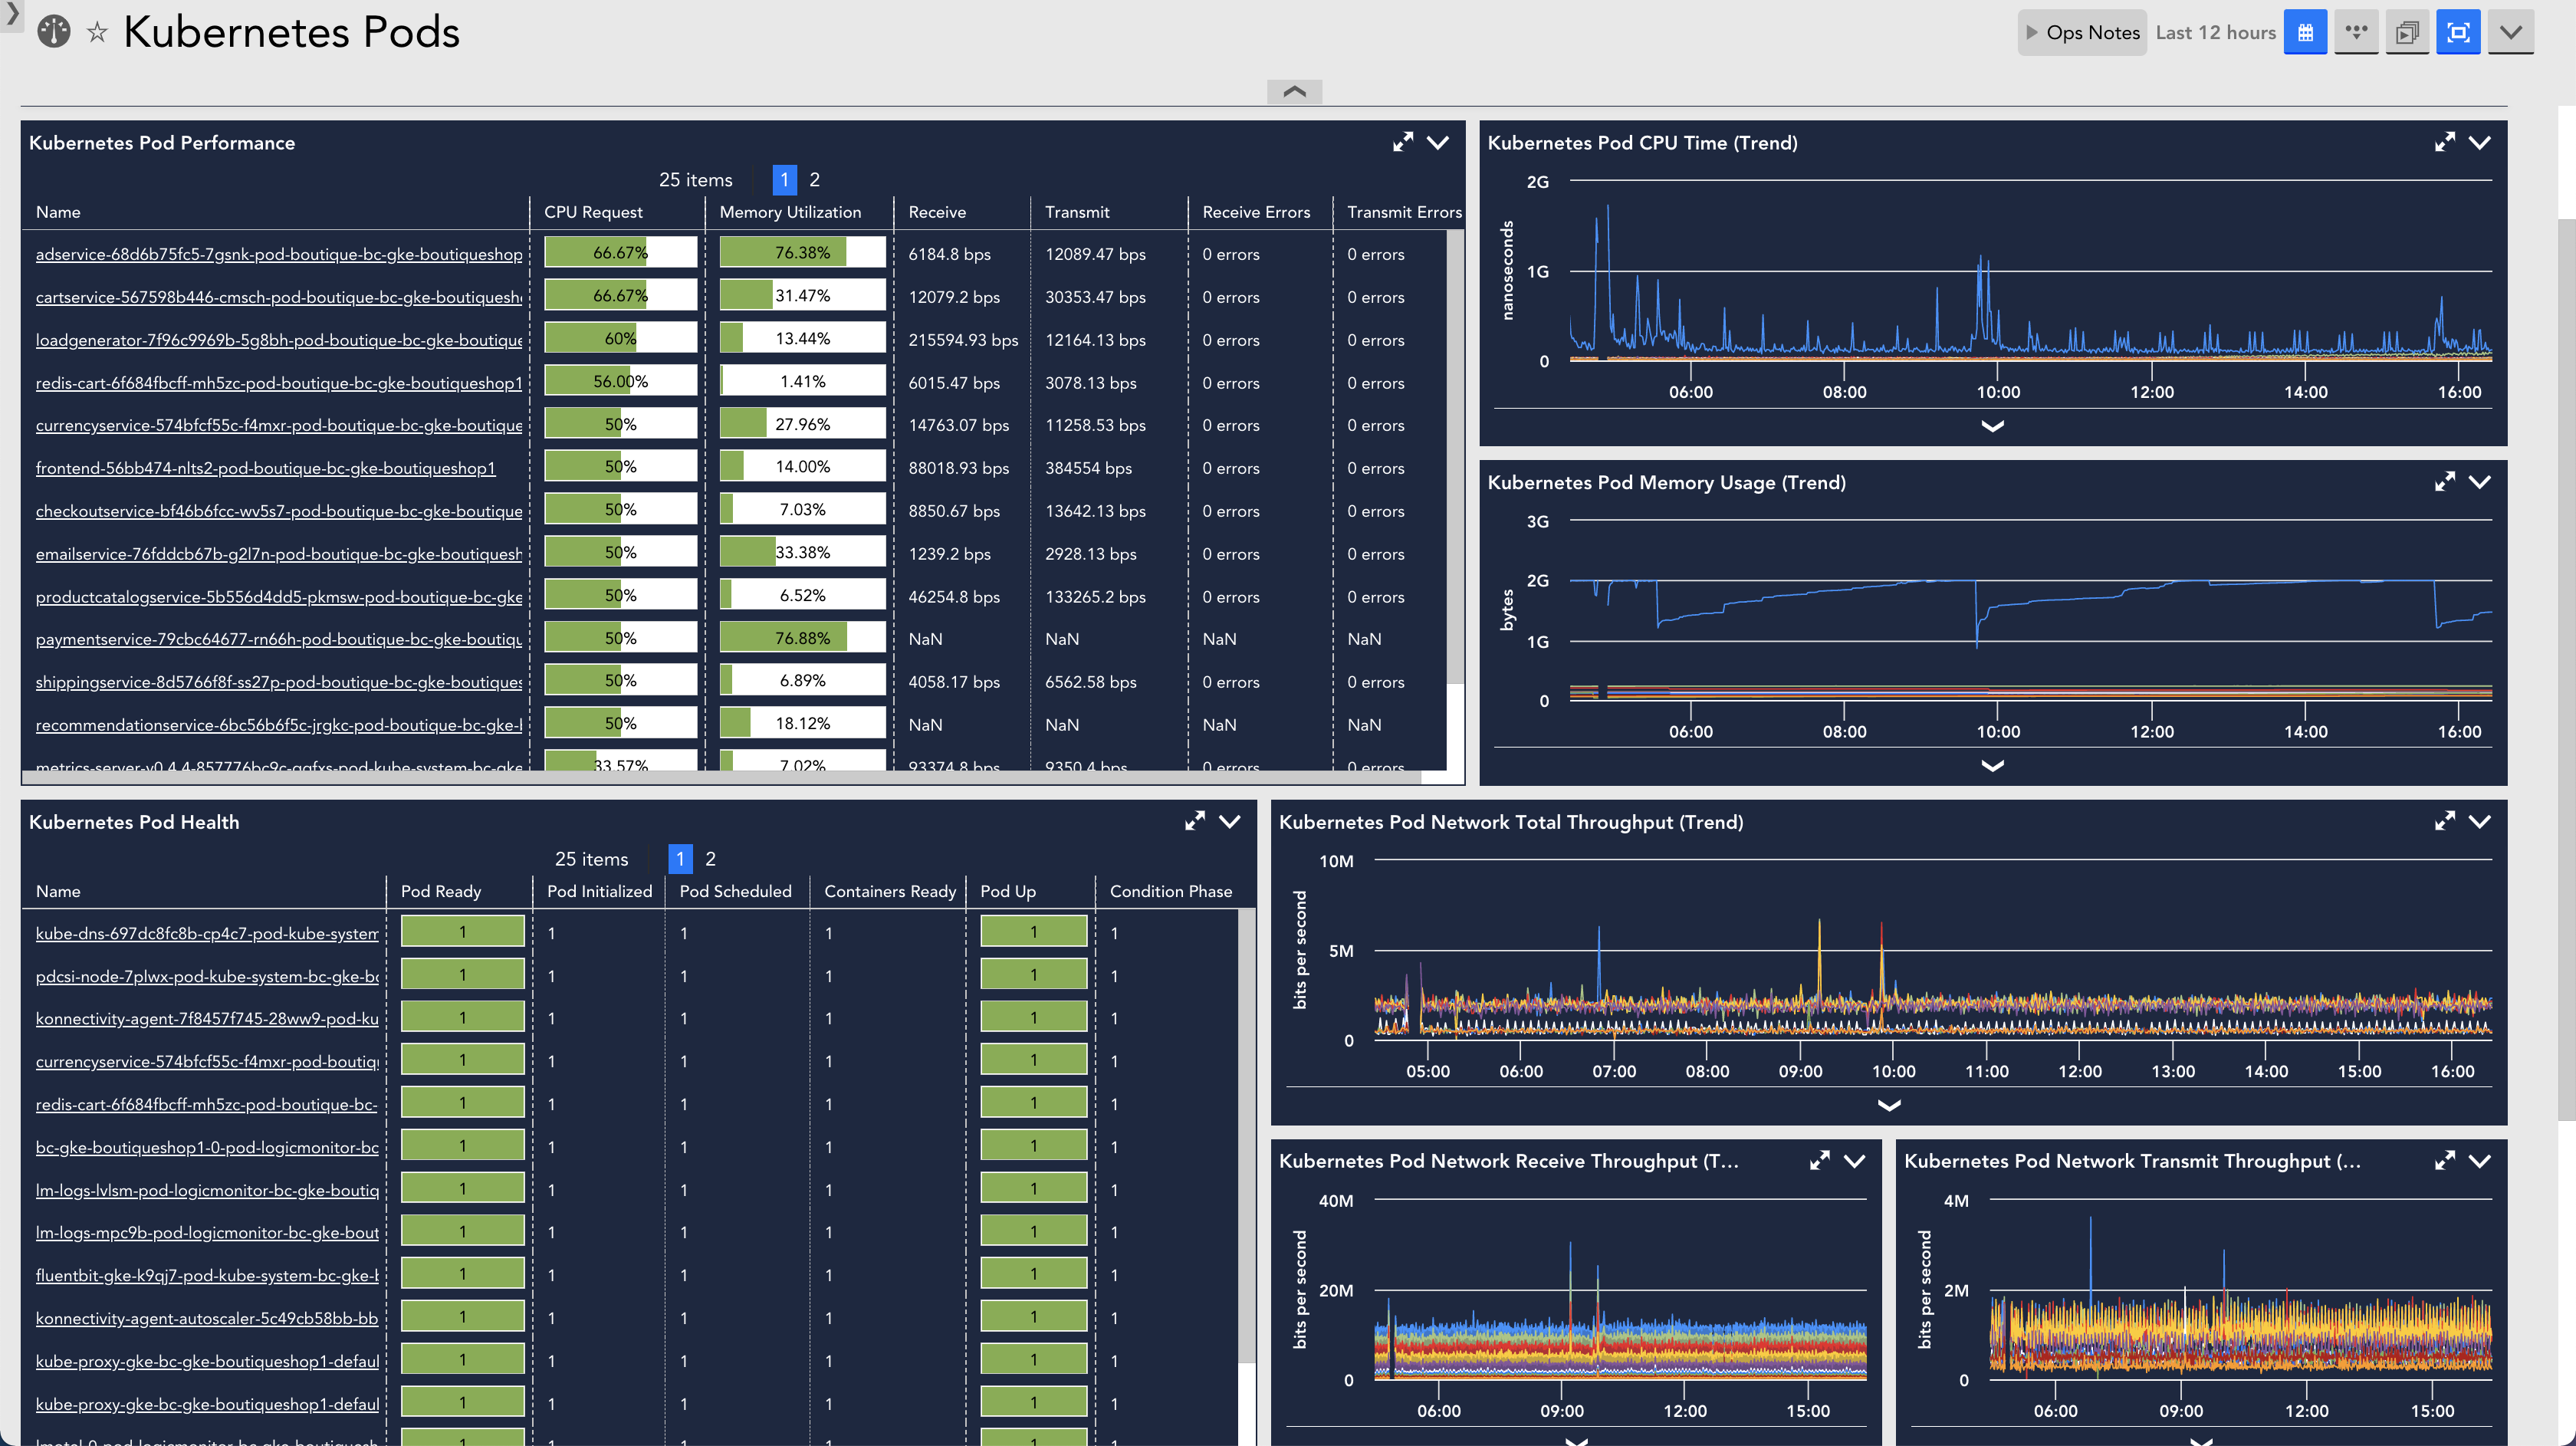
Turn Insight into Applications
Monitoring Kubernetes pod performance gives you a direct line of sight into how your applications are running. With LogicMonitor, experience detailed visibility into key metrics such as CPU, memory usage, network traffic, and disk I/O, so you can understand how your applications are interacting with and utilizing resources.
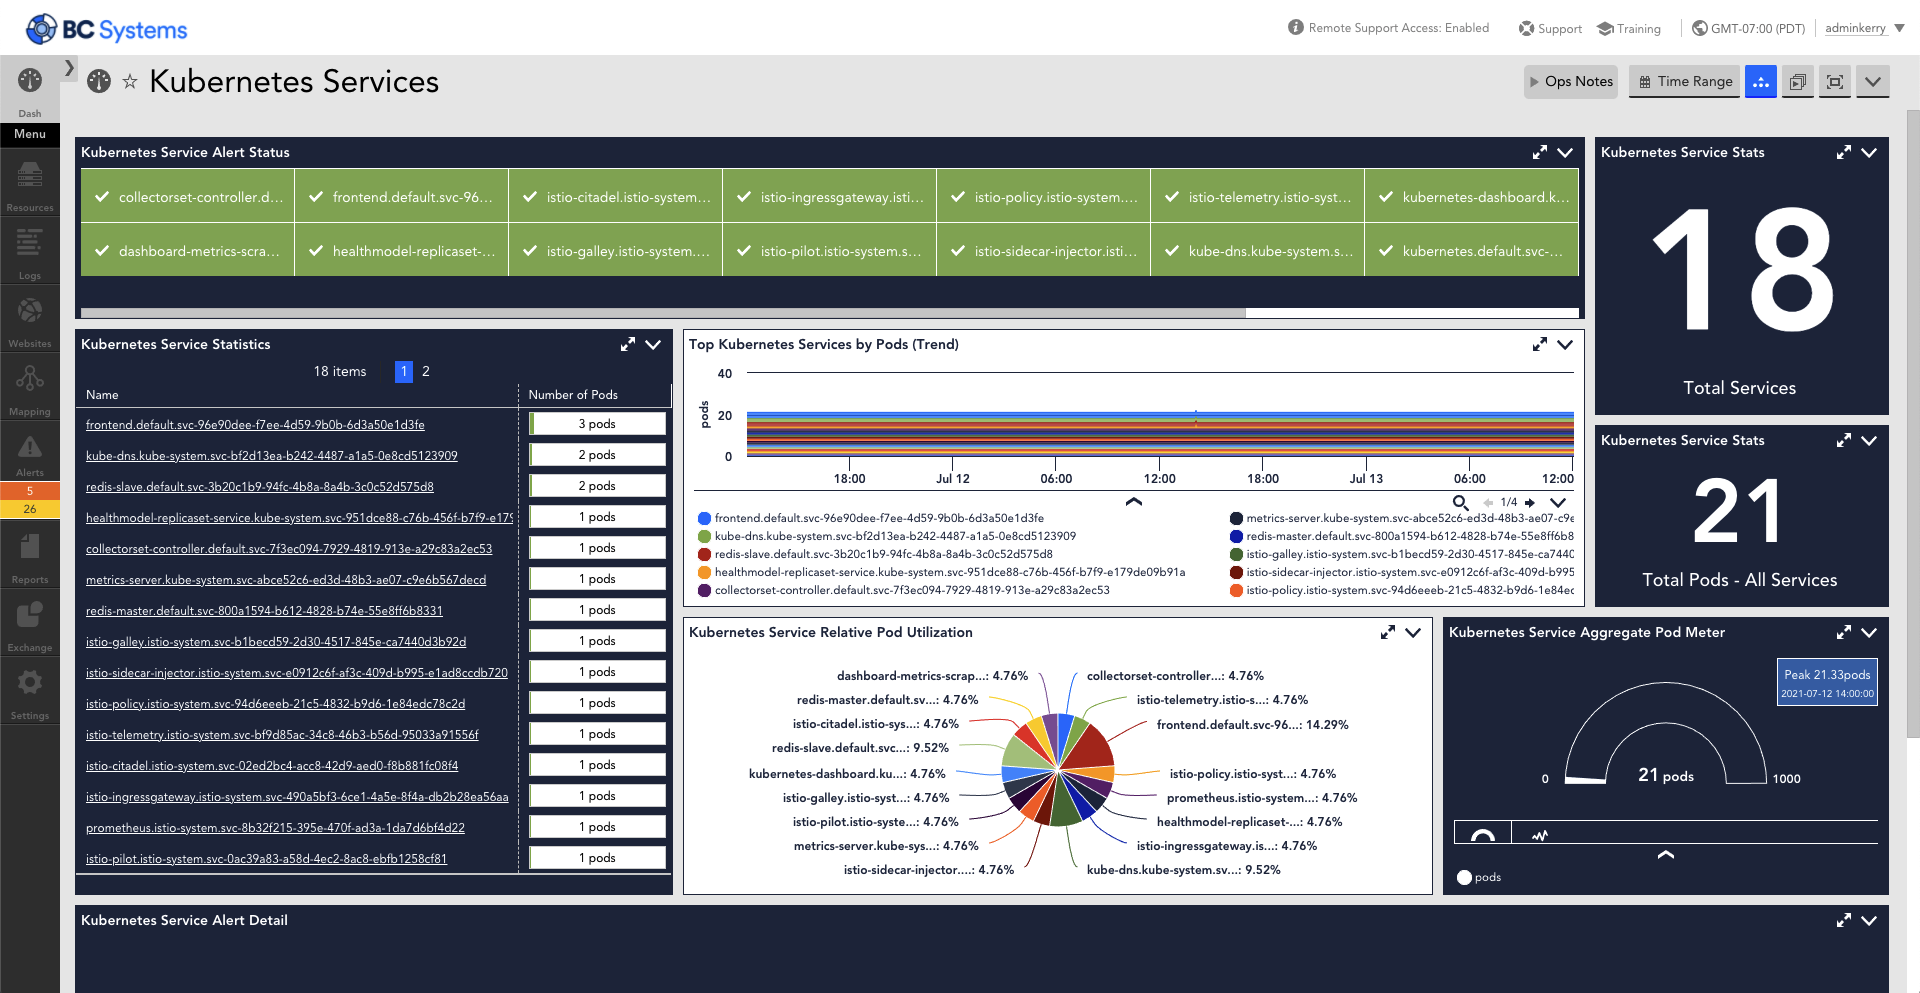
Intelligent Alerting
Unlock the power of proactive problem-solving with LogicMonitor’s Intelligent Alerts for Kubernetes. The LogicMonitor platform leverages machine-learning-driven technology to predict potential issues, reducing noise and allowing your teams to act before a minor hiccup becomes a major outage. Experience the new standard in alerting precision, streamlining your operations and enhancing focus on mission-critical tasks.
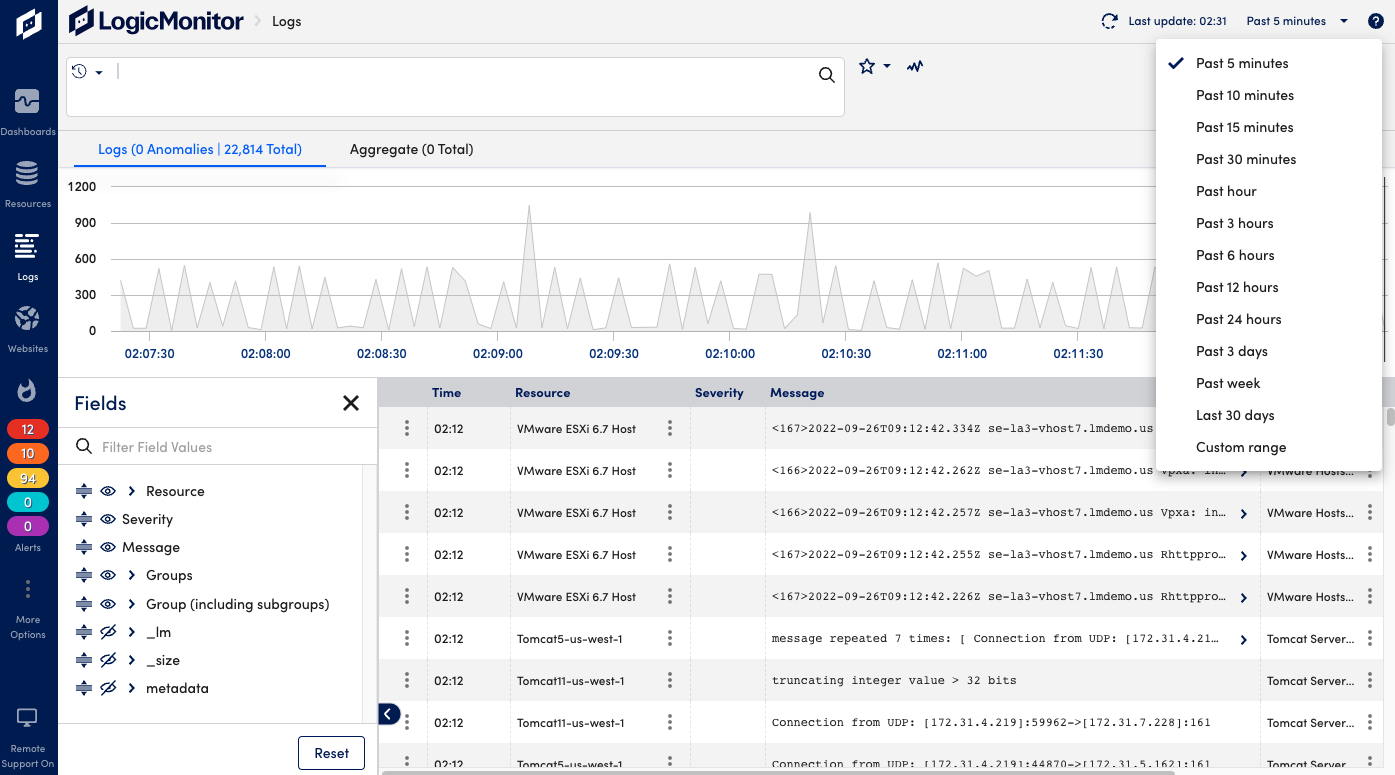
Kubernetes logging made easy
Empower your operational agility with LogicMonitor’s comprehensive log management for Kubernetes. Harness the strength of integrated logs to gain granular visibility into your environment, leading to quicker root-cause analysis and swift issue resolution. With LogicMonitor, every log becomes a powerful insight, accelerating your workflow and elevating your monitoring game to new heights.
Additional Kubernetes Reading
Networking and Kubernetes: A Layered Approach
eBook
The Comprehensive Kubernetes Glossary
Blog
A Guide to Kubernetes Certifications
Blog
Observing Kubernetes With LM Logs
Blog
What Is Kubernetes Pod Disruption?
Blog
What Is Helm in Kubernetes?
Blog
Kubernetes vs. Docker
Blog
Sending Kubernetes Logs and Events
Documentation
Filtering Kubernetes Resources using Labels, Annotations, and Selectors
Documentation
Istio Kubernetes Monitoring
Documentation
Monitoring Kubernetes Clusters with kube-state-metrics
Documentation
LogicMonitor’s Kubernetes Monitoring Overview
Documentation
Adding Kubernetes Cluster into Monitoring
Documentation
Adding Kubernetes Cluster into Monitoring as Non-Admin User
Documentation
Troubleshooting Kubernetes Monitoring
Documentation
Configurations for Ingress Resource for OpenTelemetry Collector Kubernetes Installation
Documentation
Automatic Instrumentation using the OpenTelemetry Operator for Applications in Kubernetes
Documentation
Retaining Deleted Kubernetes Resources
Documentation
Upgrading Kubernetes Monitoring Applications
Documentation