

MongoDB
LogicMonitor can proactively monitor your MongoDB servers and clusters, giving you predefined alert thresholds to help ensure the health, performance and availability of your service.
But more than that, LogicMonitor is easily extended to parse the JSON output of any Mongo query, so you can quickly add trending and alerting for any metric you can query from Mongo. Additionally, you can combine metrics using LogicMonitor’s built in expressions or use Groovy directly within the datasource to calculate, store, graph and alert on whatever you need.
Built in alerts inform you of thresholds being exceeded for bTree miss ratio, percentage of used connections, different classes of asserts, and more.
Just a few of the critical MongoDB metrics we monitor:
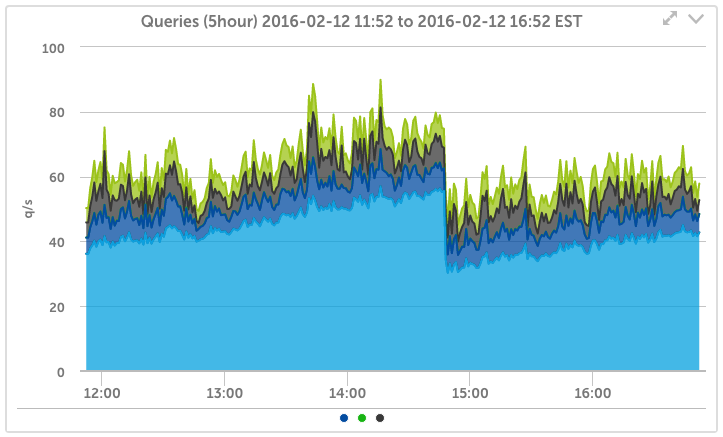
MongoDB Query activity
Track the amount and type of queries over time – see your MongoDB activity increase or change characteristics over time.
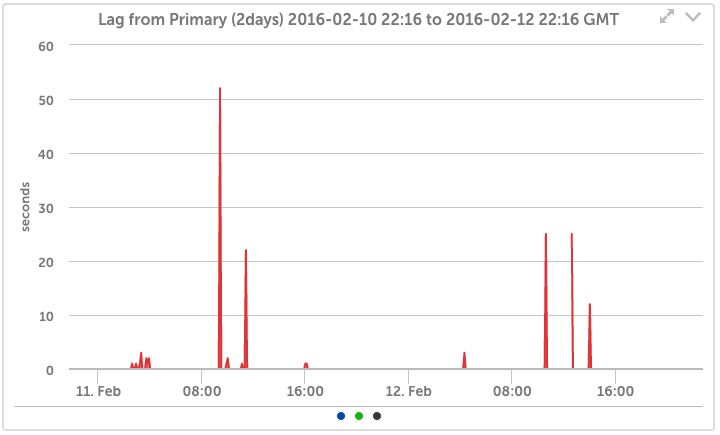
MongoDB Replication Monitoring
Automatically discover all replicas and arbiters, track their lag, health, and other metrics.
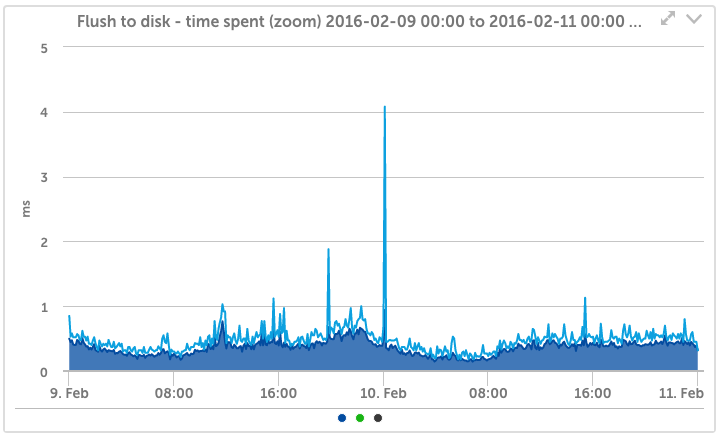
MongoDB Flush Time
Track the time spent flushing to disk. Know whether you are overloading the IO system of the Primary or Secondaries.
Cluster Wide views
Easily generate cluster wide views of all operations across all replicas, and much more.