
MySQL
Harness the power of insights, automation, and proactive alerting to ensure your MySQL instances are operating at their peak, around the clock. As MySQL databases handle upwards of thousands of queries per second for business-critical or customer-facing applications, it is imperative to have a proactive MySQL monitoring strategy in place.

Agentless and comprehensive coverage in minutes.
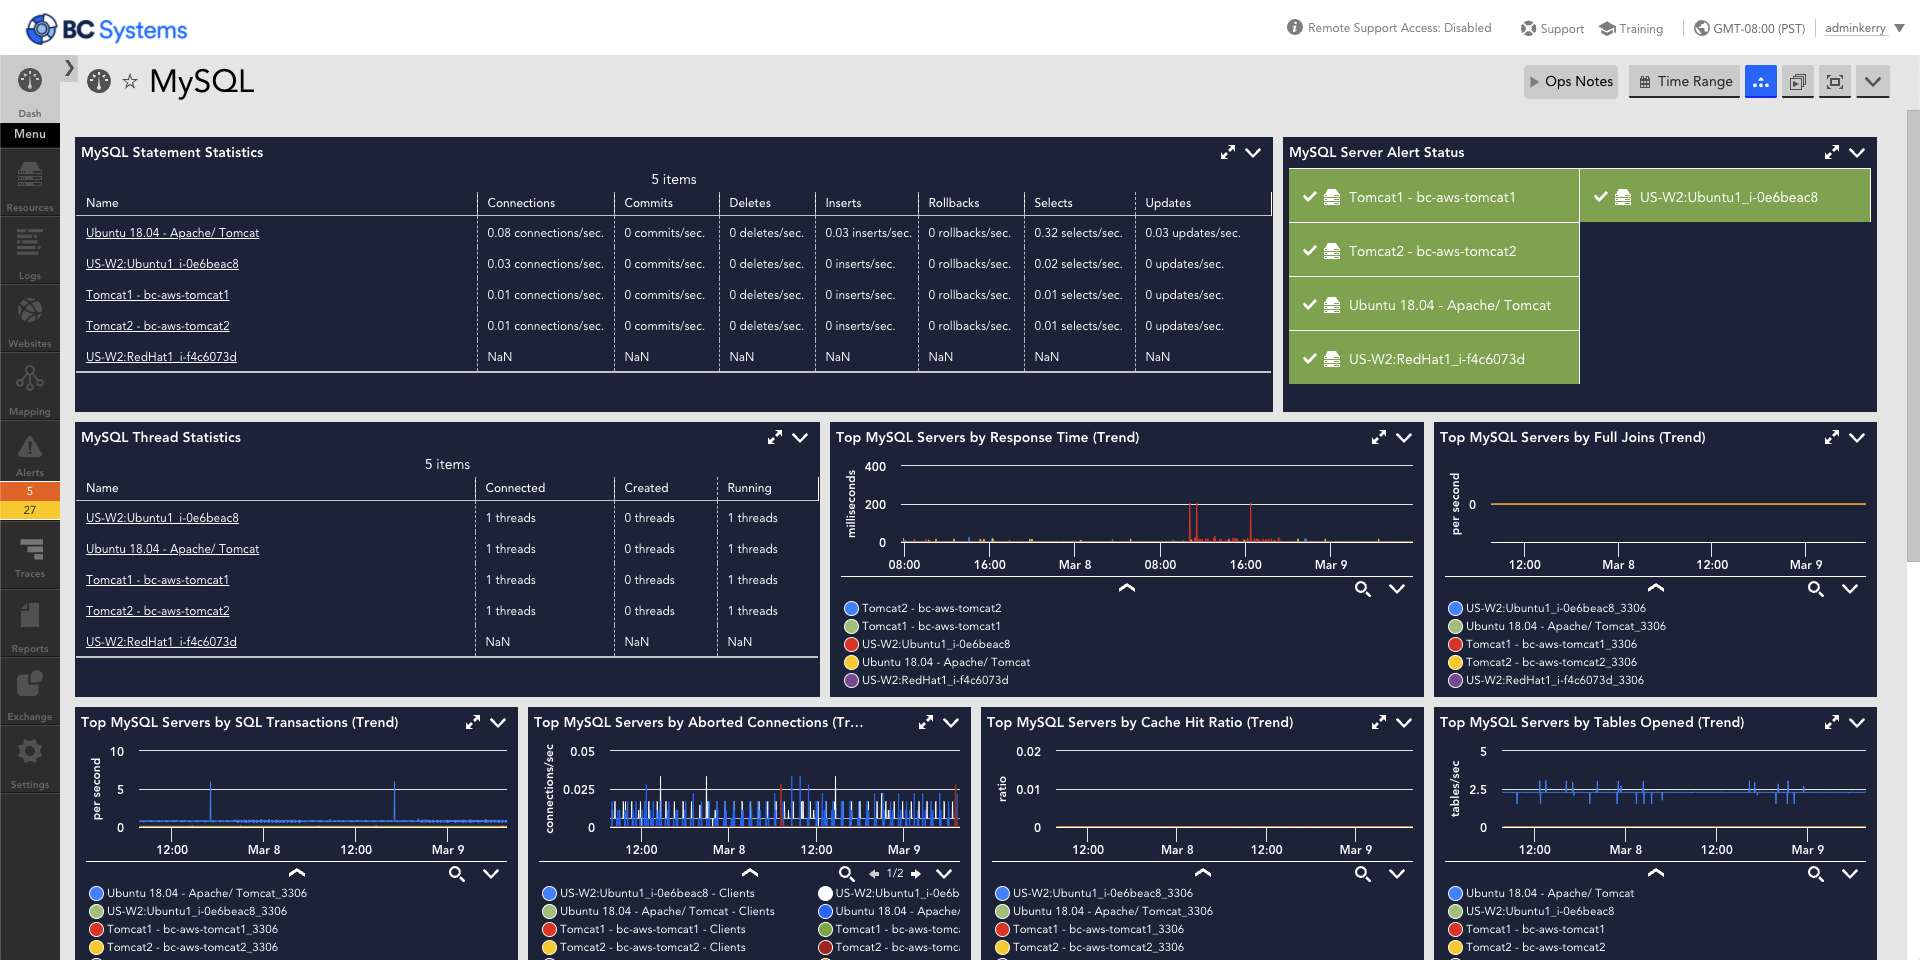
LogicMonitor’s agentless data collection will automatically detect running MySQL databases and monitor critical metrics such as transaction-rates, blocks, and table-scans. Out-of-the-box dashboards allow you to identify outliers and surface performance anomalies quickly.
LogicMonitor’s flexible LogicModules allow you to input and track any SQL query over time, elevating your monitoring system into a valuable business-intelligence platform.
Deploy Anywhere. Visibility Everywhere.
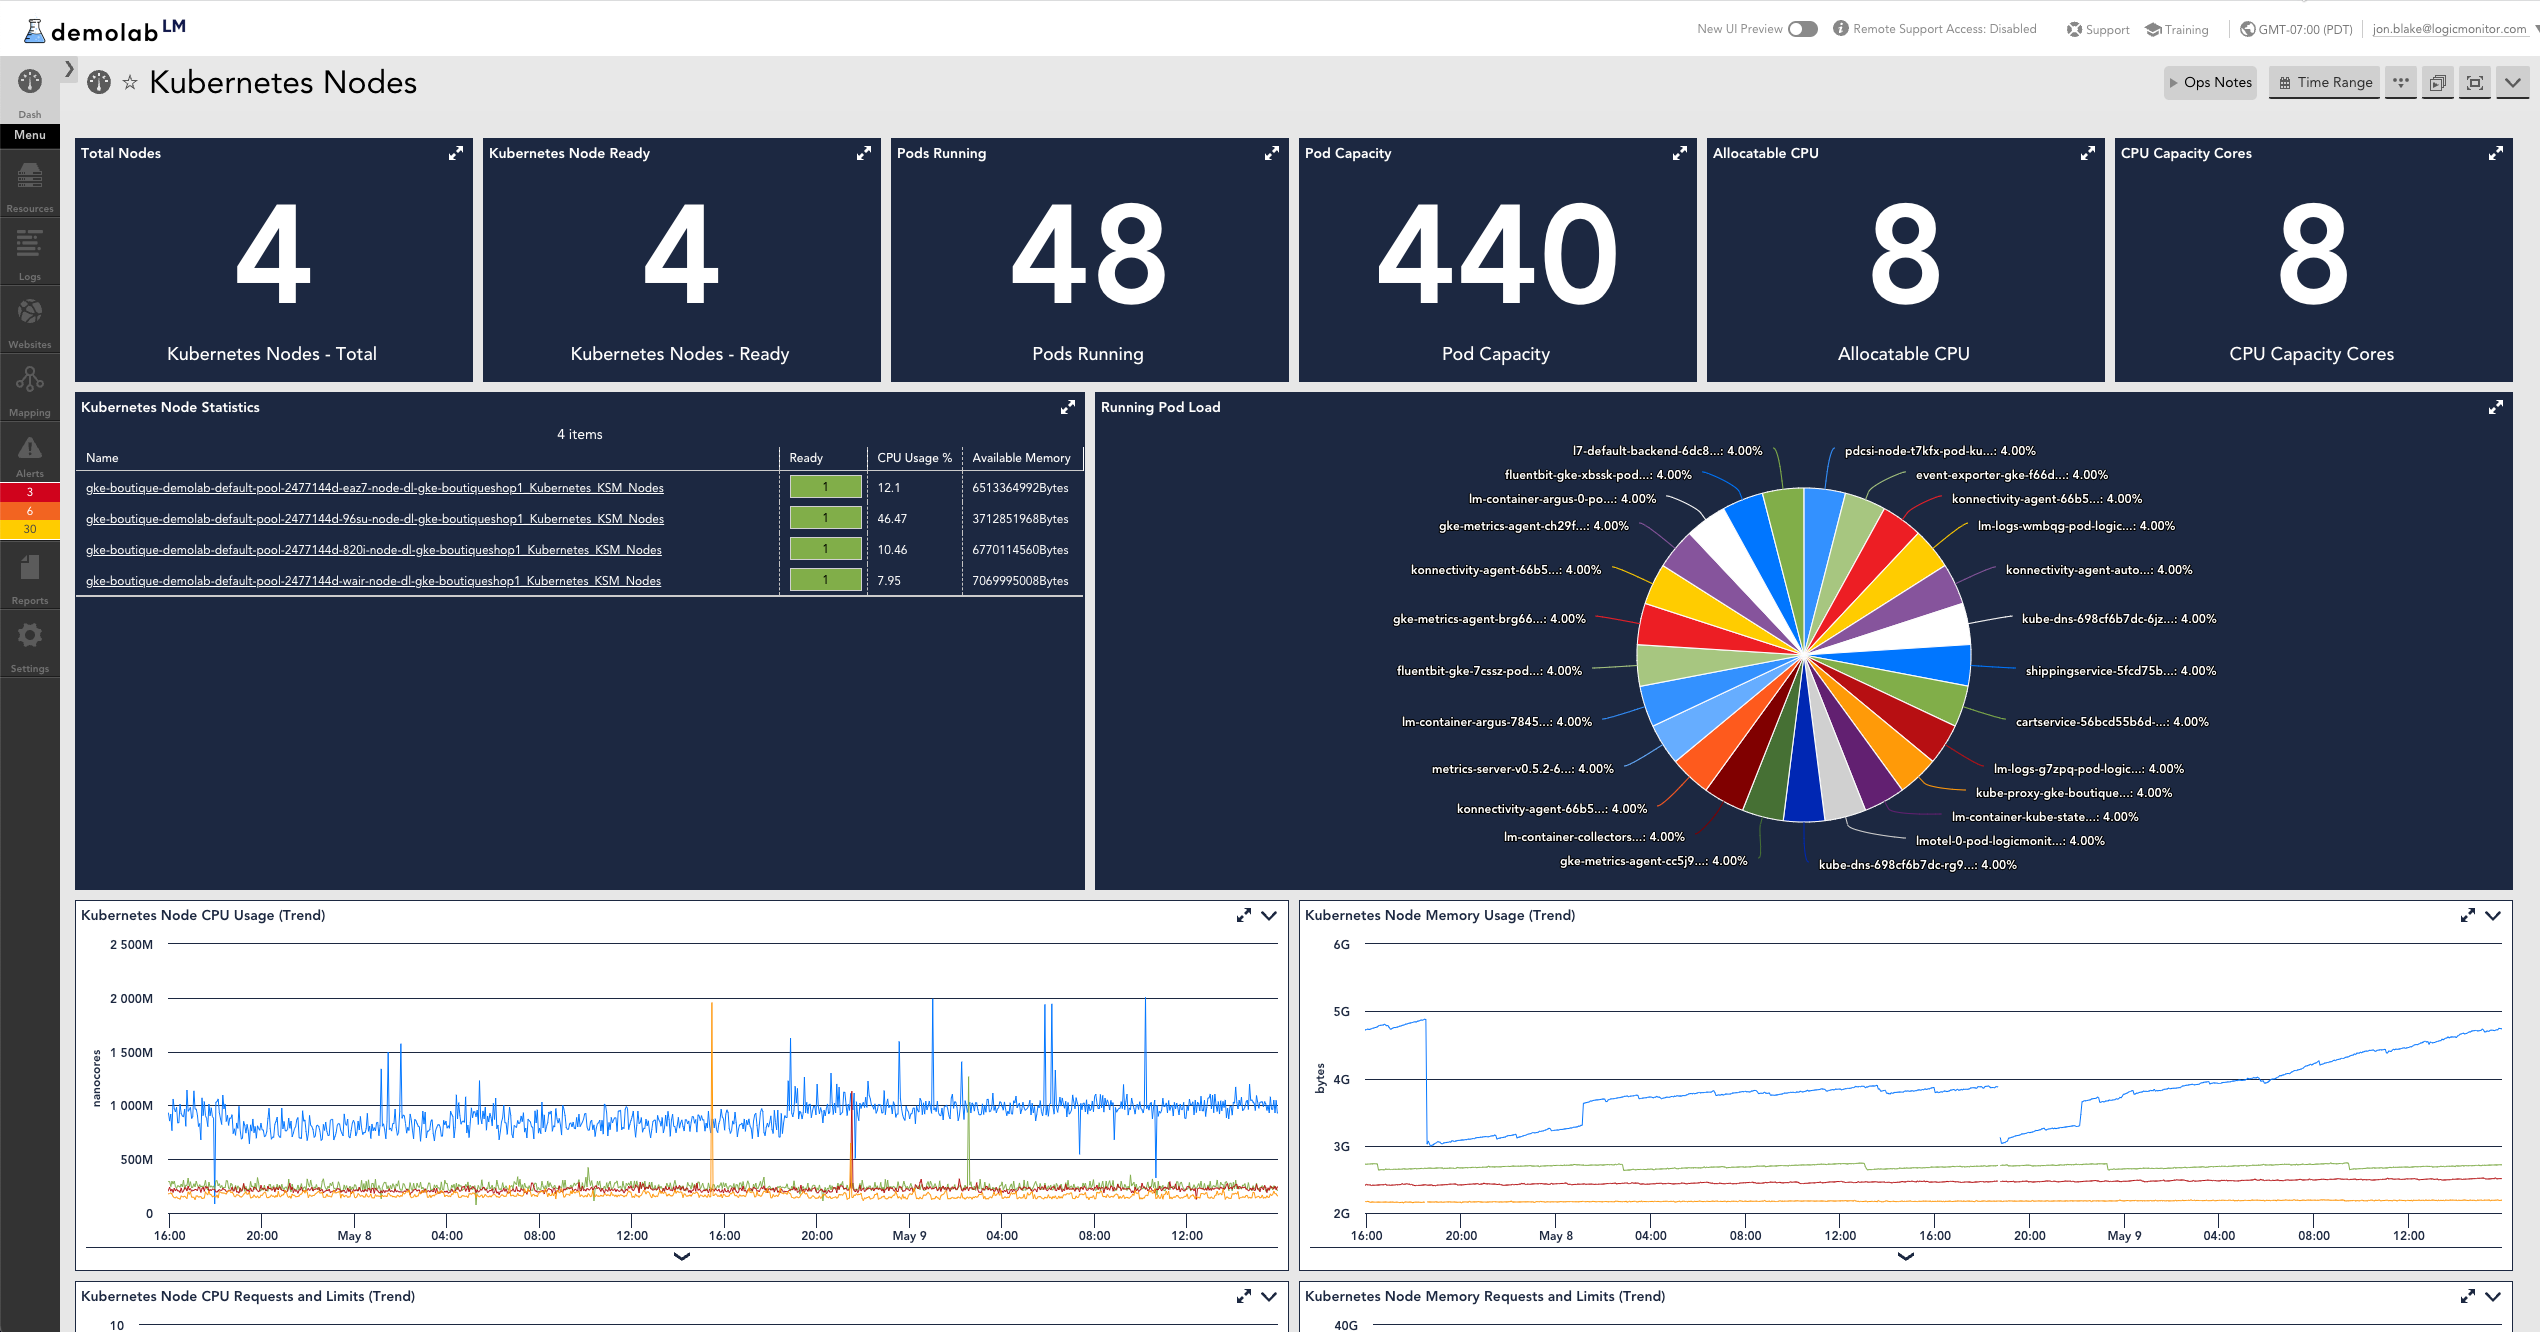
LogicMonitor provides the same granular performance monitoring to your MySQL databases, regardless of how they’re deployed – whether on virtual machines in the data center, PaaS instances in the cloud, or as containers in your Kubernetes Clusters.
Historic trends inform capacity-planning
LogicMonitor can use up to two-years of non-aggregated metrics to accurately forecast database capacity and performance. Data forecasting helps you identify seasonality and trends to stay ahead of bottlenecks and incidents.
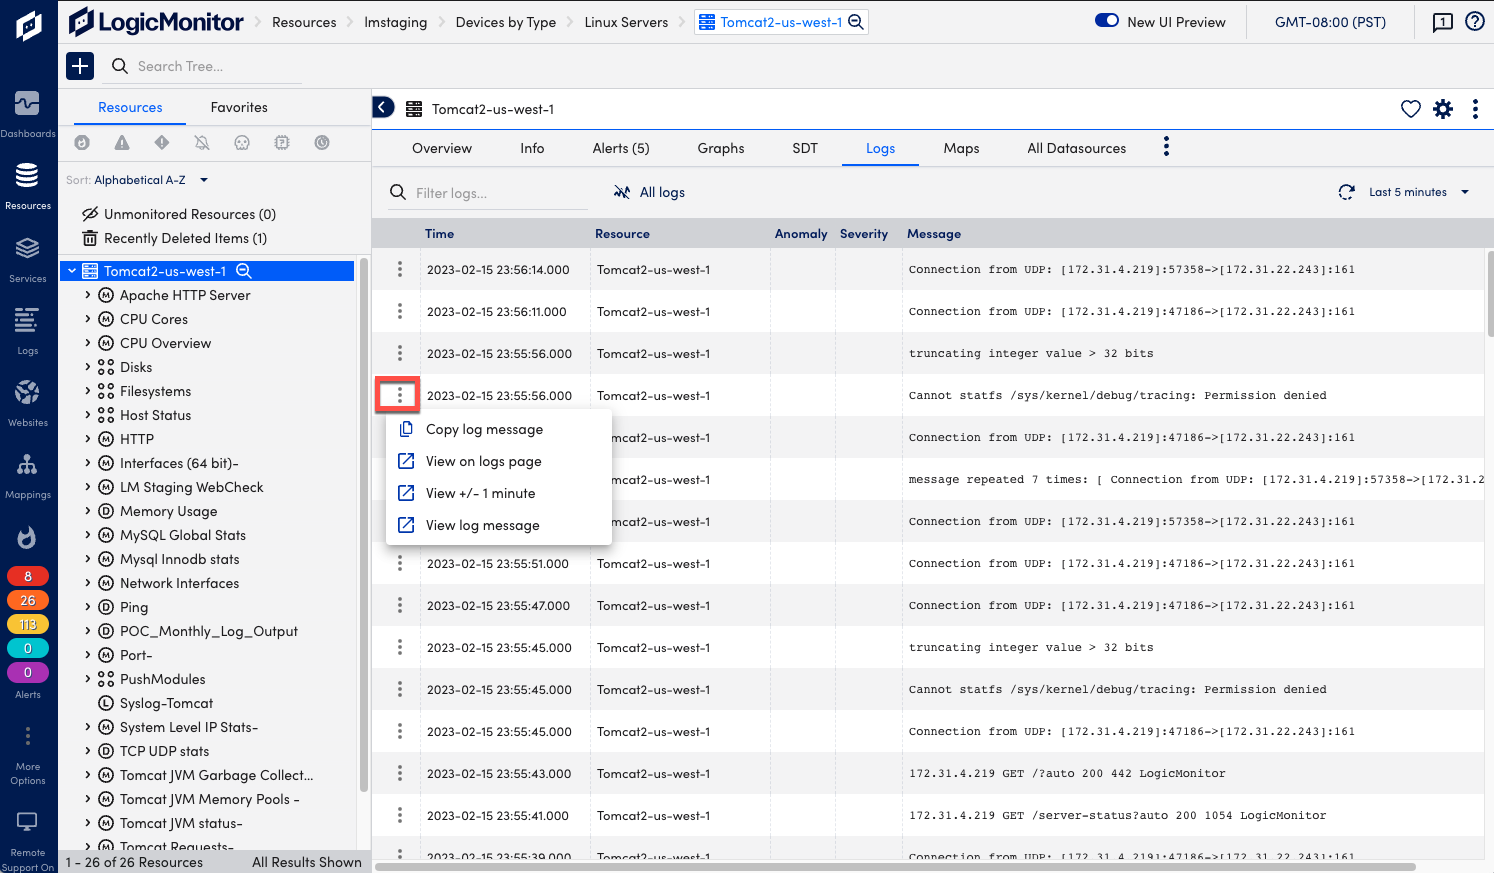
LogicMonitor’s logging capabilities highlight the differences between trends and anomalies, so you can optimize faster.
Proactive alerting
LogicMonitor’s advanced machine-learning algorithms will alert you to irregular behavior on your MySQL instances while also reducing alert-noise from recognized norms.
Predictive analytics helps preempt potential issues before they impact operations, ensuring databases stay resilient, agile, and consistently high-performing.
Just a few of the critical MySQL metrics we monitor:
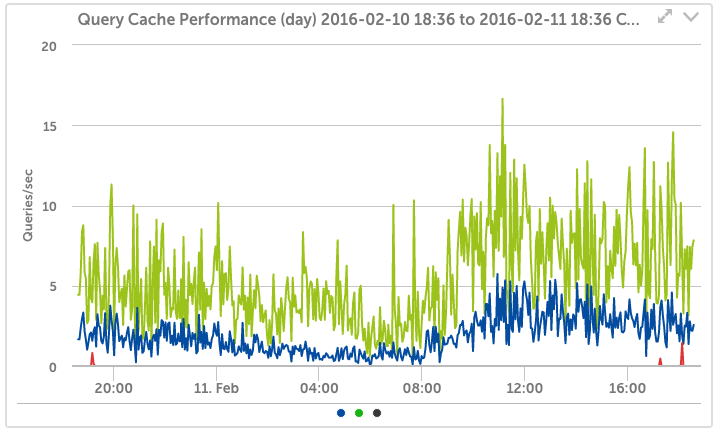
MySQL Query Cache
One of the more important elements for database tuning, LogicMonitor tracks your query cache hit ratio, and trends the activity. LogicMonitor’s intelligent multi-variable alerts can analyze and recommend different tuning options for the query cache – enlarging it, reducing it, or disabling it, in response to your usage.
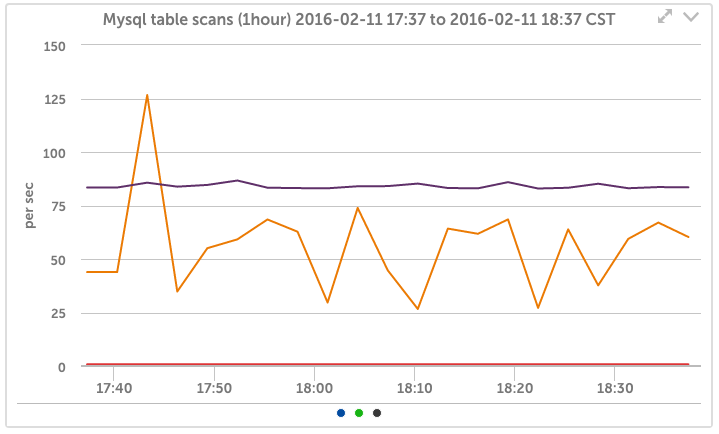
MySQL Tablescans
An essential metric to trend over time – watching your table scan rates can tell you whether indexes are being used effectively, or whether the new application your team released is slowing the database due to the spike in table scans.
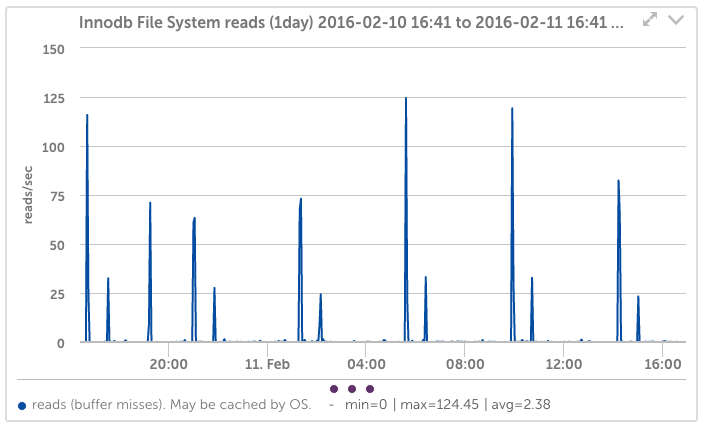
LogicMonitor will detect the storage engines in use and track detailed statistics. Being able to see trends in “InnoDB buffer cache misses over time” is essential for proper MySQL tuning. LogicMonitor even detects if you are using the Percona builds of InnoDB and adds monitoring for that.