

NetApp Data ONTAP
For maximum storage capacity and data accessibility, NetApp Data ONTAP uses a hybrid internal environment that leverages both hard disk and flash memory as well as storage virtual machines (SVMs) running within hardware clusters.
Even with such a complex environment, LogicMonitor seamlessly provides comprehensive performance metrics across the entire storage array, including:
- Every active interface
- Total CPU usage, disk activity, IO per second, cache age, consistency point activity
- SnapMirror Lag and health status
- Per volume space, inode and snapshot utilization
- Network and cluster interconnect throughput and latency
- Per volume read and write latency, IO operations per second and throughput
- Health checks for disk, fan and power supply failures; autosupport success
- LUN queue depth
- And more
Among the most critical metrics we provide are:
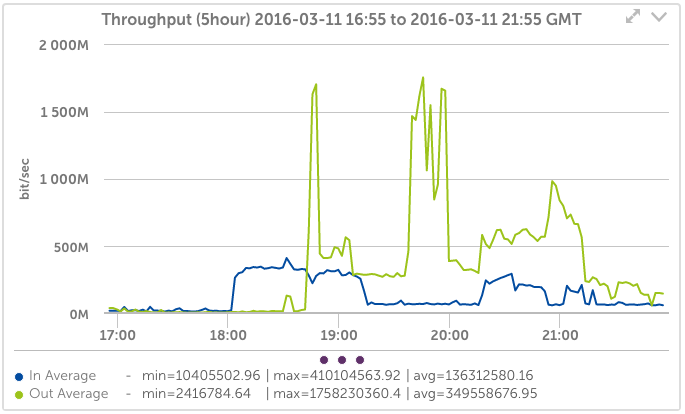
Cluster Interconnect Throughput:
Each NetApp Data ONTAP comprises up to 24 individual nodes (storage collectors). Due to the large number of nodes and high volume of information that passes between them, it is important to measure throughput for each individual node so you can identify the source of any slow performance.
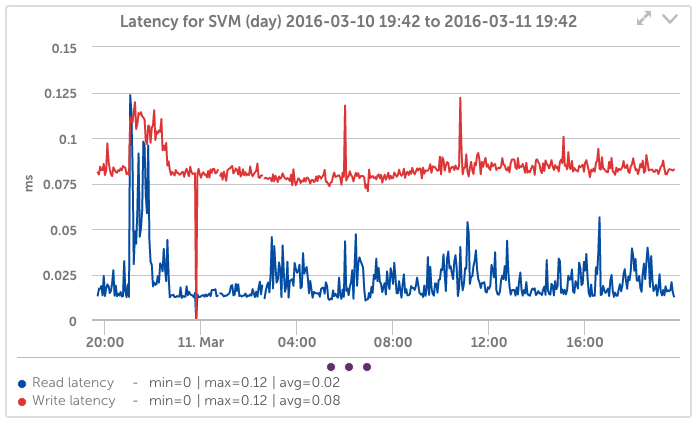
Latency for Storage Virtual Machines (SVMs):
Endusers of Data ONTAP access their stored data via SVMs. So, even if your nodes are performing at maximum efficiency, your ability to retrieve data can still be impaired by a slow VM. LogicMonitor provides instant insight into your SVMs’ latency and throughput.
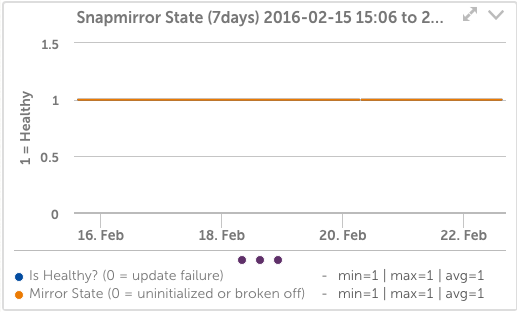
SnapMirror State:
SnapMirror enables redundancy for your data. As such, it is a critical component for your systems’ disaster recovery. LogicMonitor gives an at-a-glance view of SnapMirrors health:
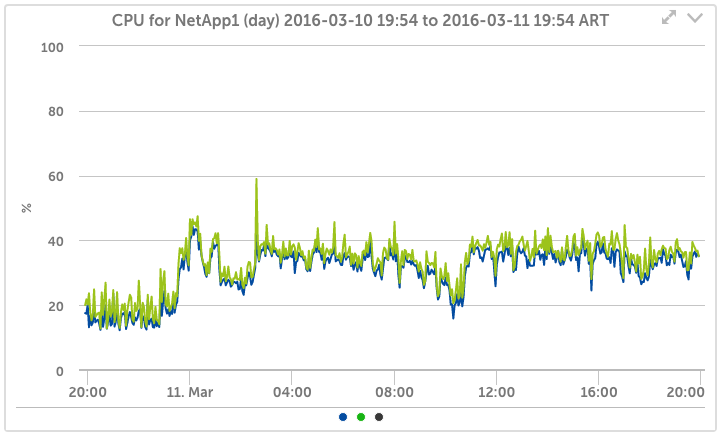
CPU Load:
LogicMonitor provides granular CPU metrics for each of the cluster’s nodes as well as tracking for consistency point and interrupt activity.
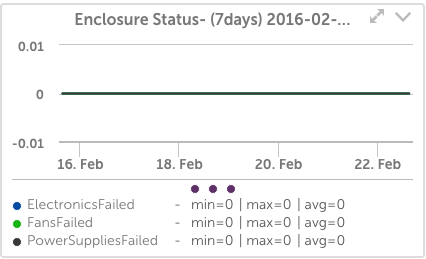
Enclosure Stats:
Collect full performance metrics on all internal power supplies, fans, and electronics to ensure your infrastructure is healthy.
Data is the backbone of any company. You can’t risk losing access to your data or losing the data, itself. With LogicMonitor, you can avoid that risk with the most extensive insights possible into your storage arrays’ health.