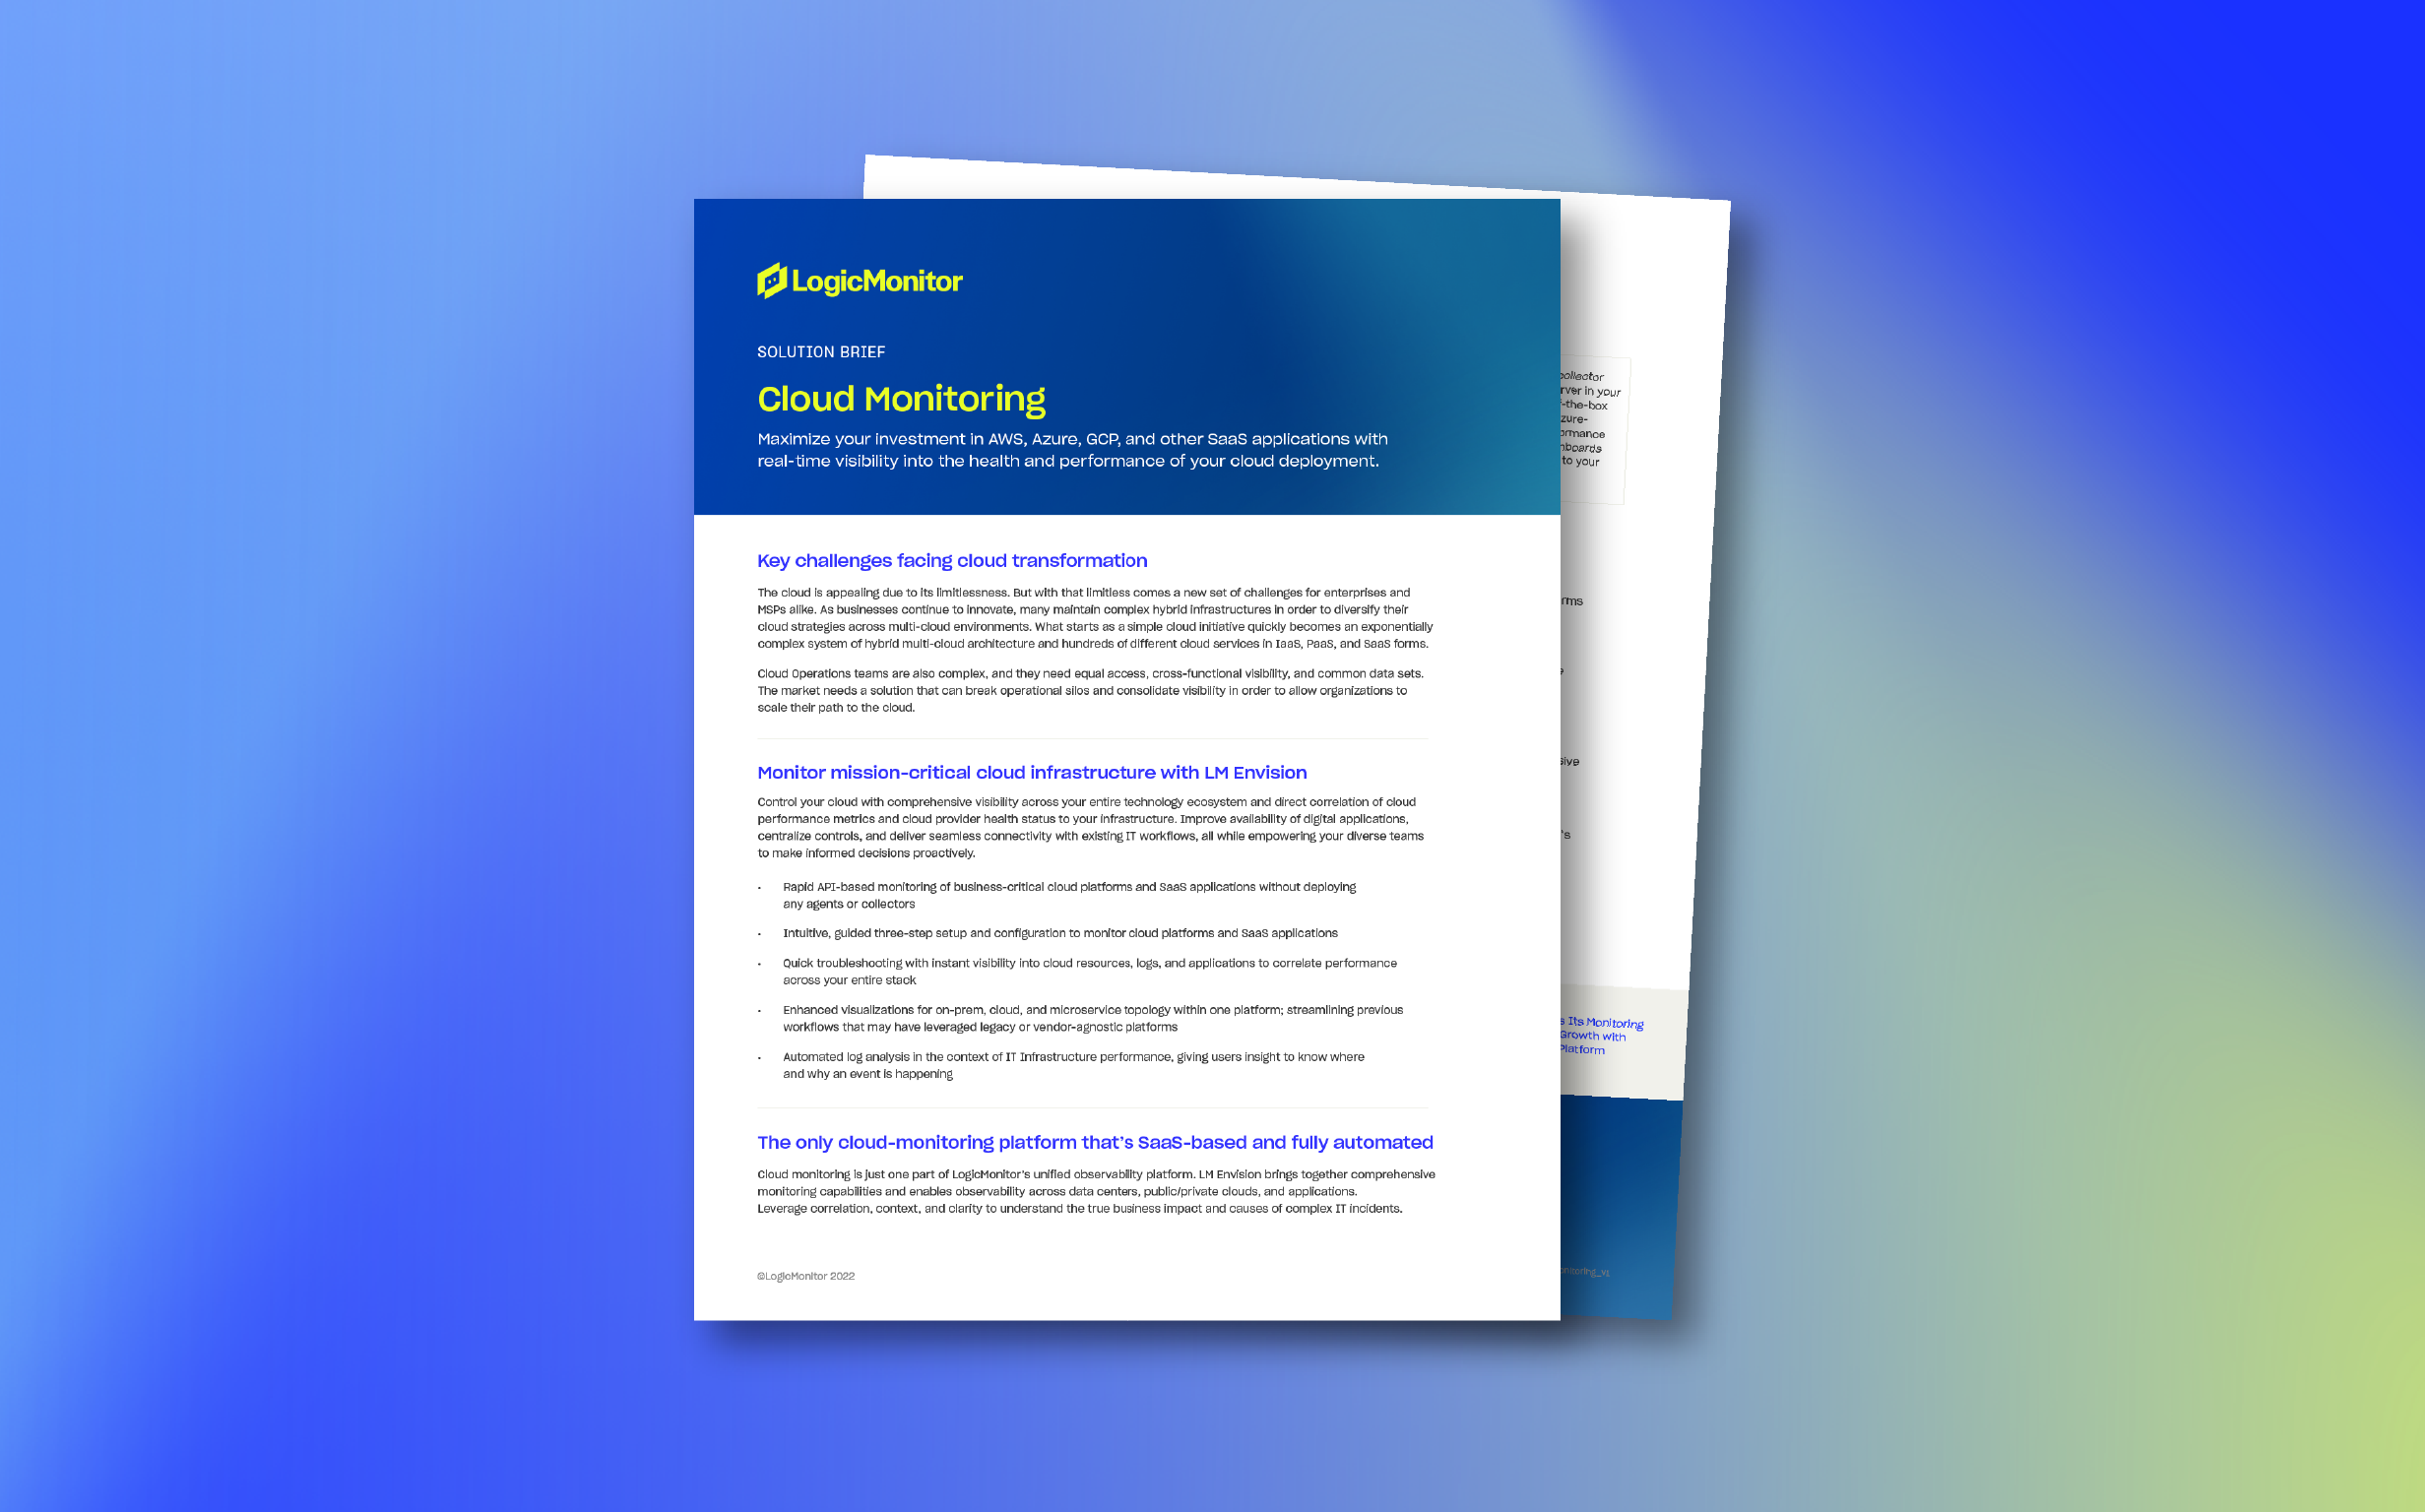
Cloud Monitoring
Monitor while you modernize with unified hybrid multi-cloud observability that scales across your complex ecosystem. Maximize your migration investment in AWS, Azure, and GCP with real-time visibility into the health and performance of your cloud deployments.
Learn more about Resource Explorer and our latest multi-cloud visualization capabilities
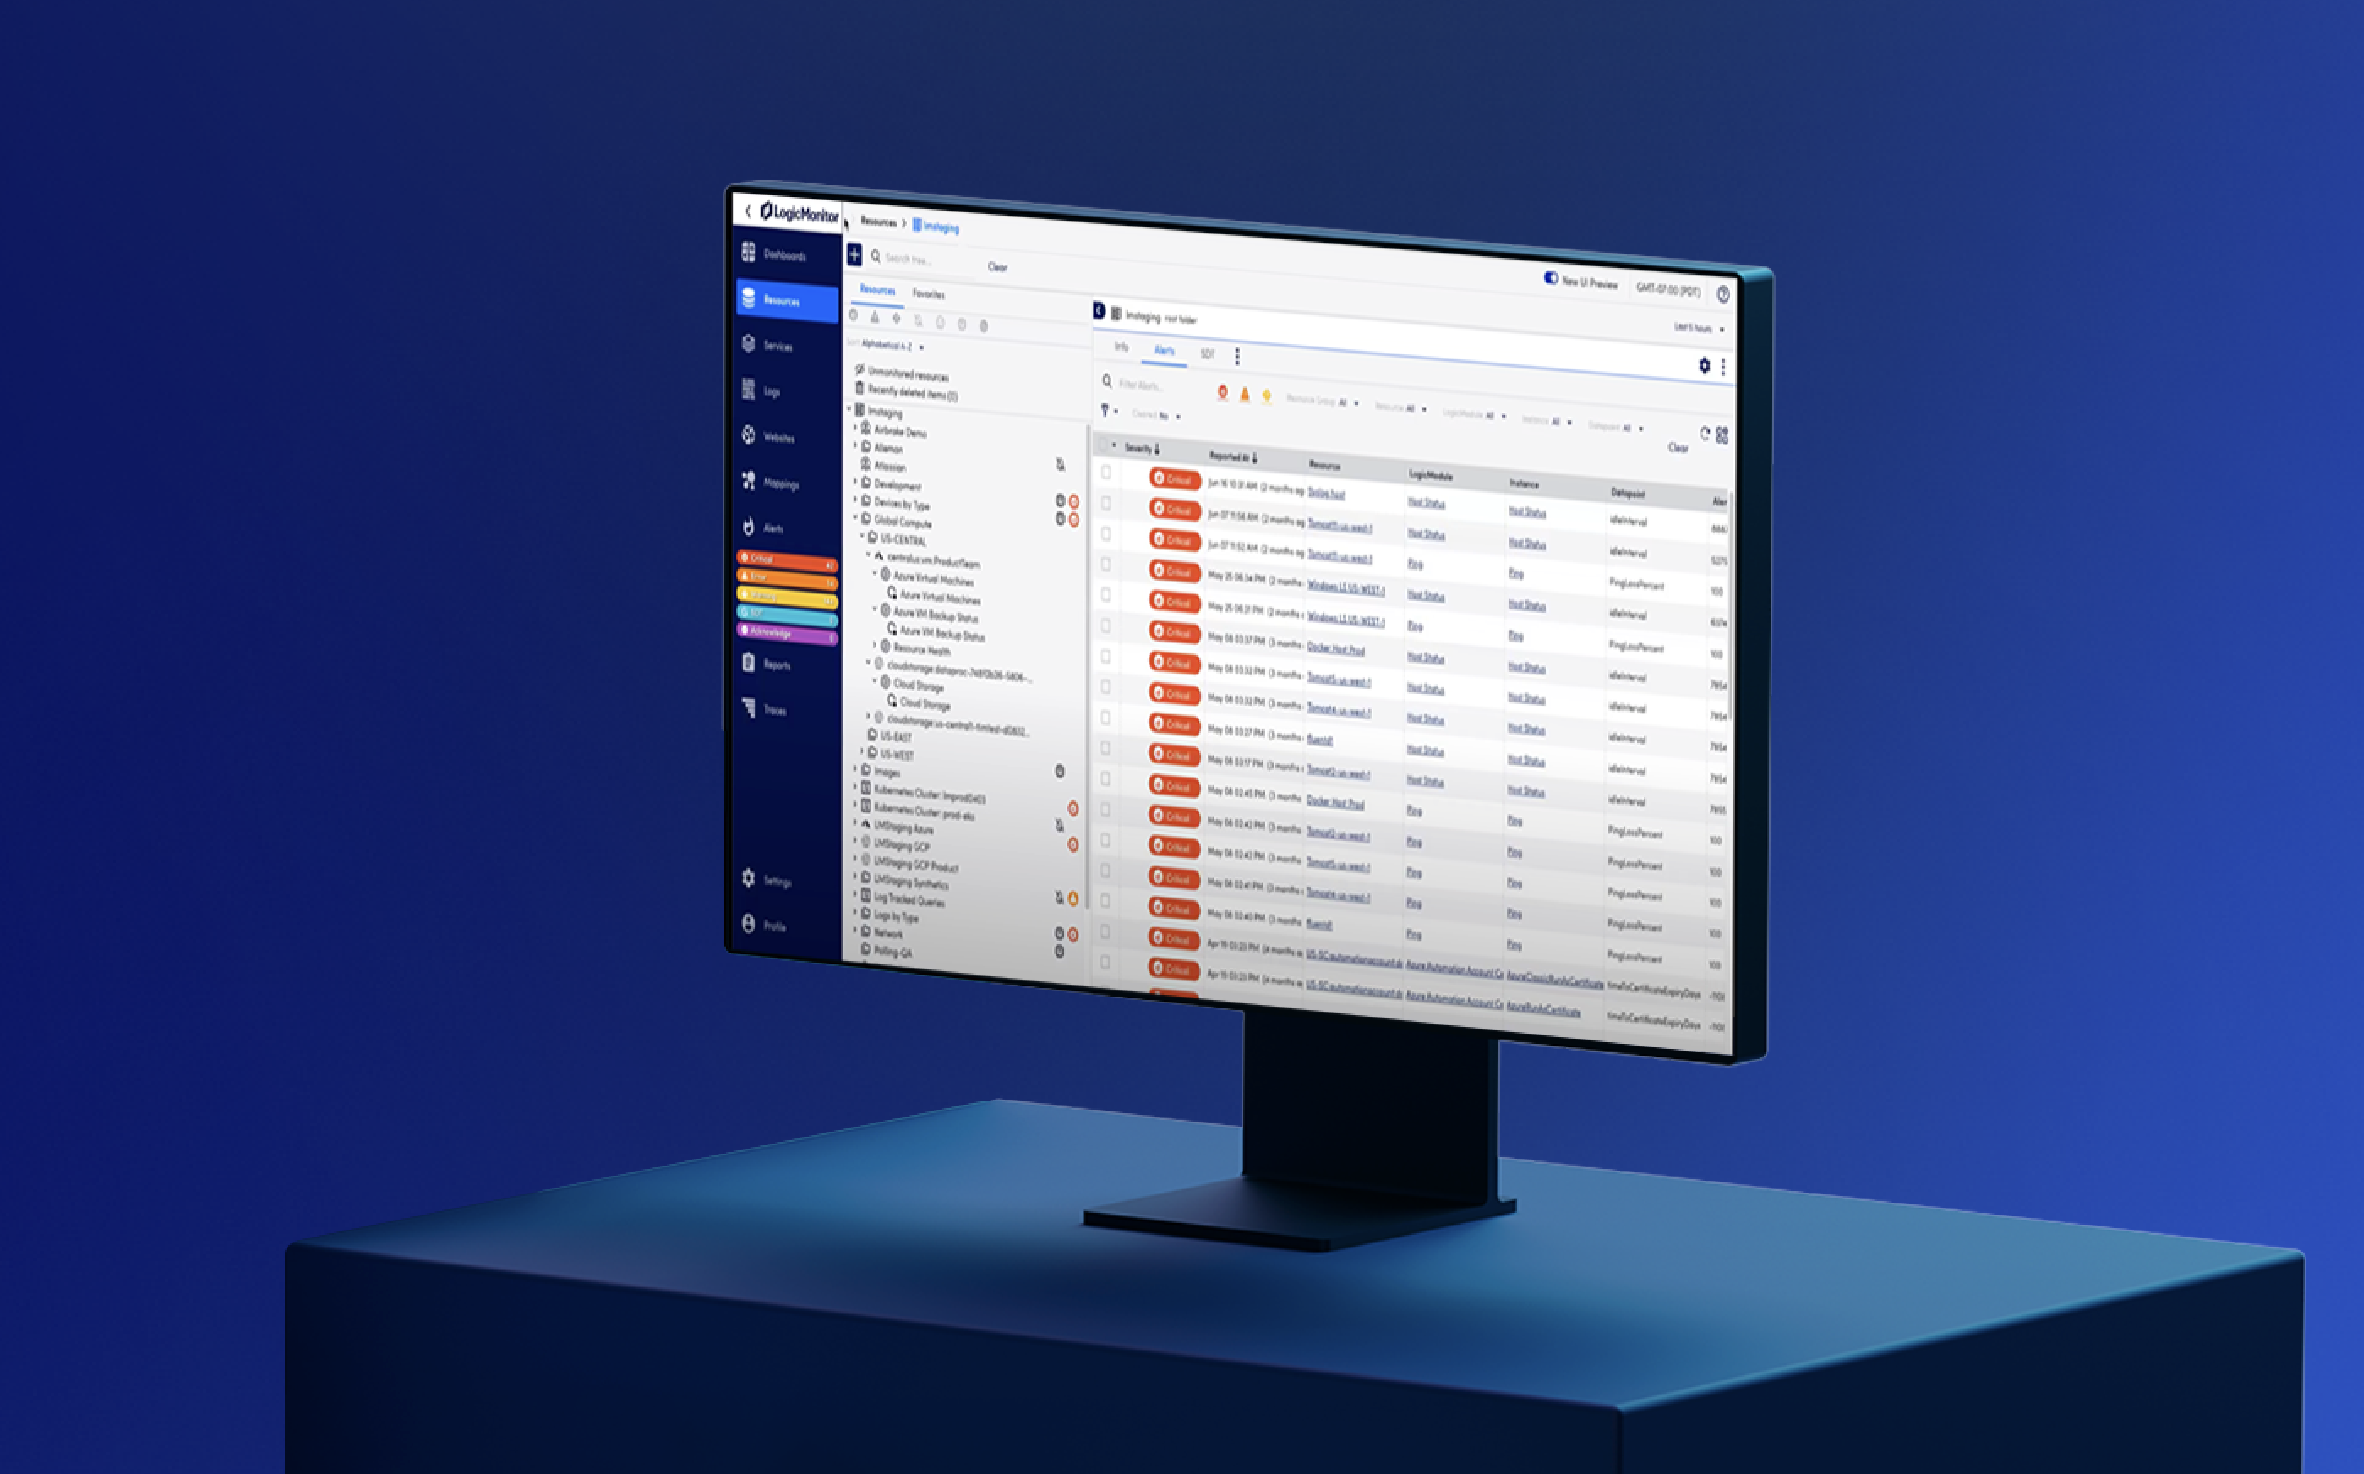
Monitor critical cloud infrastructure and apps
Quickly gain actionable insights from your cloud service provider data. Instantly deploy out-of-the-box dashboards and deep-dive technical insights into AWS, Azure, and GCP, together with on-premises infrastructure in one unified platform. Automatically discover, apply, and scale monitoring for your entire cloud ecosystem in minutes.
Amazon Web Services
Microsoft Azure
Google Cloud Platform
2,000+ Turn Key Integrations
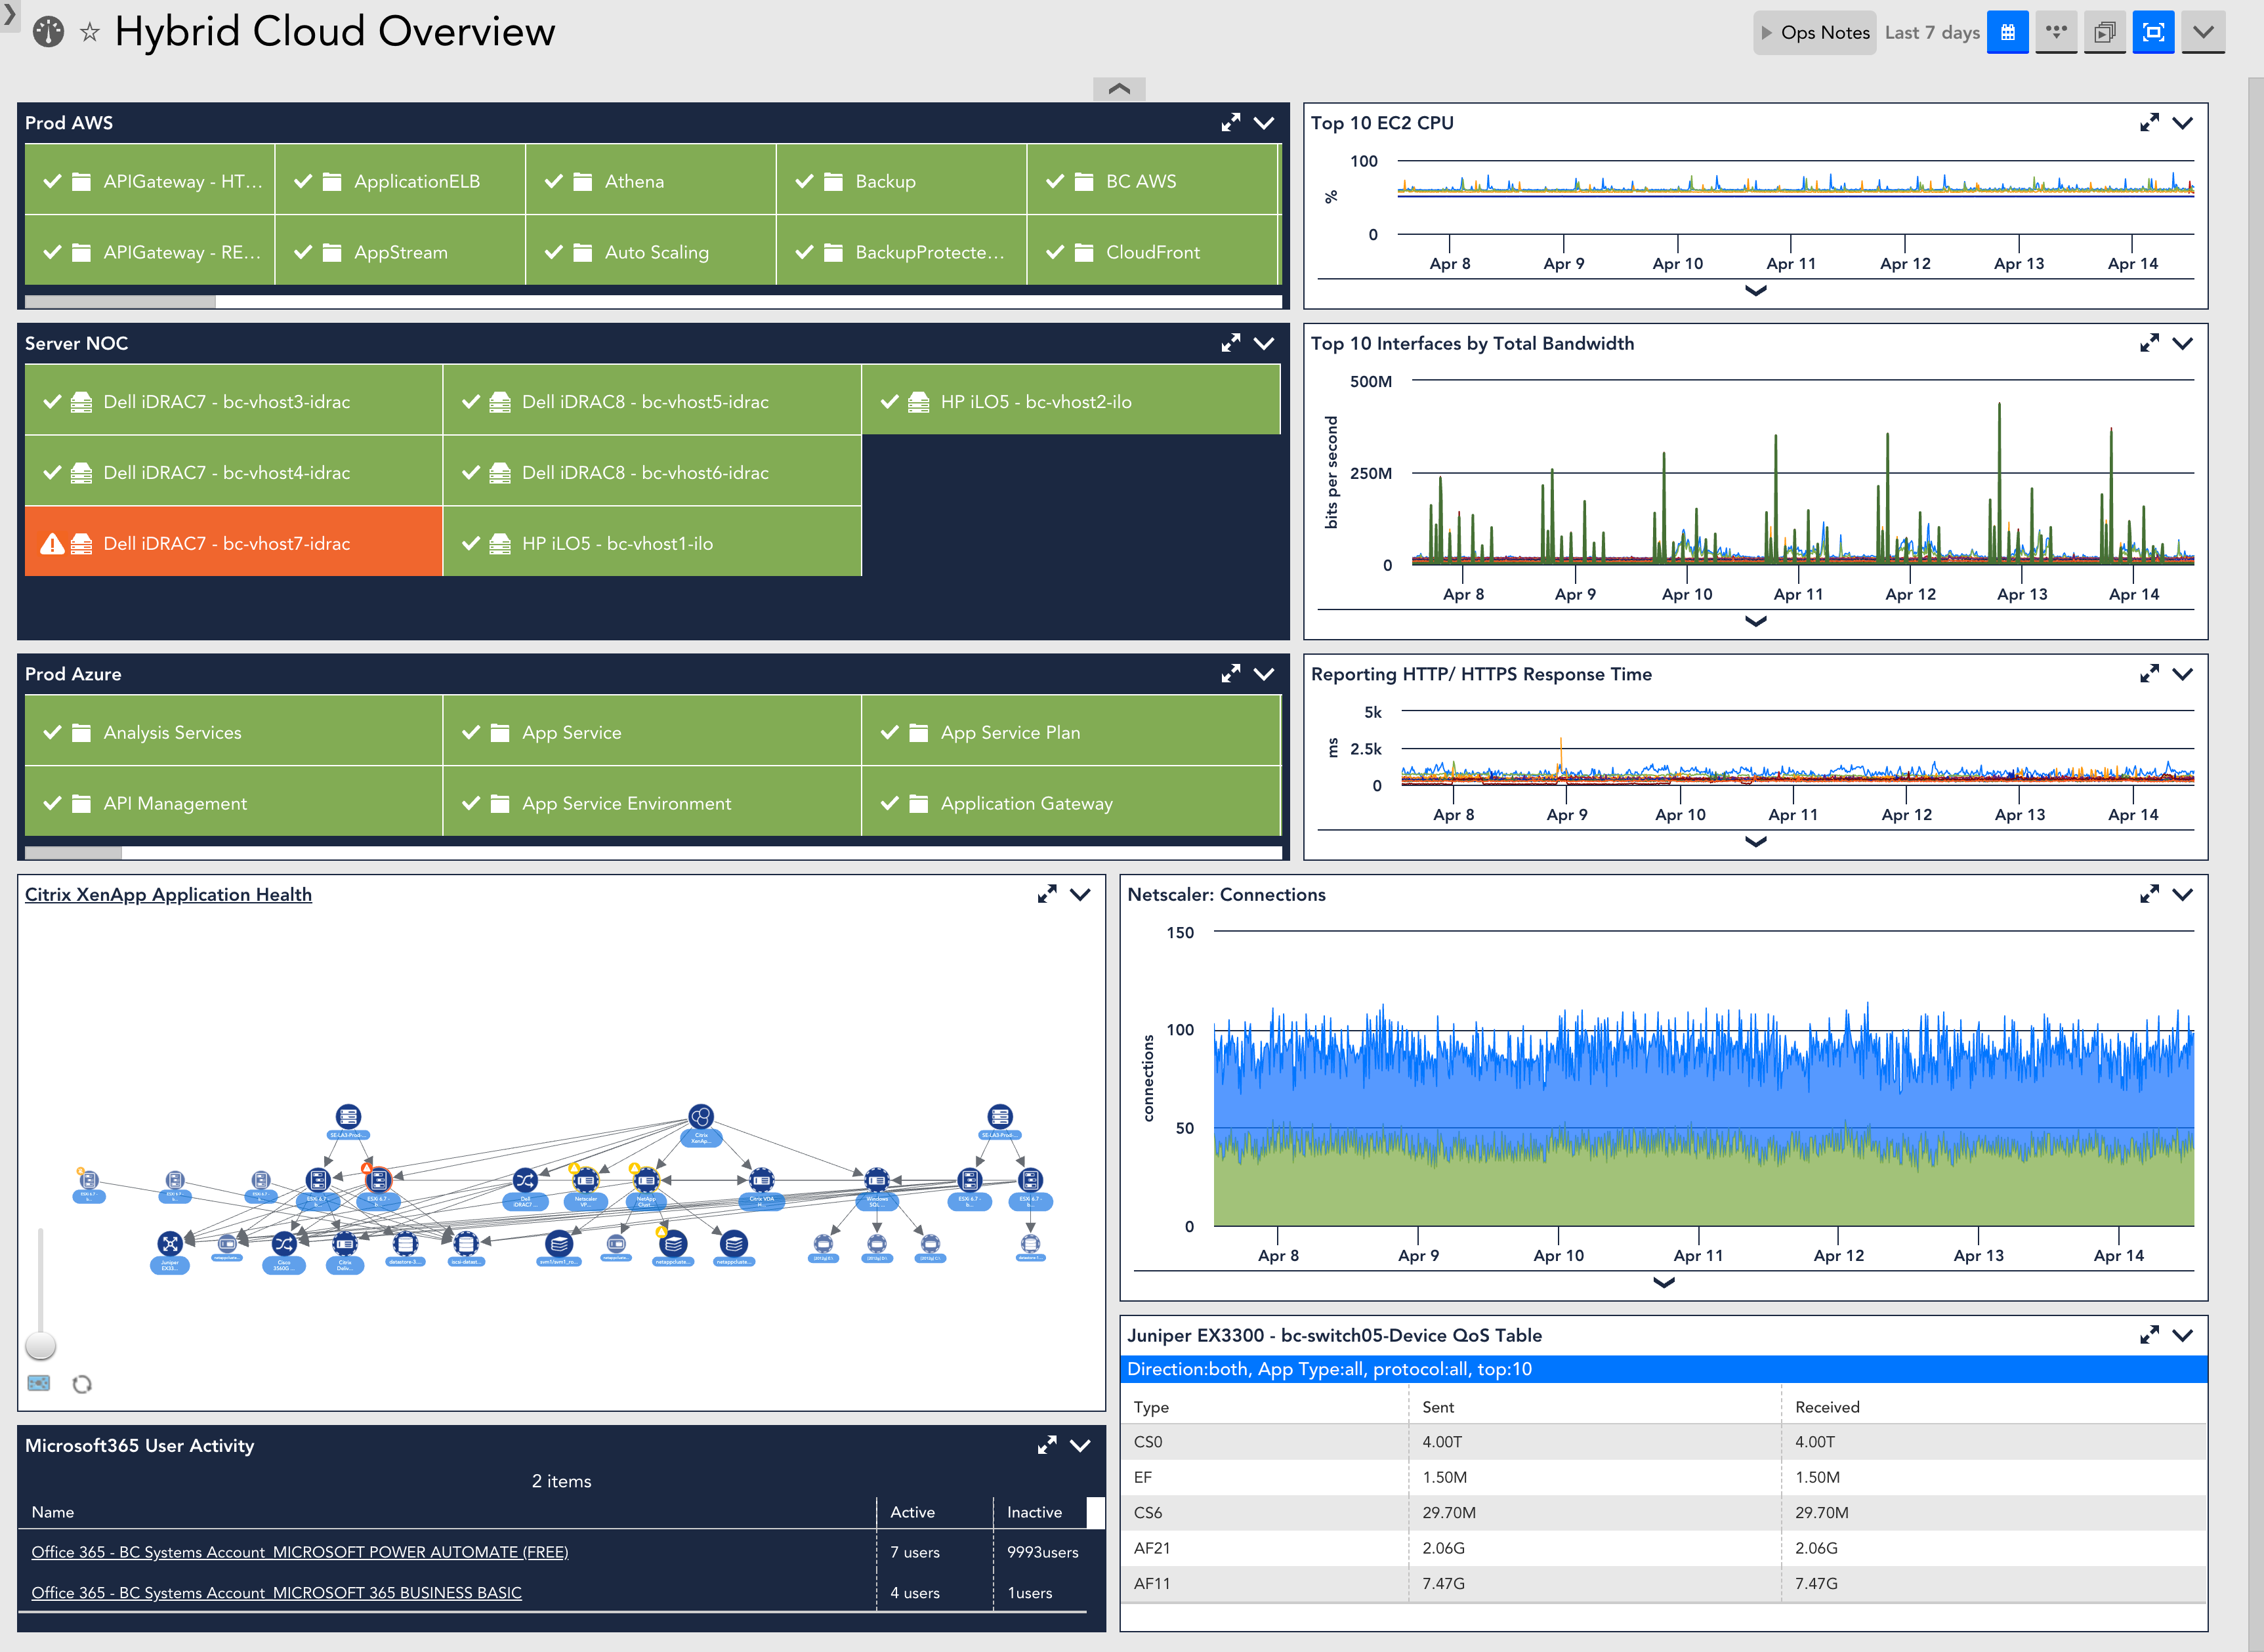
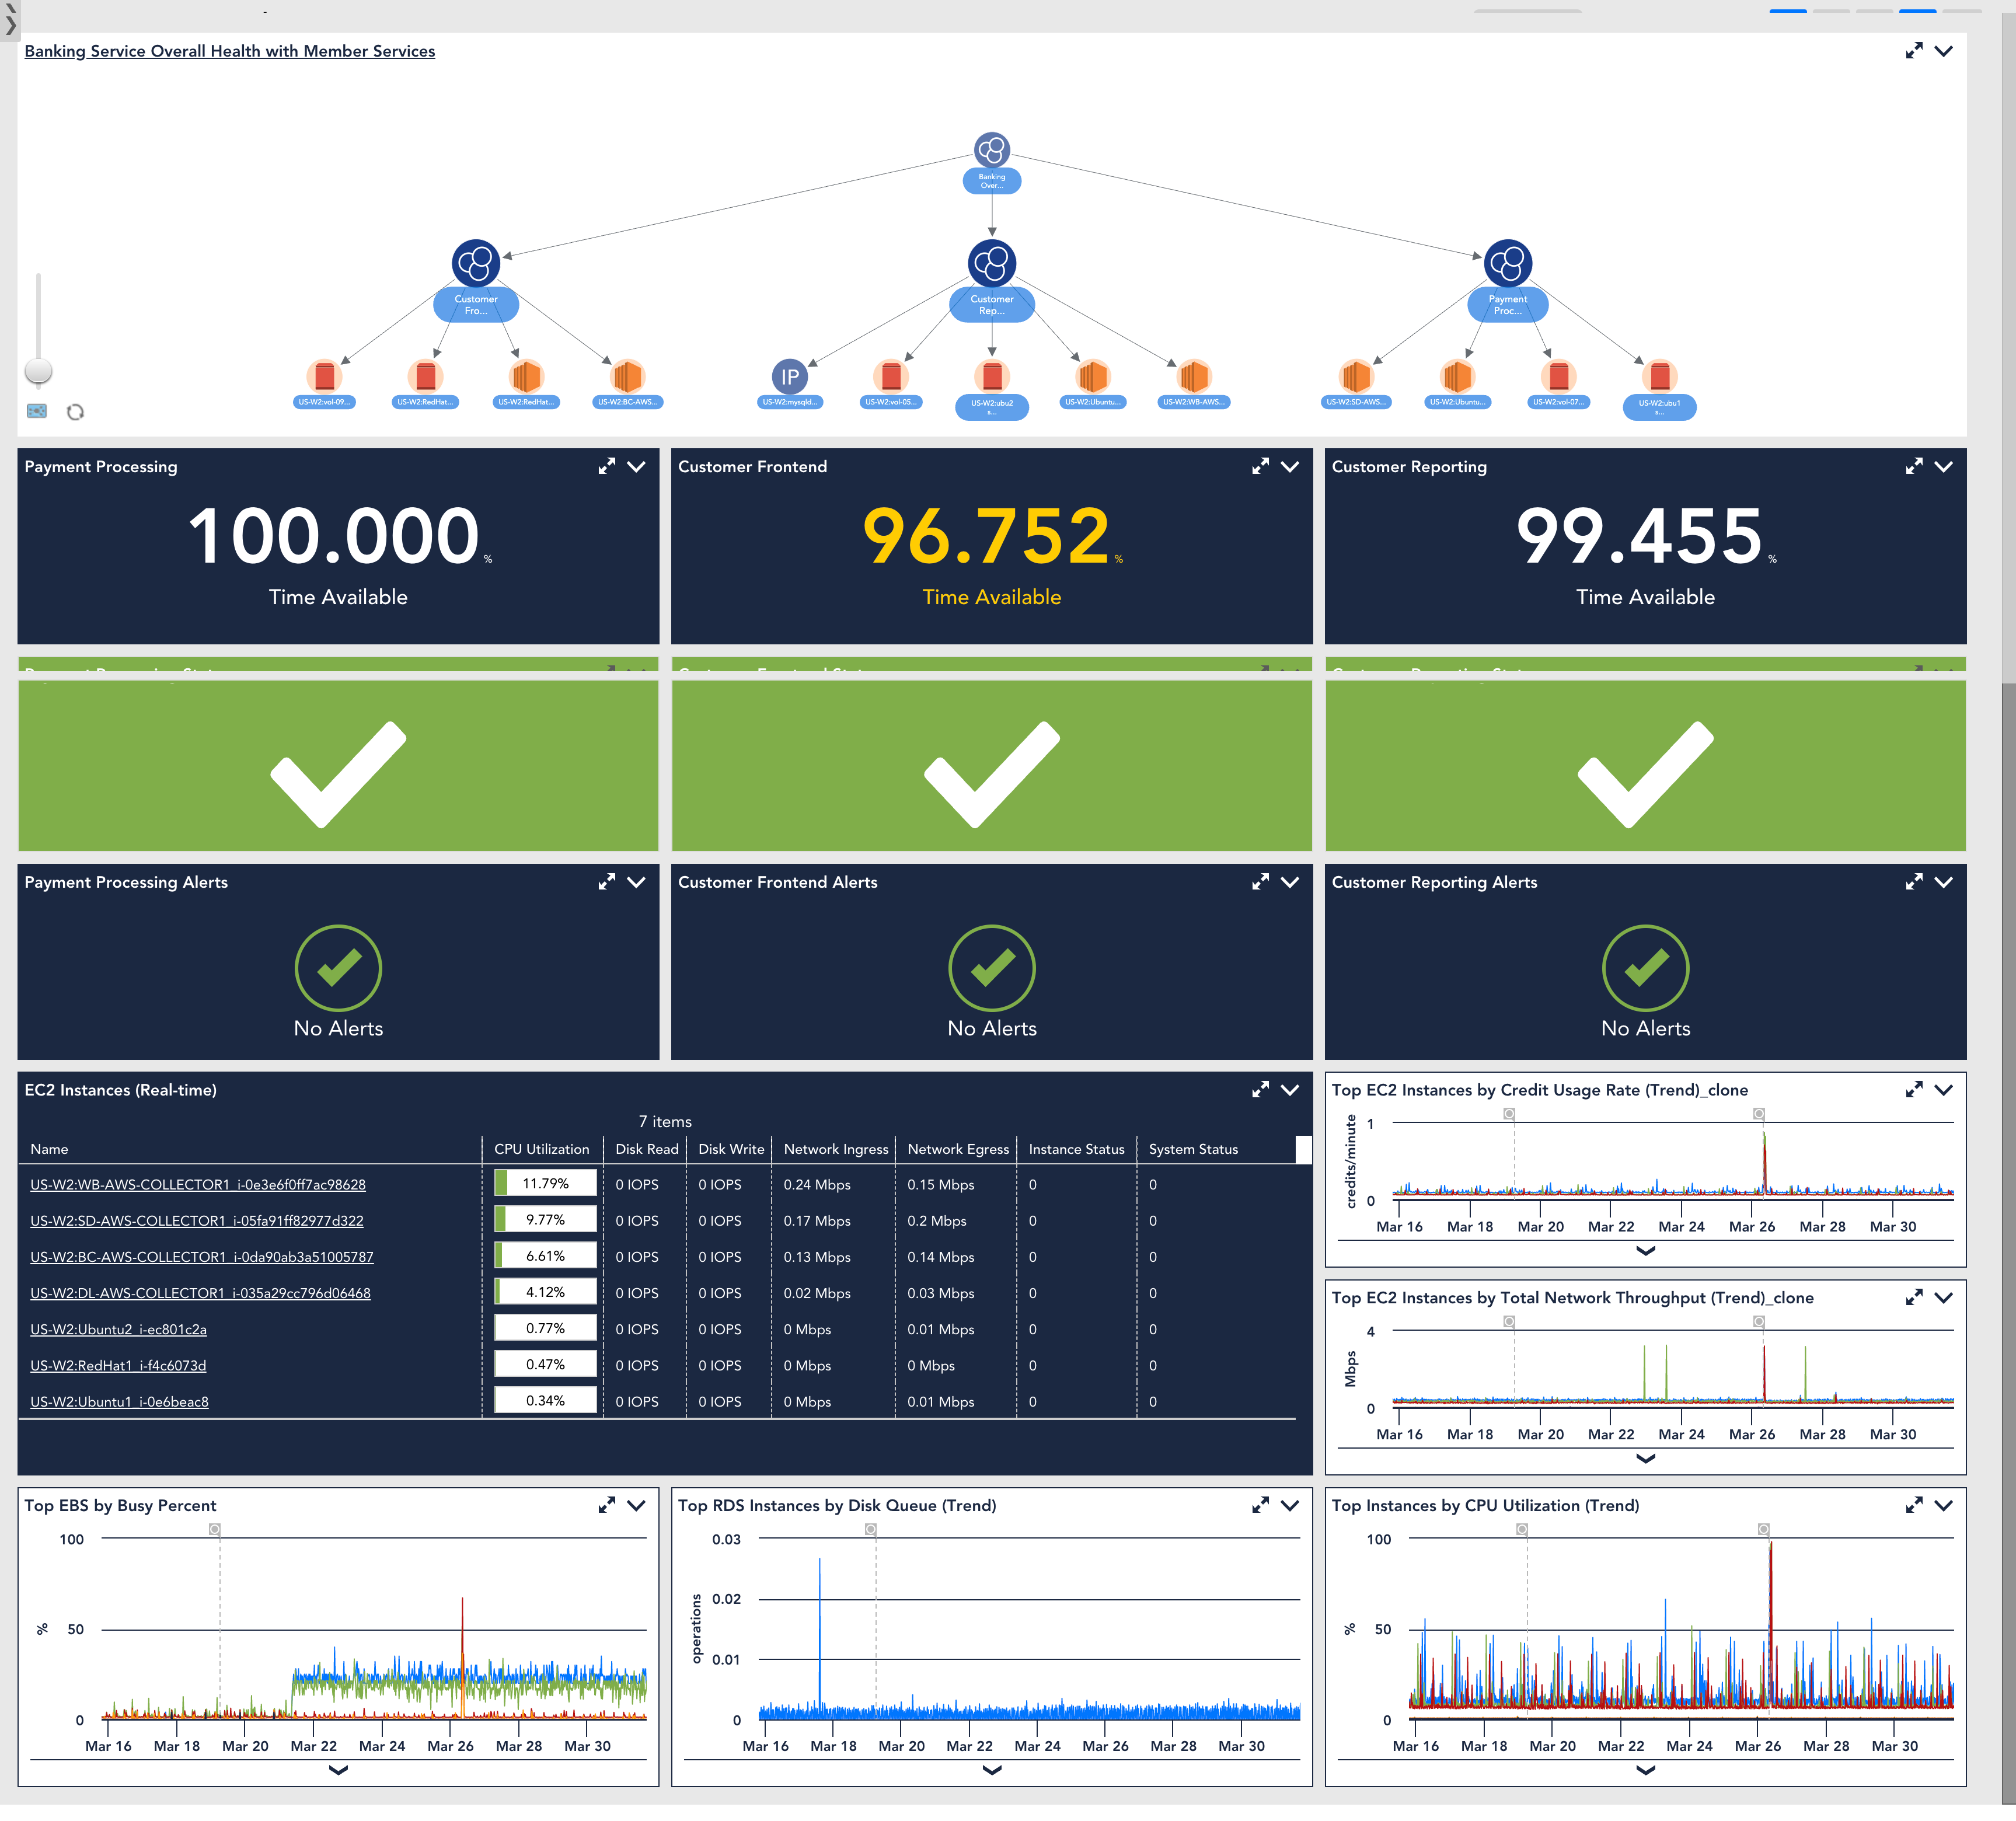
Comprehensive multi-cloud monitoring
- Organize your entire IT landscape for multi-cloud, on-prem, and container topology in one platform to clearly visualize dependencies
- Agentless resource discovery quickly collects business-critical information from your cloud platforms
- Quickly correlate performance and spend across systems with fast configuration and instant visibility into cloud, resources, applications, and logs
- Save deployment and troubleshooting time with built-in best practices including dynamic alert thresholds and use-case driven monitoring
- Access comprehensive OS and application-level metrics along with cloud-specific API data
Monitoring that moves and changes with you.
Cloud environments change frequently. Your cloud monitoring tool should keep up. 2,500+ custom LogicMonitor integrations provide:
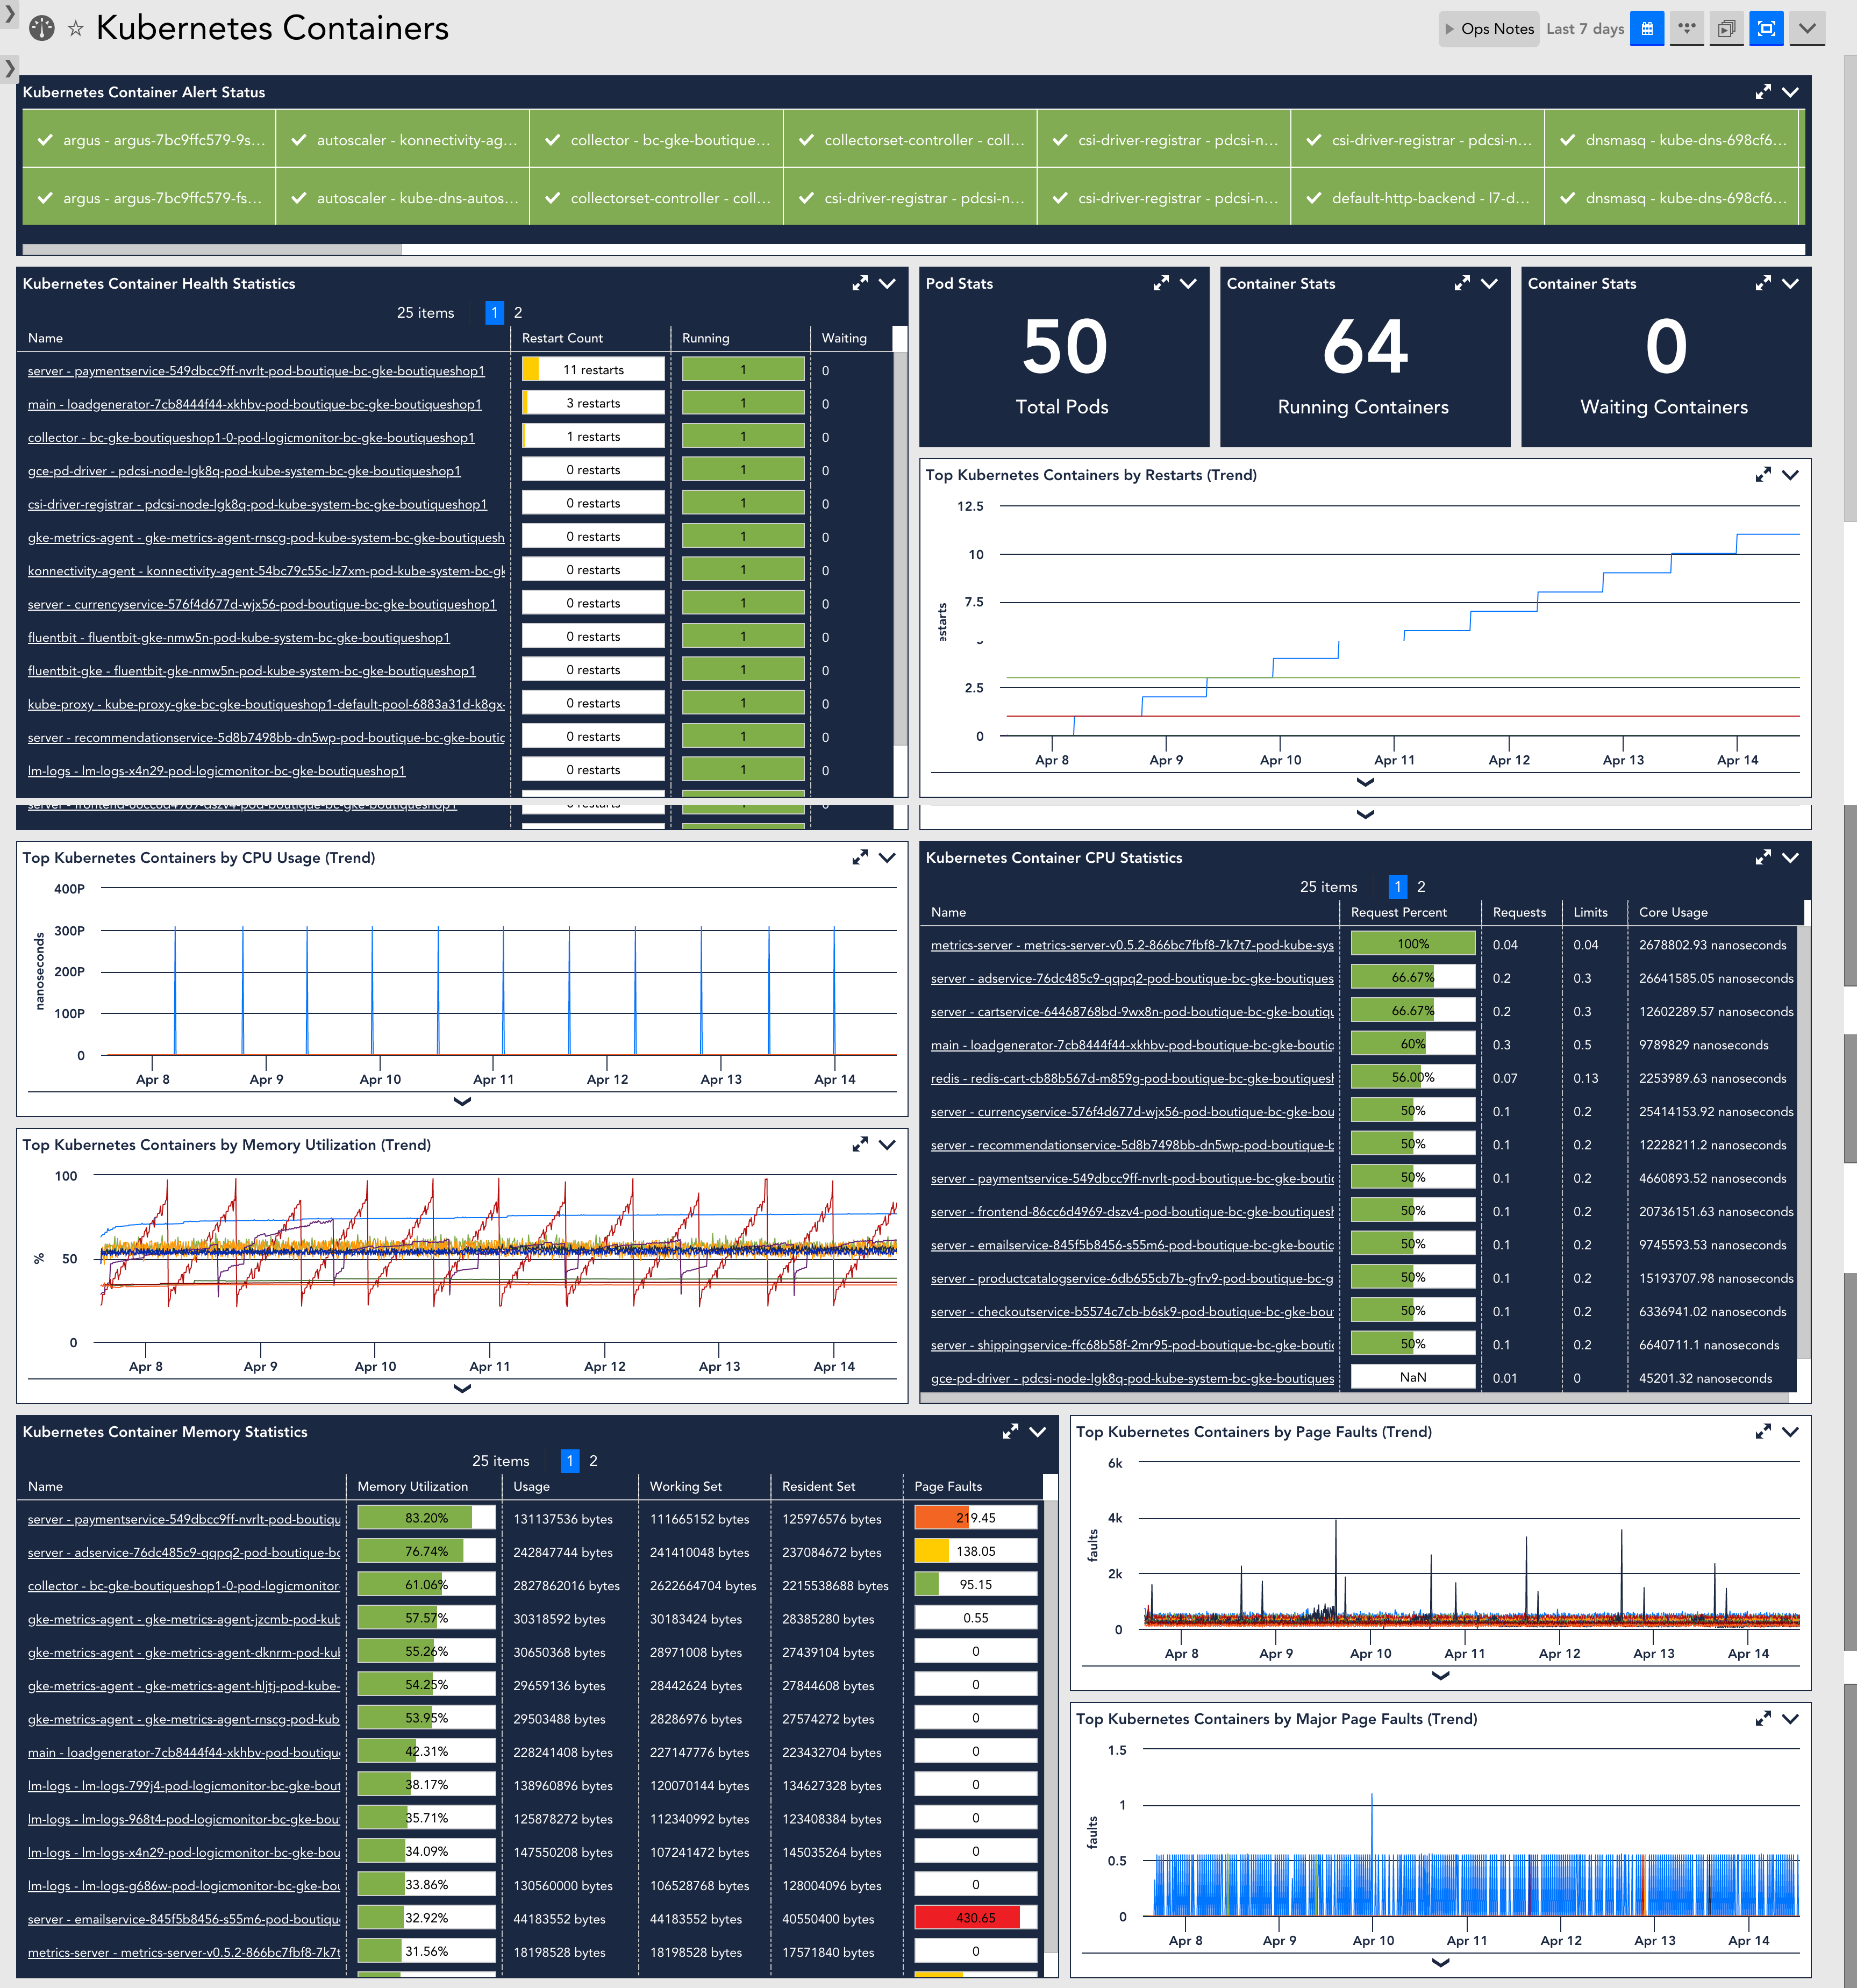
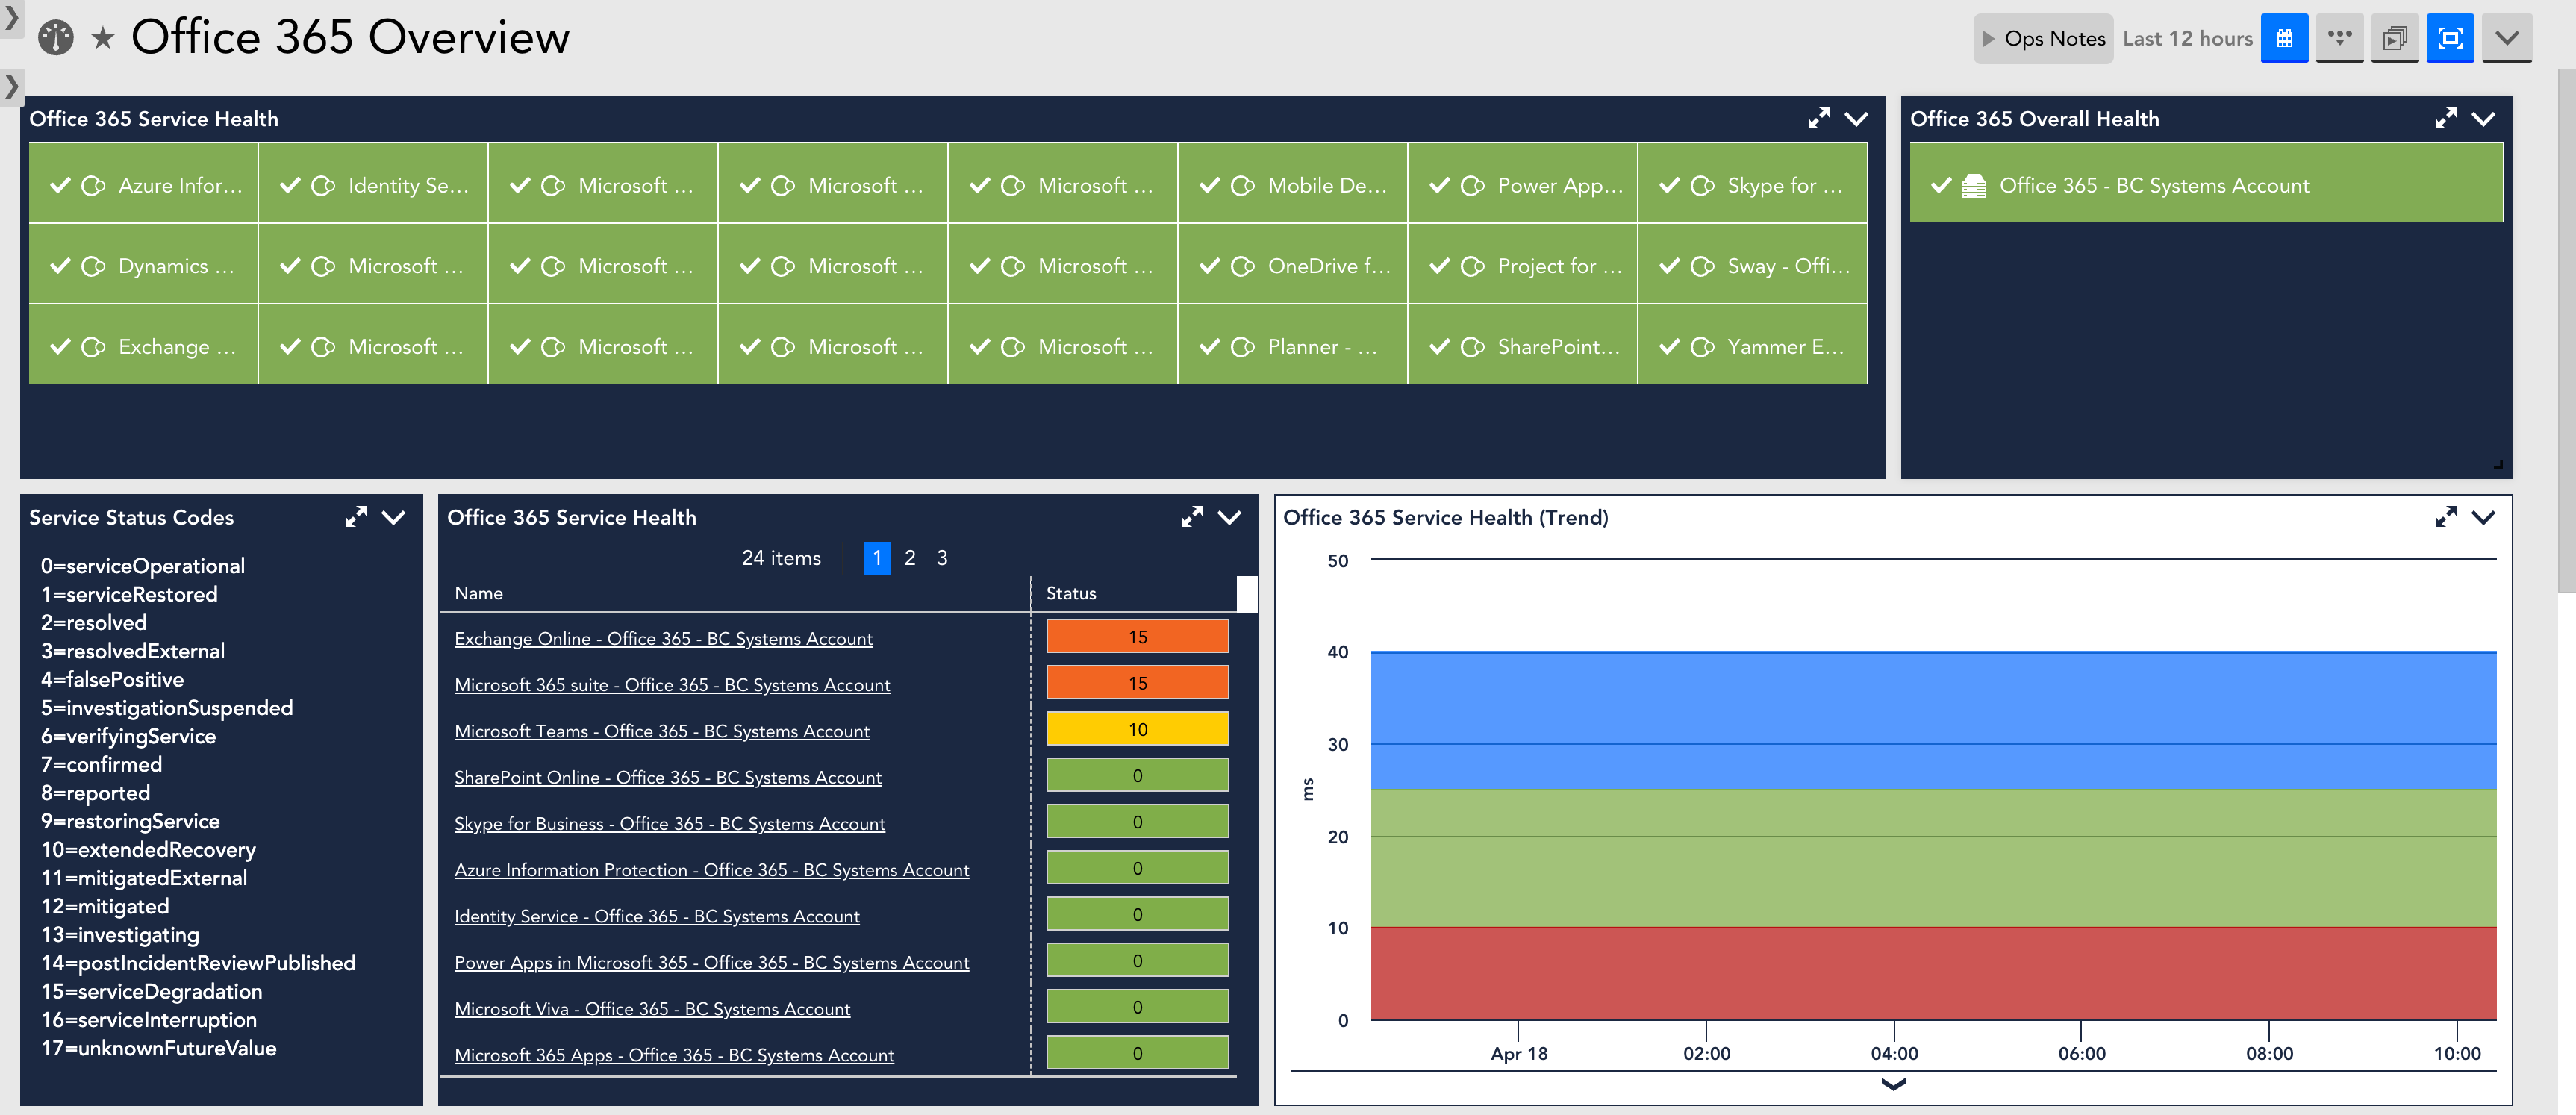
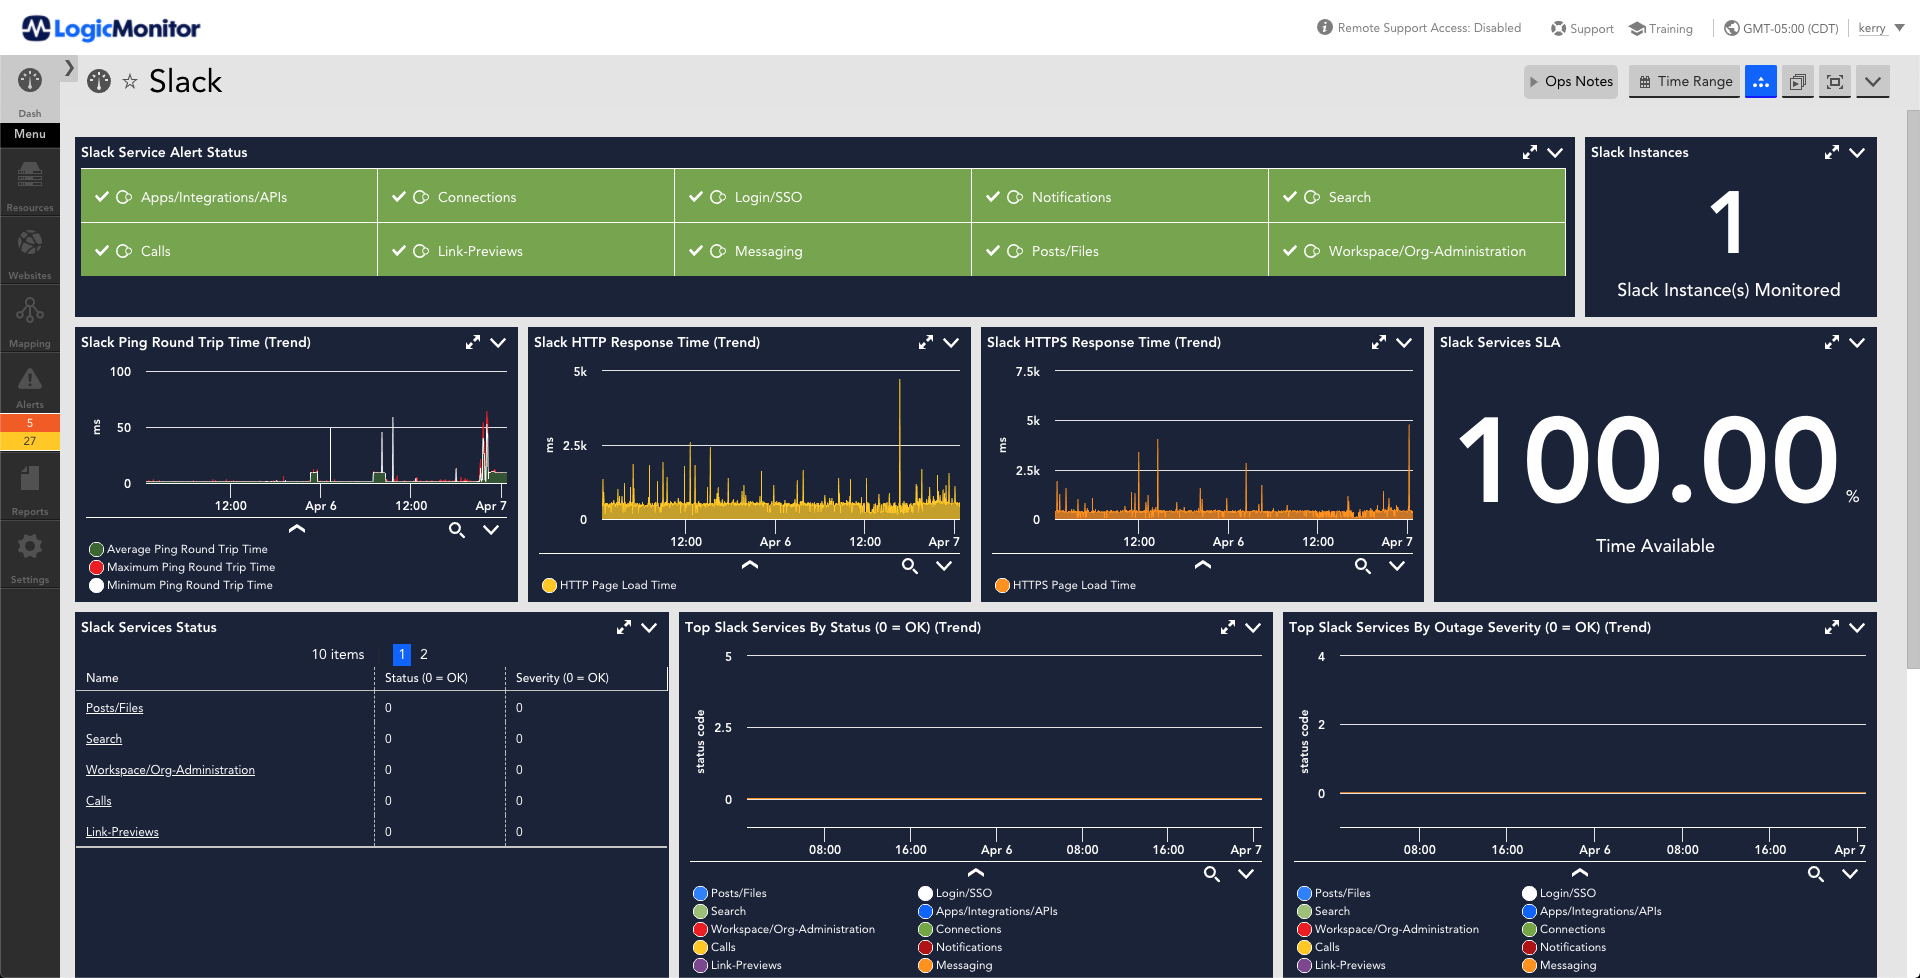
- Extensible and frictionless setup of AWS, Azure, and GCP environments, containerized deployments (Kubernetes, Docker, etc), as well as business-critical SaaS applications, such as Office 365, Salesforce, and Slack.
- Dynamic resource discovery automatically monitors ephemeral cloud environments at scale without manual oversight
- Immediate and comprehensive visibility into the health, performance, and availability of cloud platforms with an intuitive setup wizard
- Maximize service levels and get a singular view into multi-cloud account level capacity, scheduled maintenance, and available services
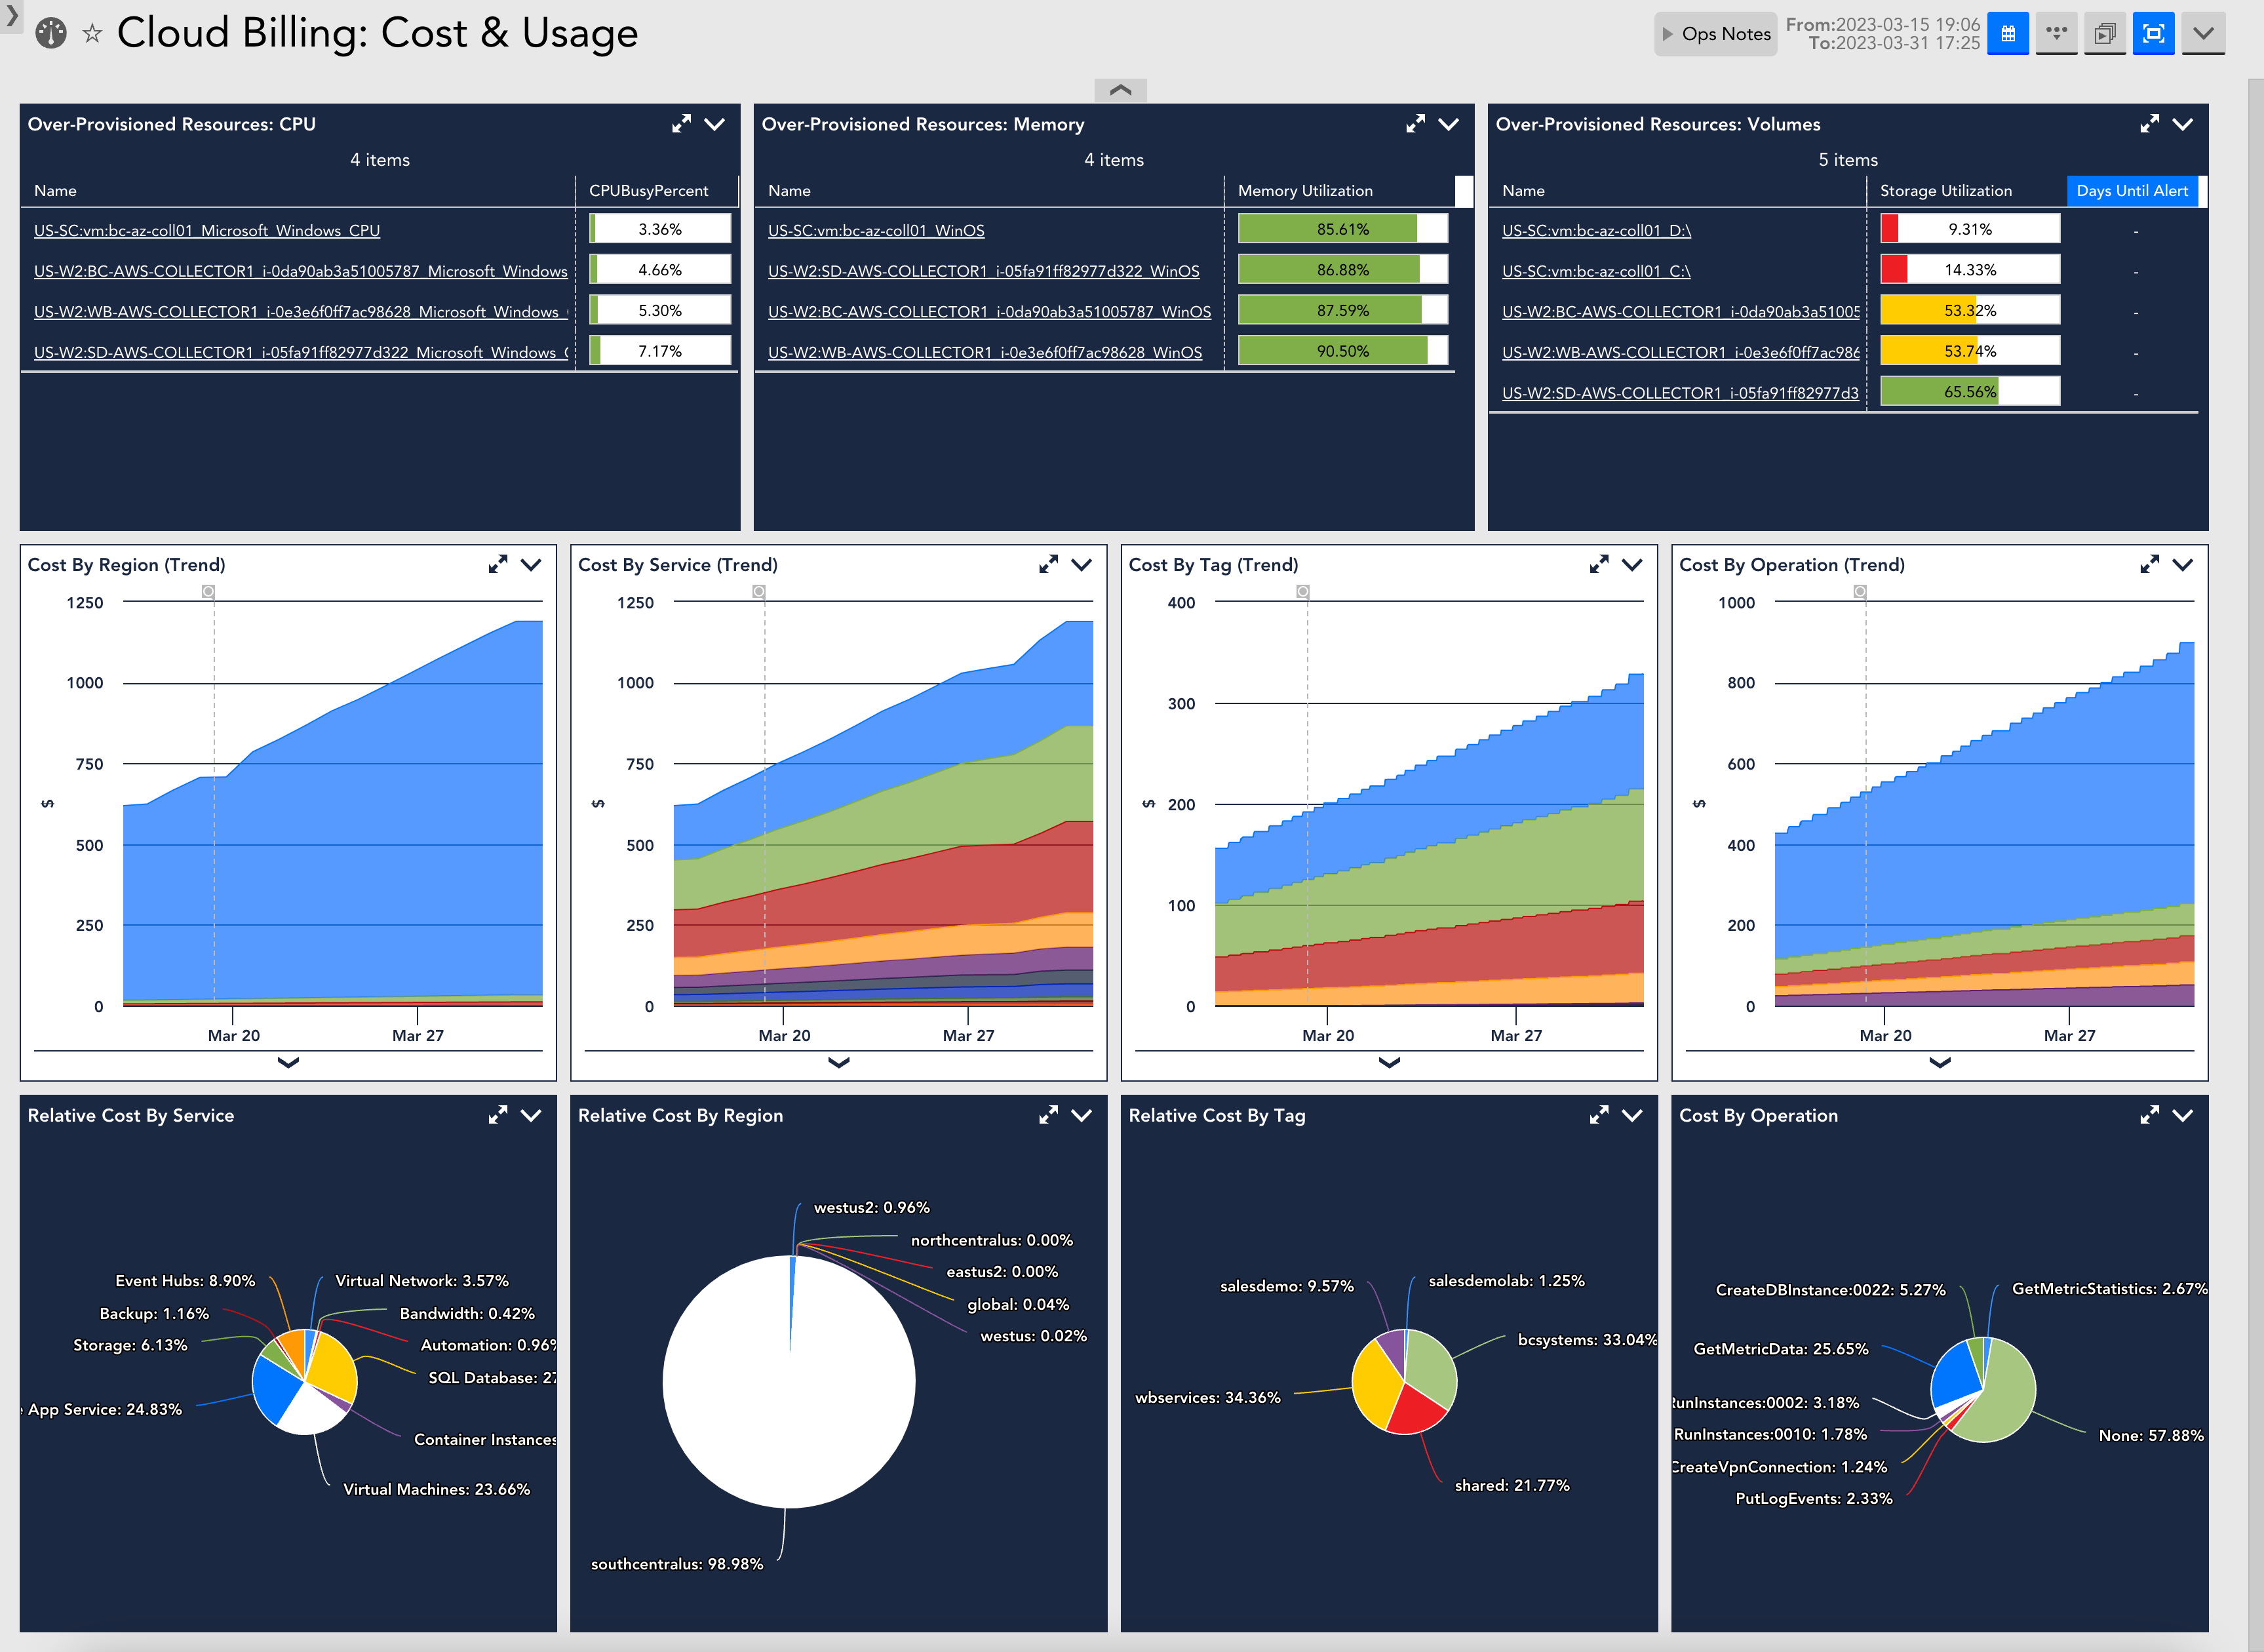
Control your cloud spend
Eliminate surprise overages. Easily predict cloud costs and visualize spend alongside resources to find cost optimization opportunities with detailed ROI analysis.
- Rightsize resource utilization and processing with full visibility into over and under-utilized workloads alongside costs
- Discover orphaned resources and eliminate unnecessary costs for unused cloud tools
- Automated alerts flag spend thresholds and reserved instance expirations
Use historical data to forecast future spend and optimize resource allocation
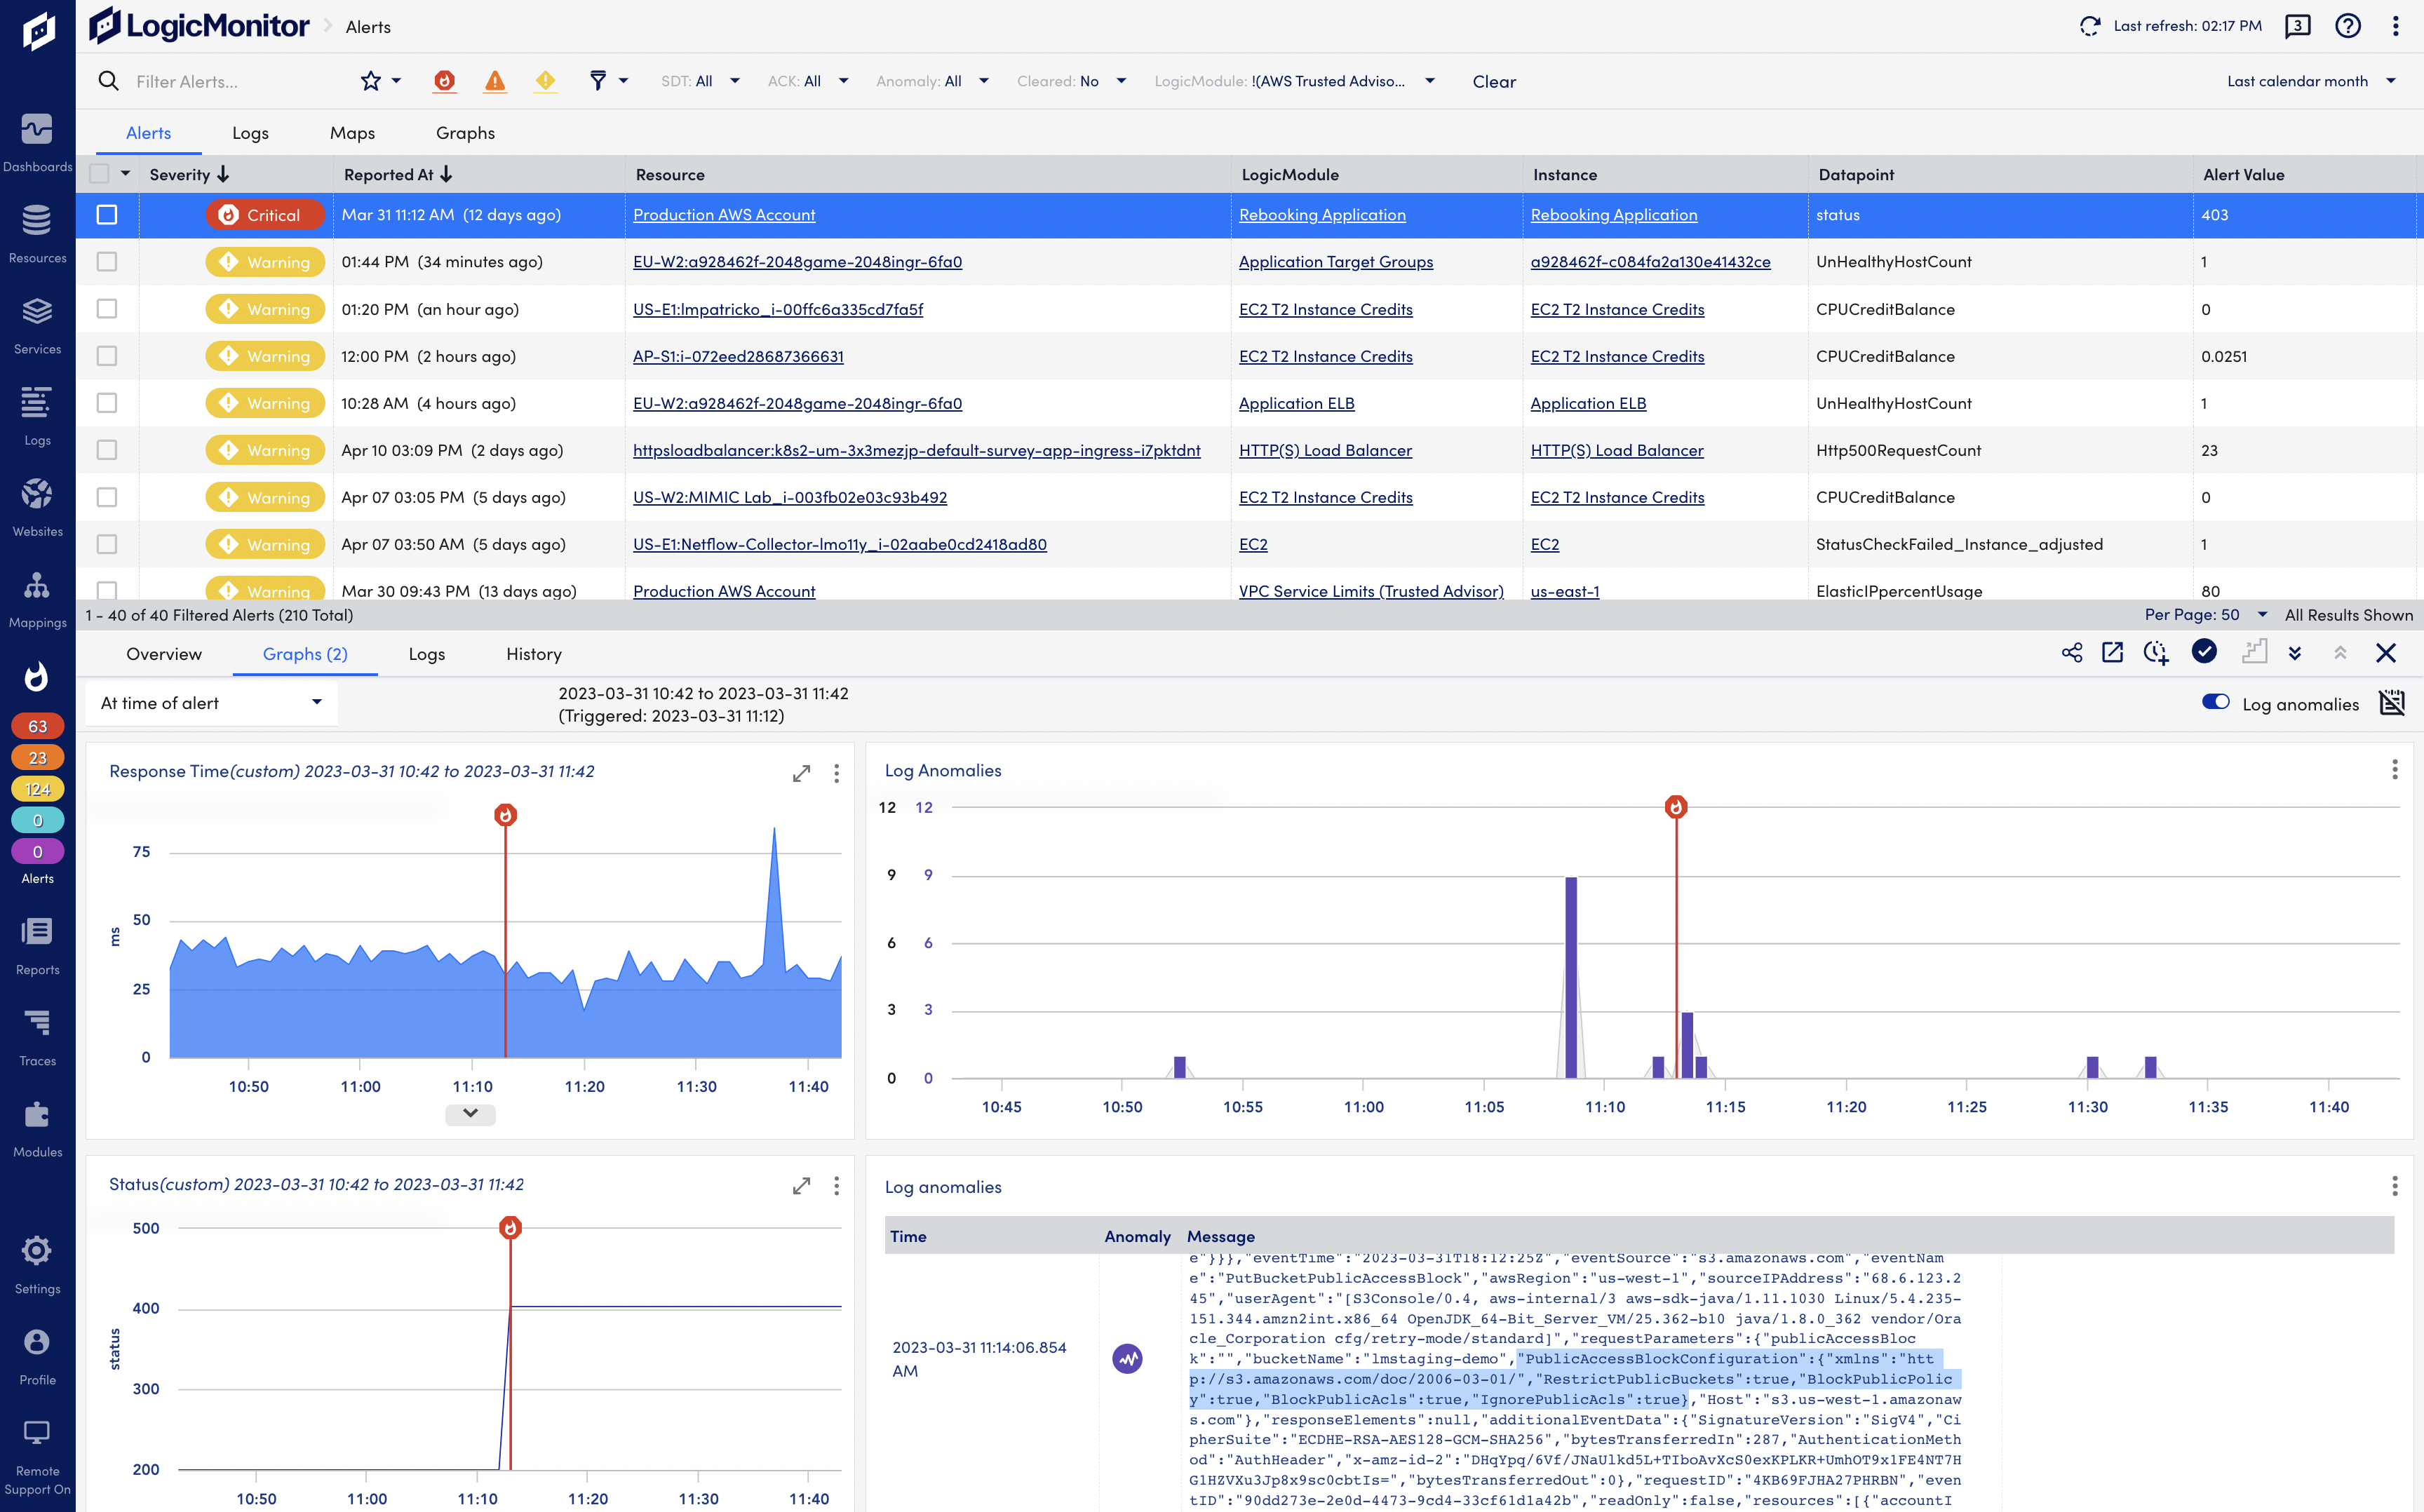
Reduce MTTR with intelligent alerting
Dynamic alerting to preempt issues before they become problems.
- Service insight capabilities monitor and alert at the business level so ephemeral resources are constantly covered
- Cut through the noise with pre-configured alert thresholds based on AI-driven best practices for cloud environments
- Patented algorithms detect log events representing changes and anomalies across infrastructure landscapes, both cloud and on-prem
- Leverage forecasting and eliminate issues with service limits to maintain availability
Additional multi-cloud monitoring platform benefits
Monitor cloud platforms and SaaS apps with speed and ease
LM Envision’s multi-cloud monitoring service provides agentless, API-based monitoring of business-critical SaaS applications and cloud platforms for holistic coverage.
Keep your team informed
Keep your teams connected and streamline workflows with built-in integrations for service management tools like ServiceNow, Autotask, and Connectwise, communication tools like Slack, and incident response tools like PagerDuty.
Service limit capacity with no surprises
Receive alerts for service disruptions, even before your cloud provider confirms them. Track the availability, performance and usage of your cloud services before it impacts end-user performance.
Related Solutions


FAQ
- What is Cloud Monitoring?
Cloud monitoring is the process of reviewing and managing the operational workflow that makes up a cloud-based IT infrastructure. Different techniques confirm the availability and performance of websites, servers, applications, and other cloud infrastructure.
- Can I monitor more than one cloud provider simultaneously at LogicMonitor?
Companies often use multi-cloud environments to distribute computing resources and minimize the risk of downtime and data loss. LM Cloud applies a comprehensive monitoring strategy to overall cloud performance. It gives users real-time, data-driven insight into every potentially impactful component of their cloud deployment through three fundamental elements: cloud provider monitoring, resource performance monitoring, and detailed ROI analysis.
- What cloud providers does LogicMonitor monitor?
LM Cloud’s three component strategy (resource monitoring, cloud provider availability monitor, and ROI monitoring) does not depend on the cloud provider. Currently supported cloud services include Amazon Web Services, Microsoft Azure, and Google Cloud Platform, and SaaS apps such as Office 365, Salesforce, Zoom, or any supported by Atlassian Statuspage.io.
- How does LM collect cloud metrics?
LogicMonitor collects data via the following methods: The application program interface (API) for individual cloud providers, for example AWS CloudWatch API, AWS EC2 API, Azure Monitor API, and so on. And the LogicMonitor Collector Metrics from LM Cloud are presented within LogicMonitor the same way as metrics for all resources and device metrics.
- How does cloud monitoring work?
The cloud monitoring strategy includes three components critical to measuring overall health and performance of a cloud infrastructure:
- Resource Monitoring
- Cloud Provider Availability Monitoring
- Return On Investment (ROI) Monitoring
Monitored data for these three components is presented in auto-generated dashboards alongside any monitored data for on-premises infrastructure in LogicMonitor
- What are cloud metrics?
LogicMonitor discovers your cloud resources and adds each resource as a LogicMonitor device. Datasources that are pre-configured to preform API calls and queries will be automatically applied to these discovered resources. If you also have a Collector deployed within your cloud environment, traditional Collector DataSources based on SNMP, WMI, and so on, will also auto-apply to these discovered resources. All existing LogicMonitor reporting, alerting dashboard and monitoring functionality works the same way once this data is in LogicMonitor.
See what our customers say about us
Track your company’s network and devices with LogicMonitor.
It’s great since we don’t have to install bothersome agents on the devices or hardware that we want to monitor. I didn’t even need to consult the instructions or contact customer support when I wanted to add a device; the process is simple and easy to follow.
Feb 12, 2024
The tool for strategic Managed Services partners
SolarWinds had the big breach just as we left it. We loved how powerful it was, and how customizable – however, it is an ON-Prem tool, and as a growing MSP, that dynamic didn’t and couldn’t scale.
Nov 21, 2022

Help businesses spend less time on manual tasks and consolidate existing tools
LogicMonitor dynamically scales with our network’s growth. Whether we add new devices or expand into the cloud, the platform adapts seamlessly, eliminating the need for constant manual configuration. Excels in providing comprehensive visibility into our network infrastructure. It auto-discovers devices and monitors various network components, including servers, switches, routers, and cloud services.
Sep 22, 2023

More Resources
Cloud Monitoring / 12.20.23