Log analysis
Log intelligence at scale for hybrid and multi-cloud environments – instant access to contextualized and correlated logs and metrics in a single, unified cloud-based platform. With tiered retention options, including unlimited retention, and hot storage, IT teams can optimize data hygiene and internal compliance initiatives.
Centralized log and metric data in one platform
Eliminate context switching between IT Infrastructure monitoring and Log management products, by correlating relevant logs with metrics in a single platform – with over 2,000 integrations, modules and pre-built templates for on-prem (like networking, servers, databases, Windows, Linux) and cloud (like AWS, Azure, GCP).
Decrease troubleshooting
Streamline IT workflows
Increase control & reduce risk
Enterprise-scale Saas platform for log intelligence and aggregation
Successfully monitor complex, multi-cloud, and hybrid enterprise infrastructures at a global scale
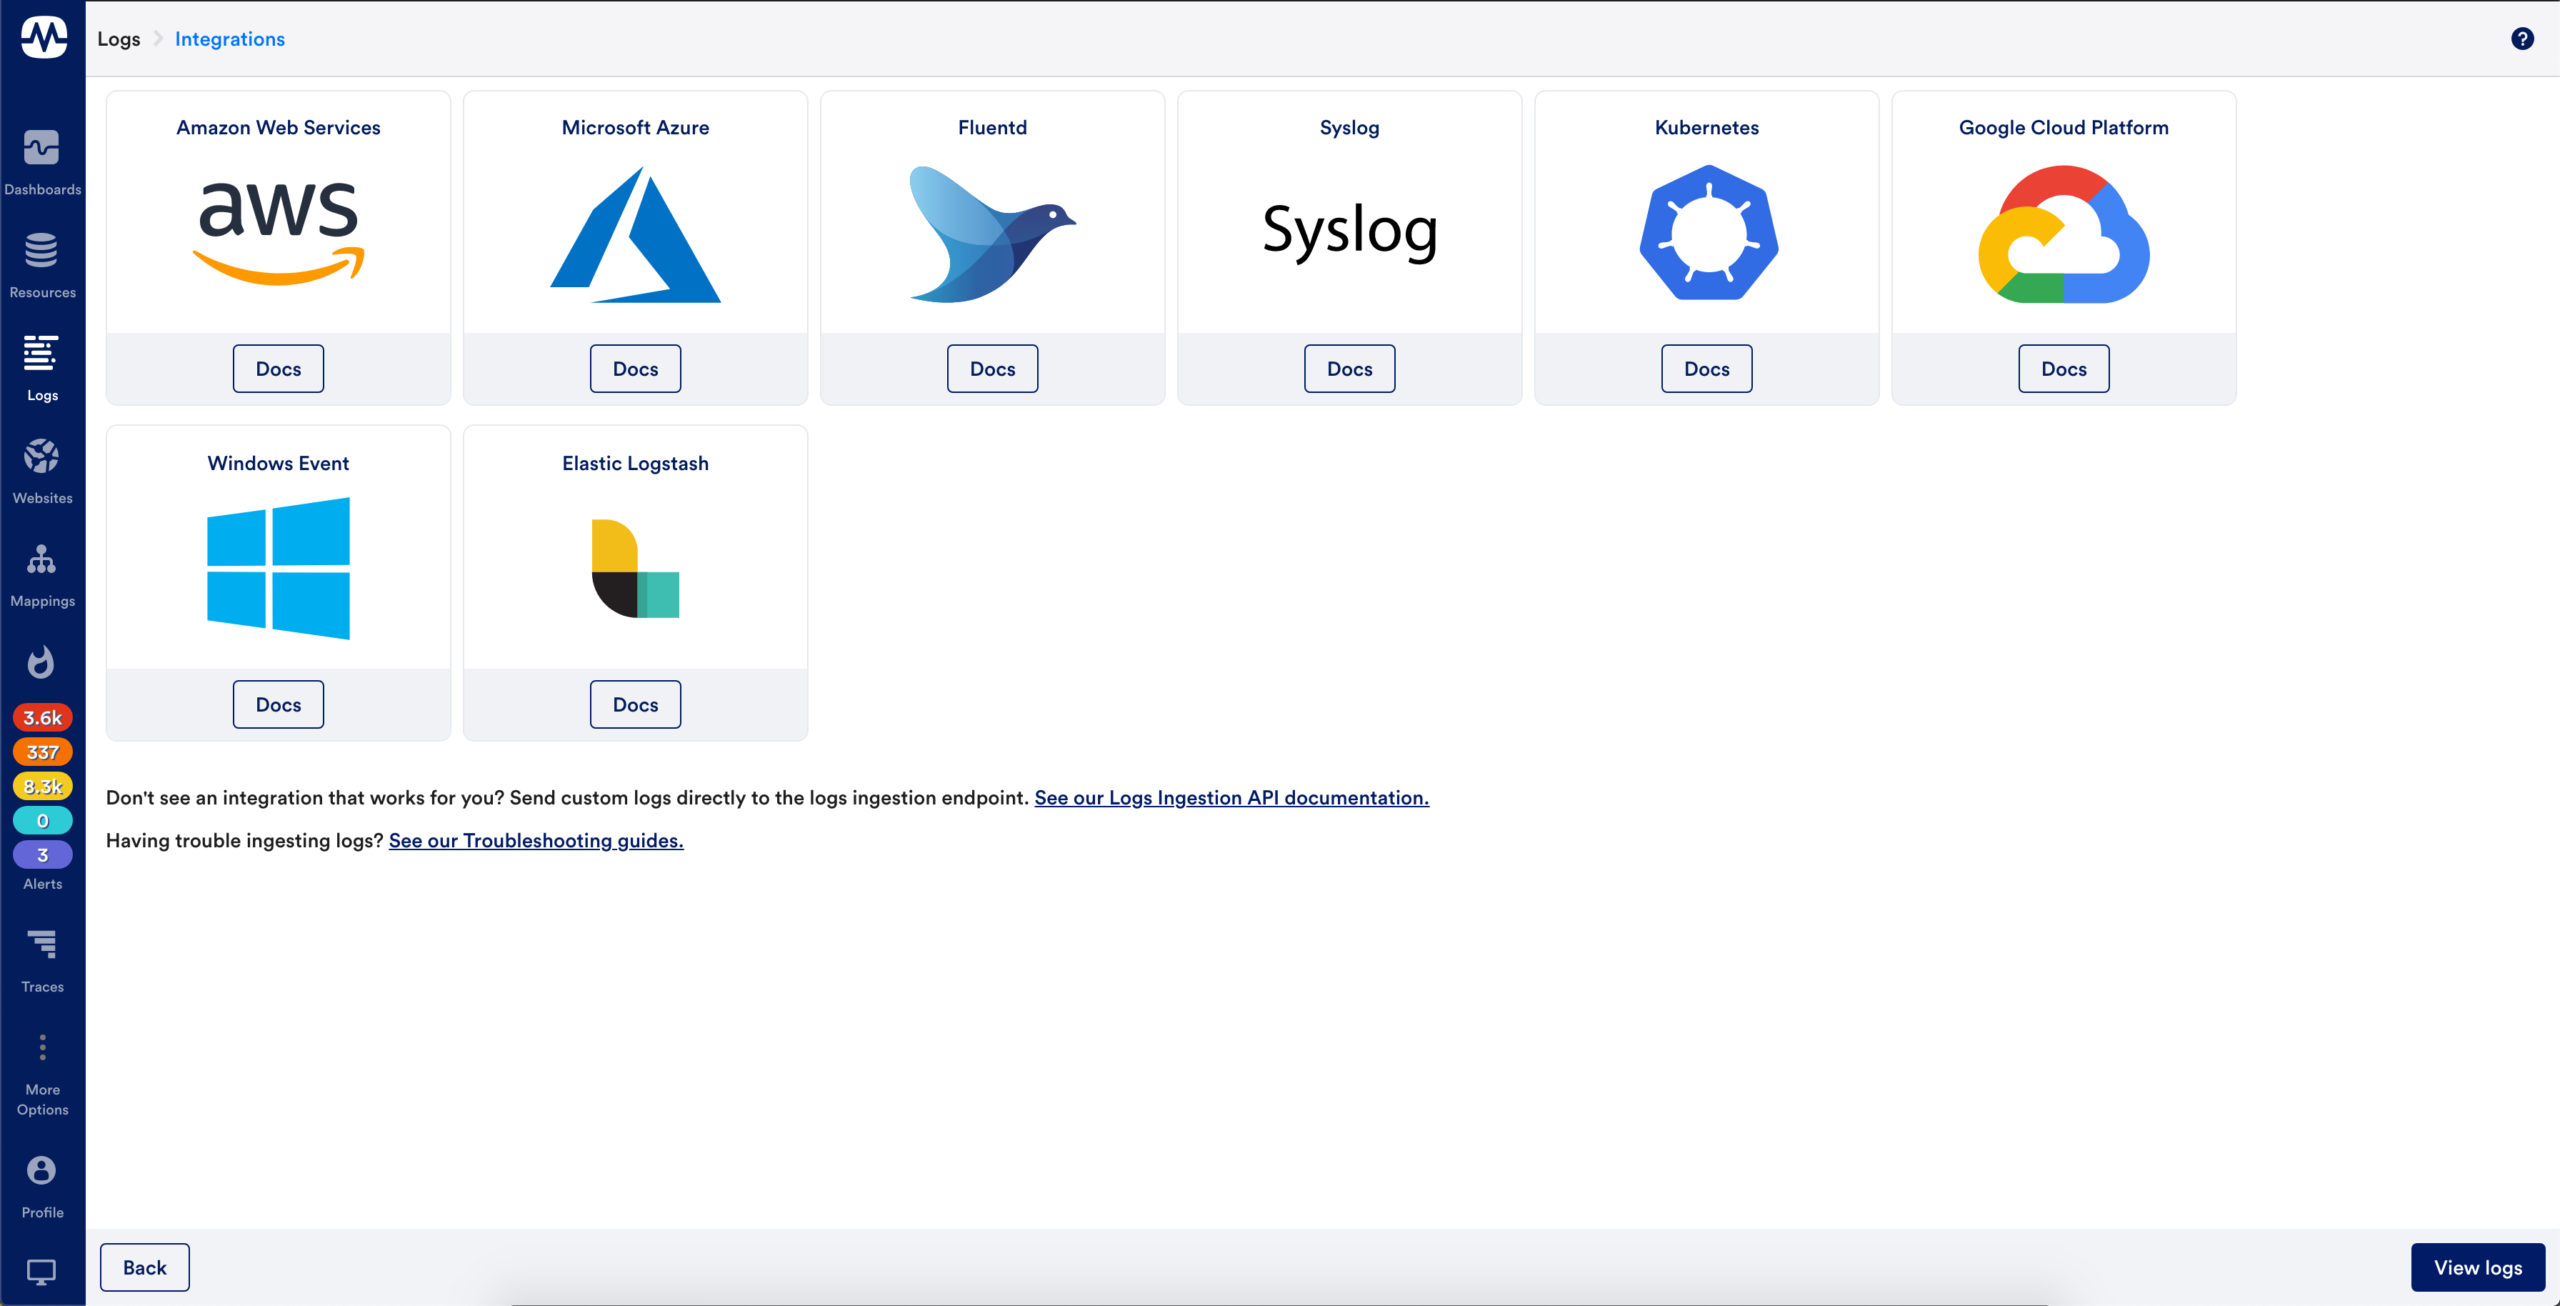
Comprehensive and extensible log collection
LM Logs out of the box integrations make it easy to send logs to LogicMonitor.
Send it & forget it – logs are automatically matched to monitored resources & anomalies are automatically detected and contextually displayed.
A robust API enables users to customize log collection & send any logs to LogicMonitor, regardless of whether an integration is available
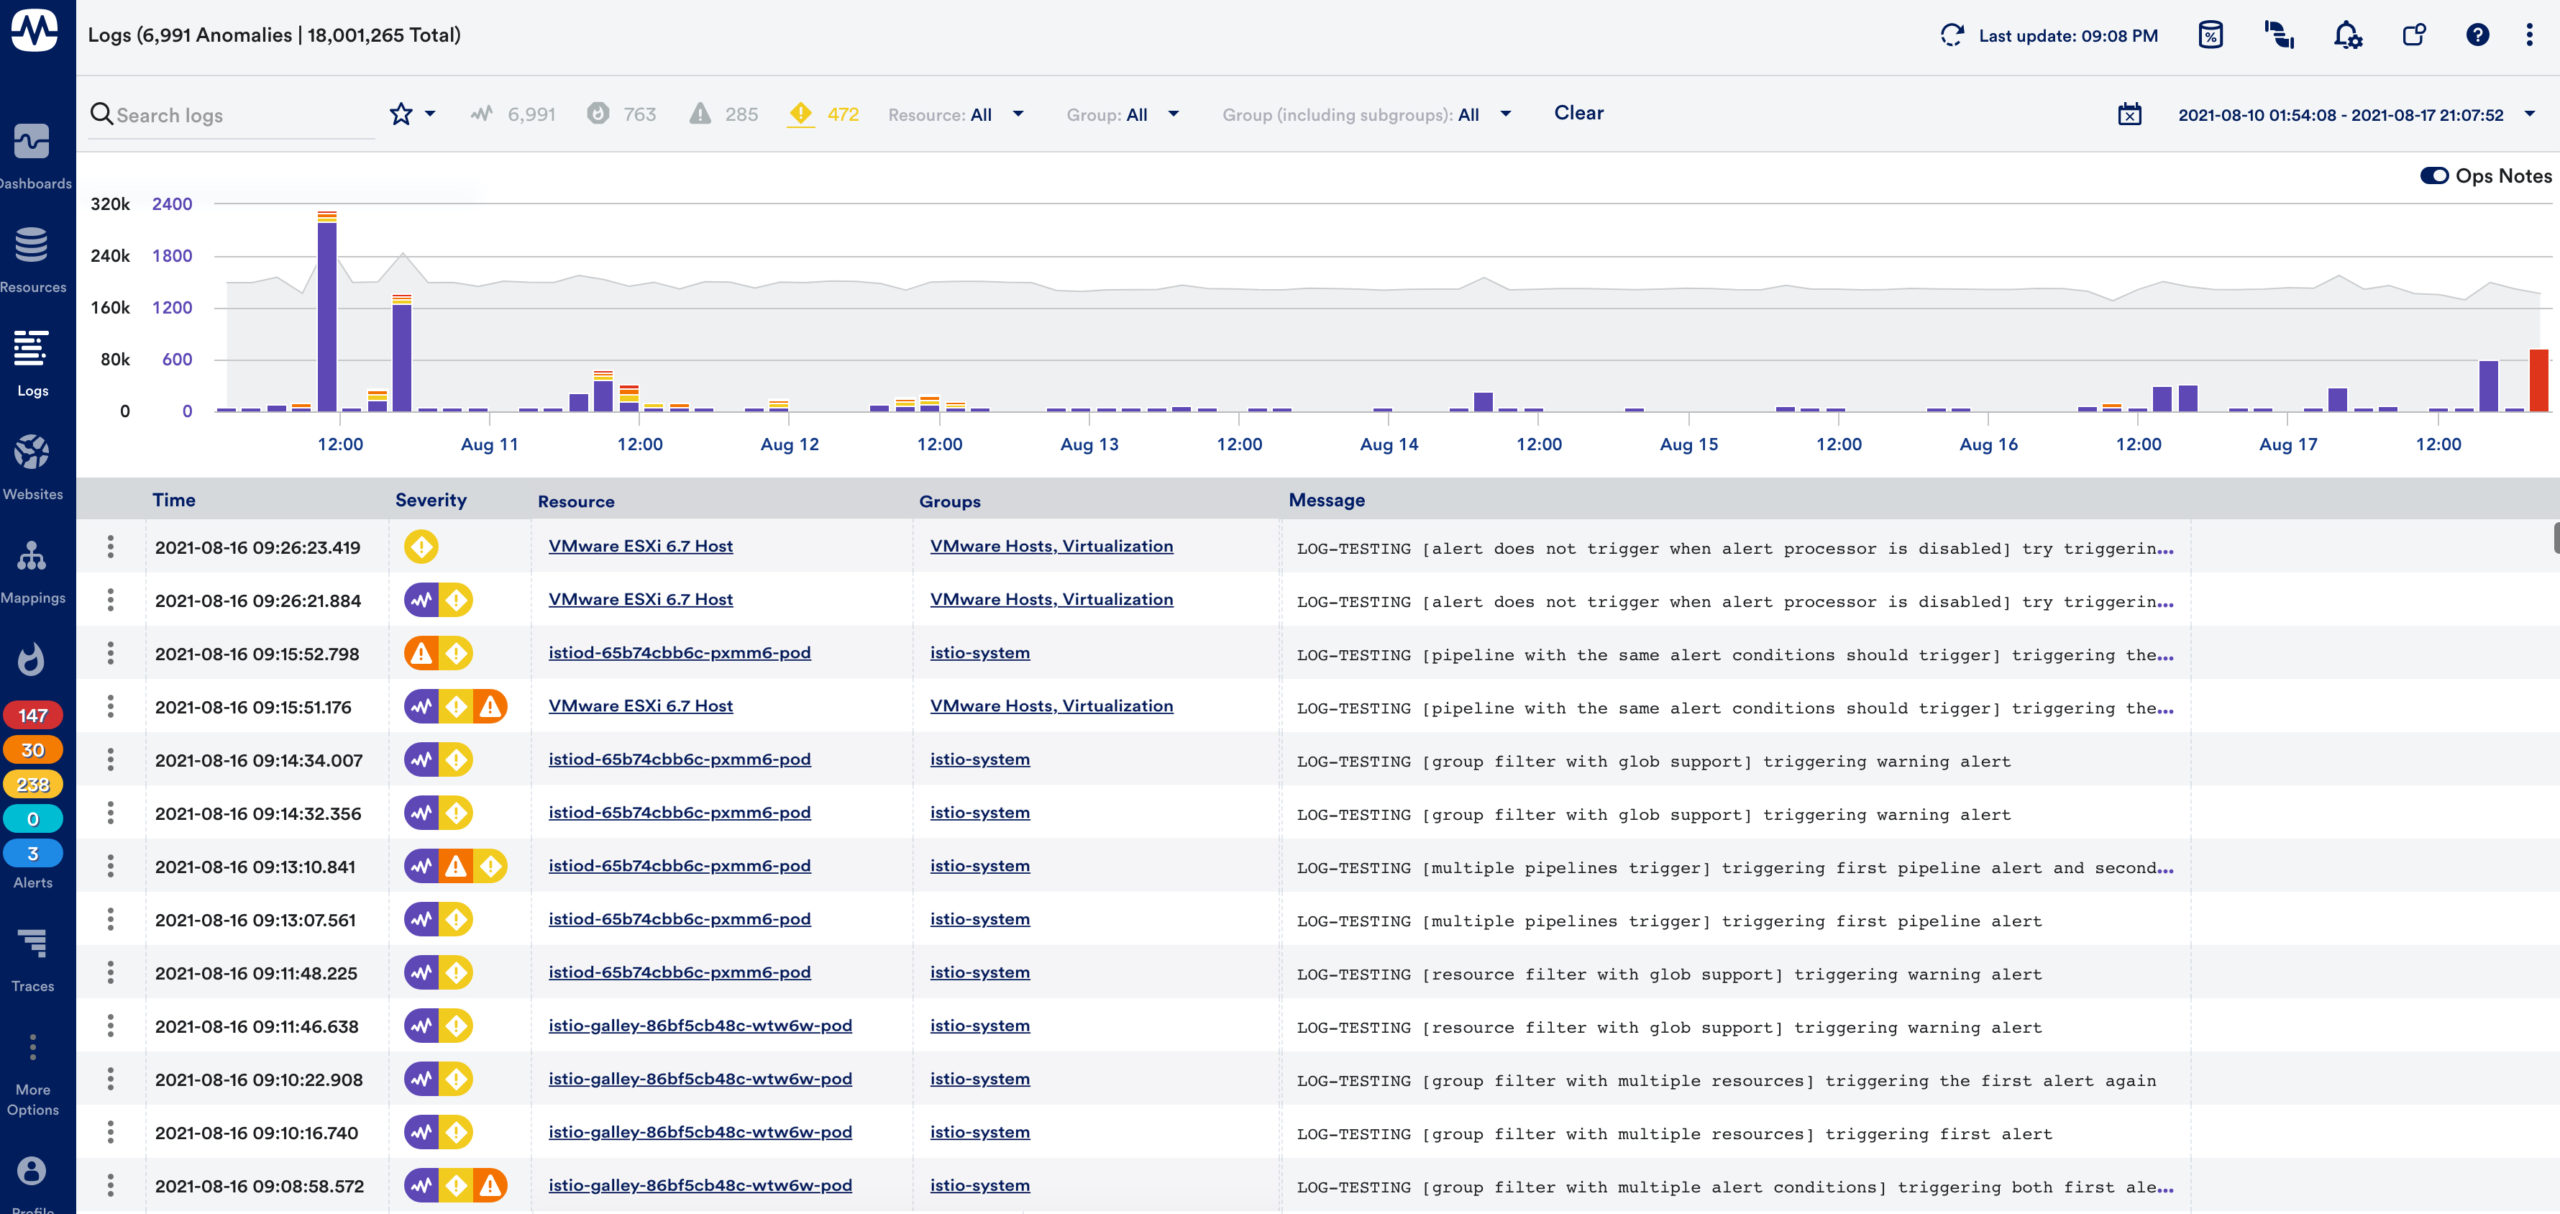
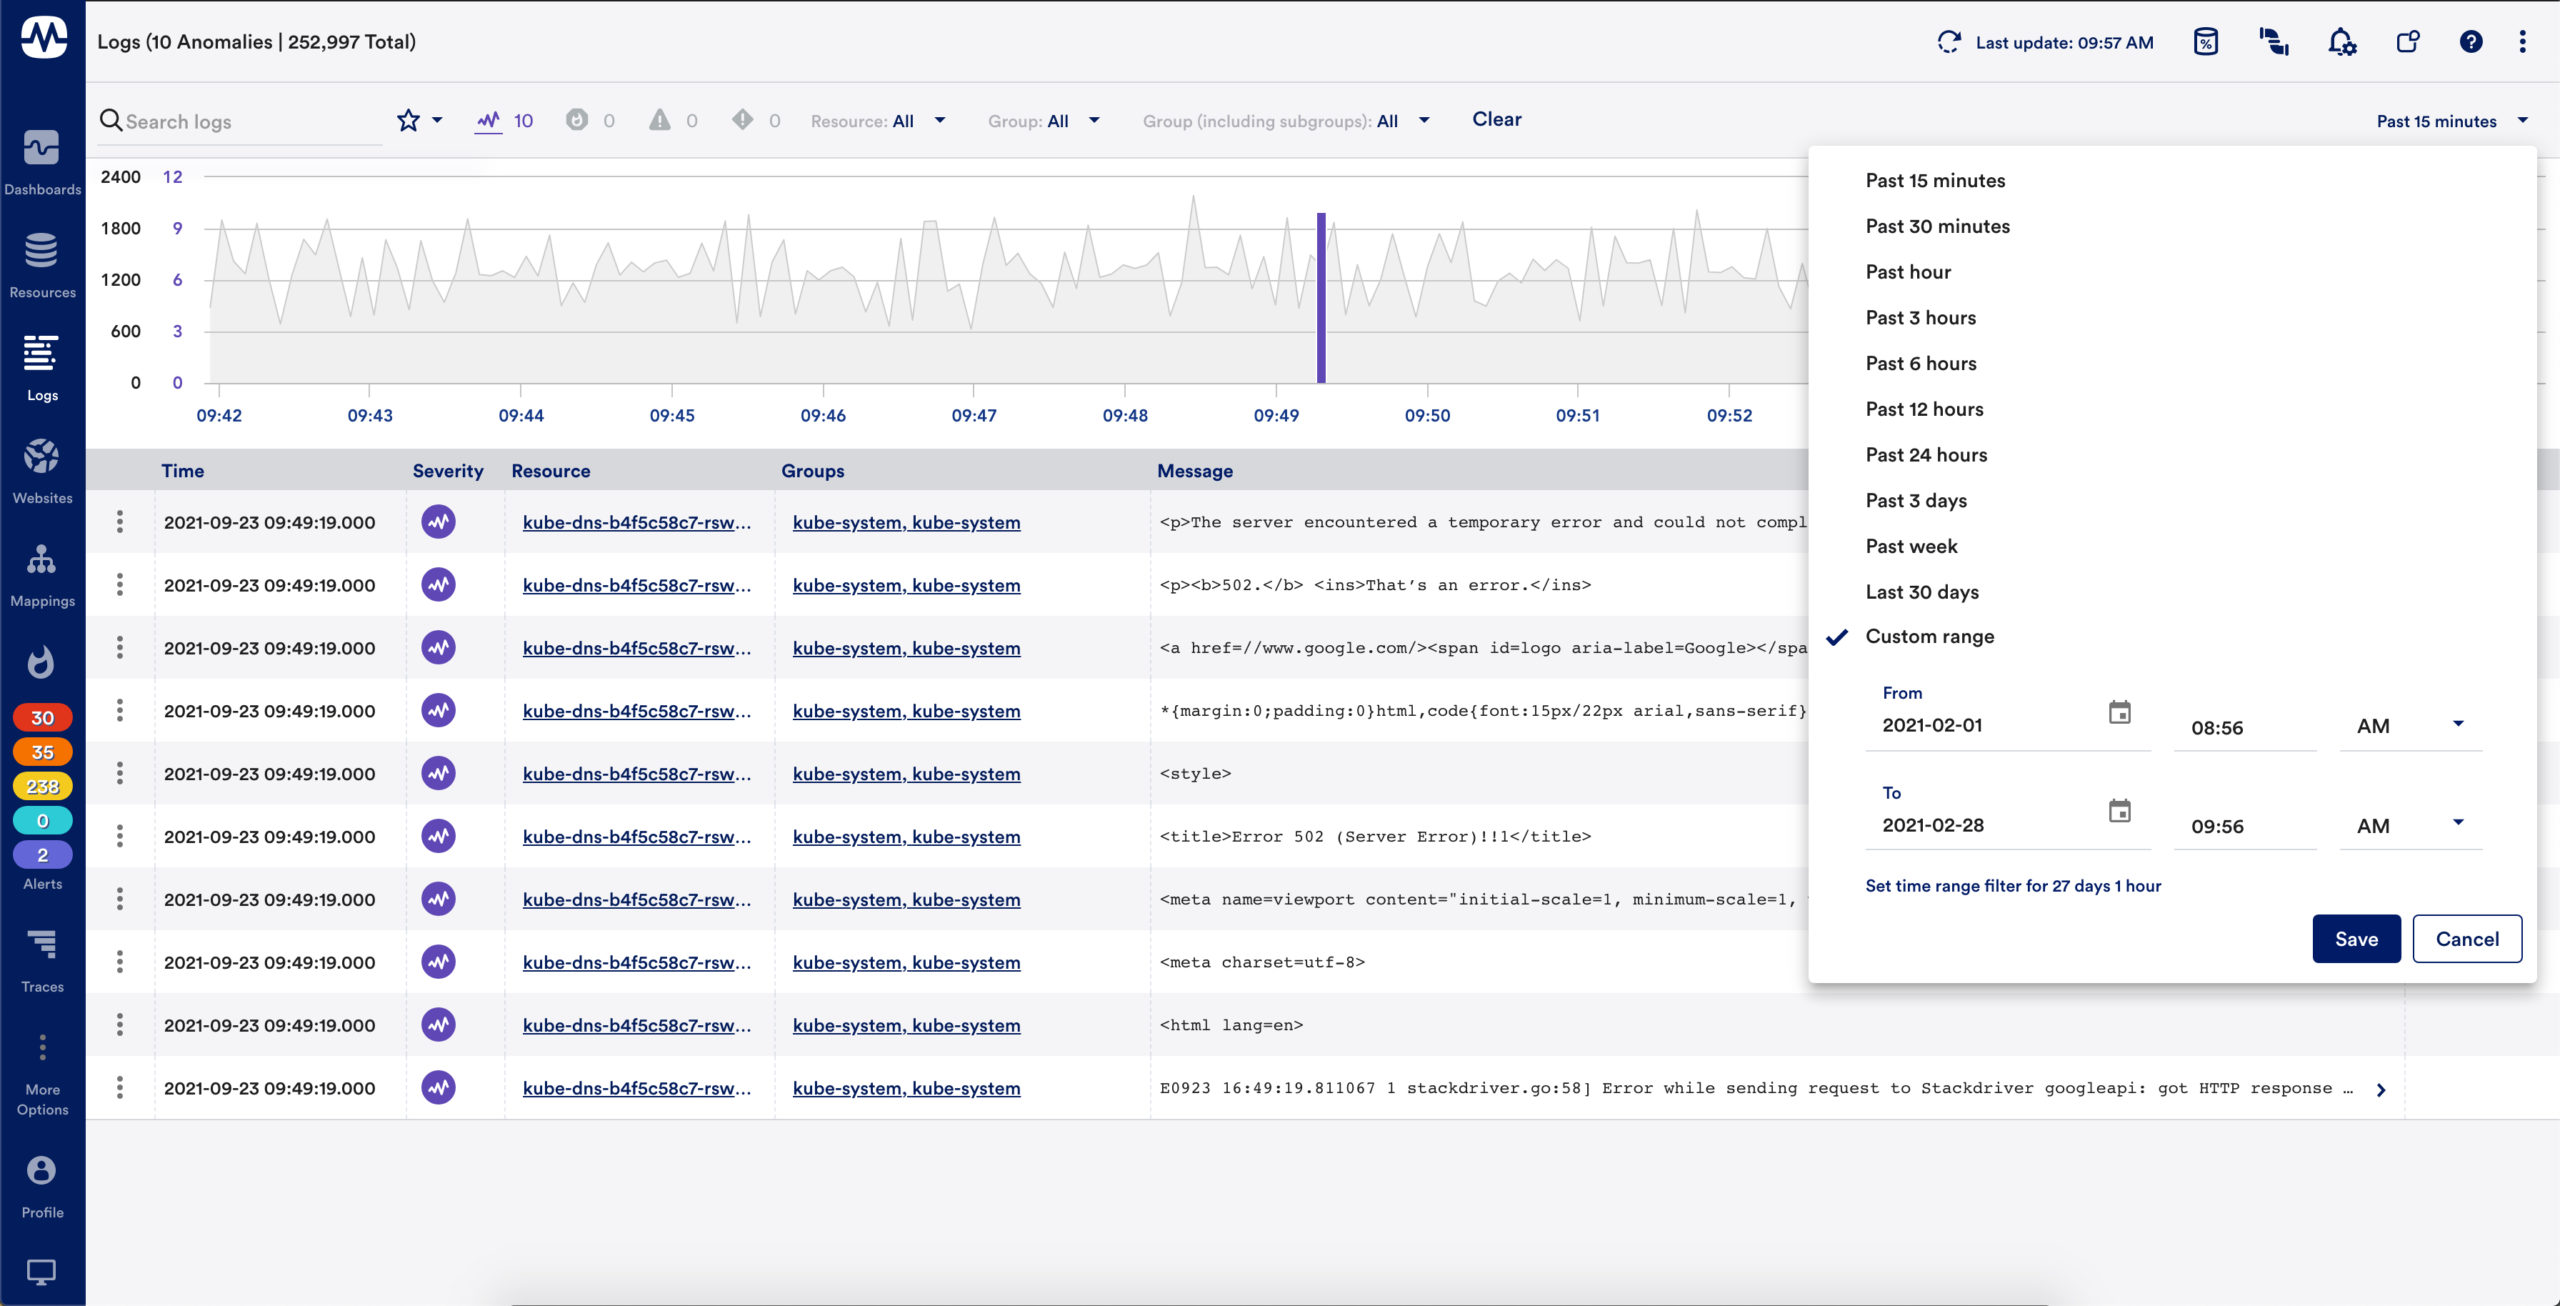
Customizable search & filtering
Supports keyword search, so users can quickly search for log events containing specific keywords, or perform complex queries to get more targeted results
Users can easily filter logs (raw logs & anomalies) based on the resource or resource group they relate to
Users can quickly filter displayed logs based on time range, either by configuring a specific time range or zooming in on specific ranges within the overview graph
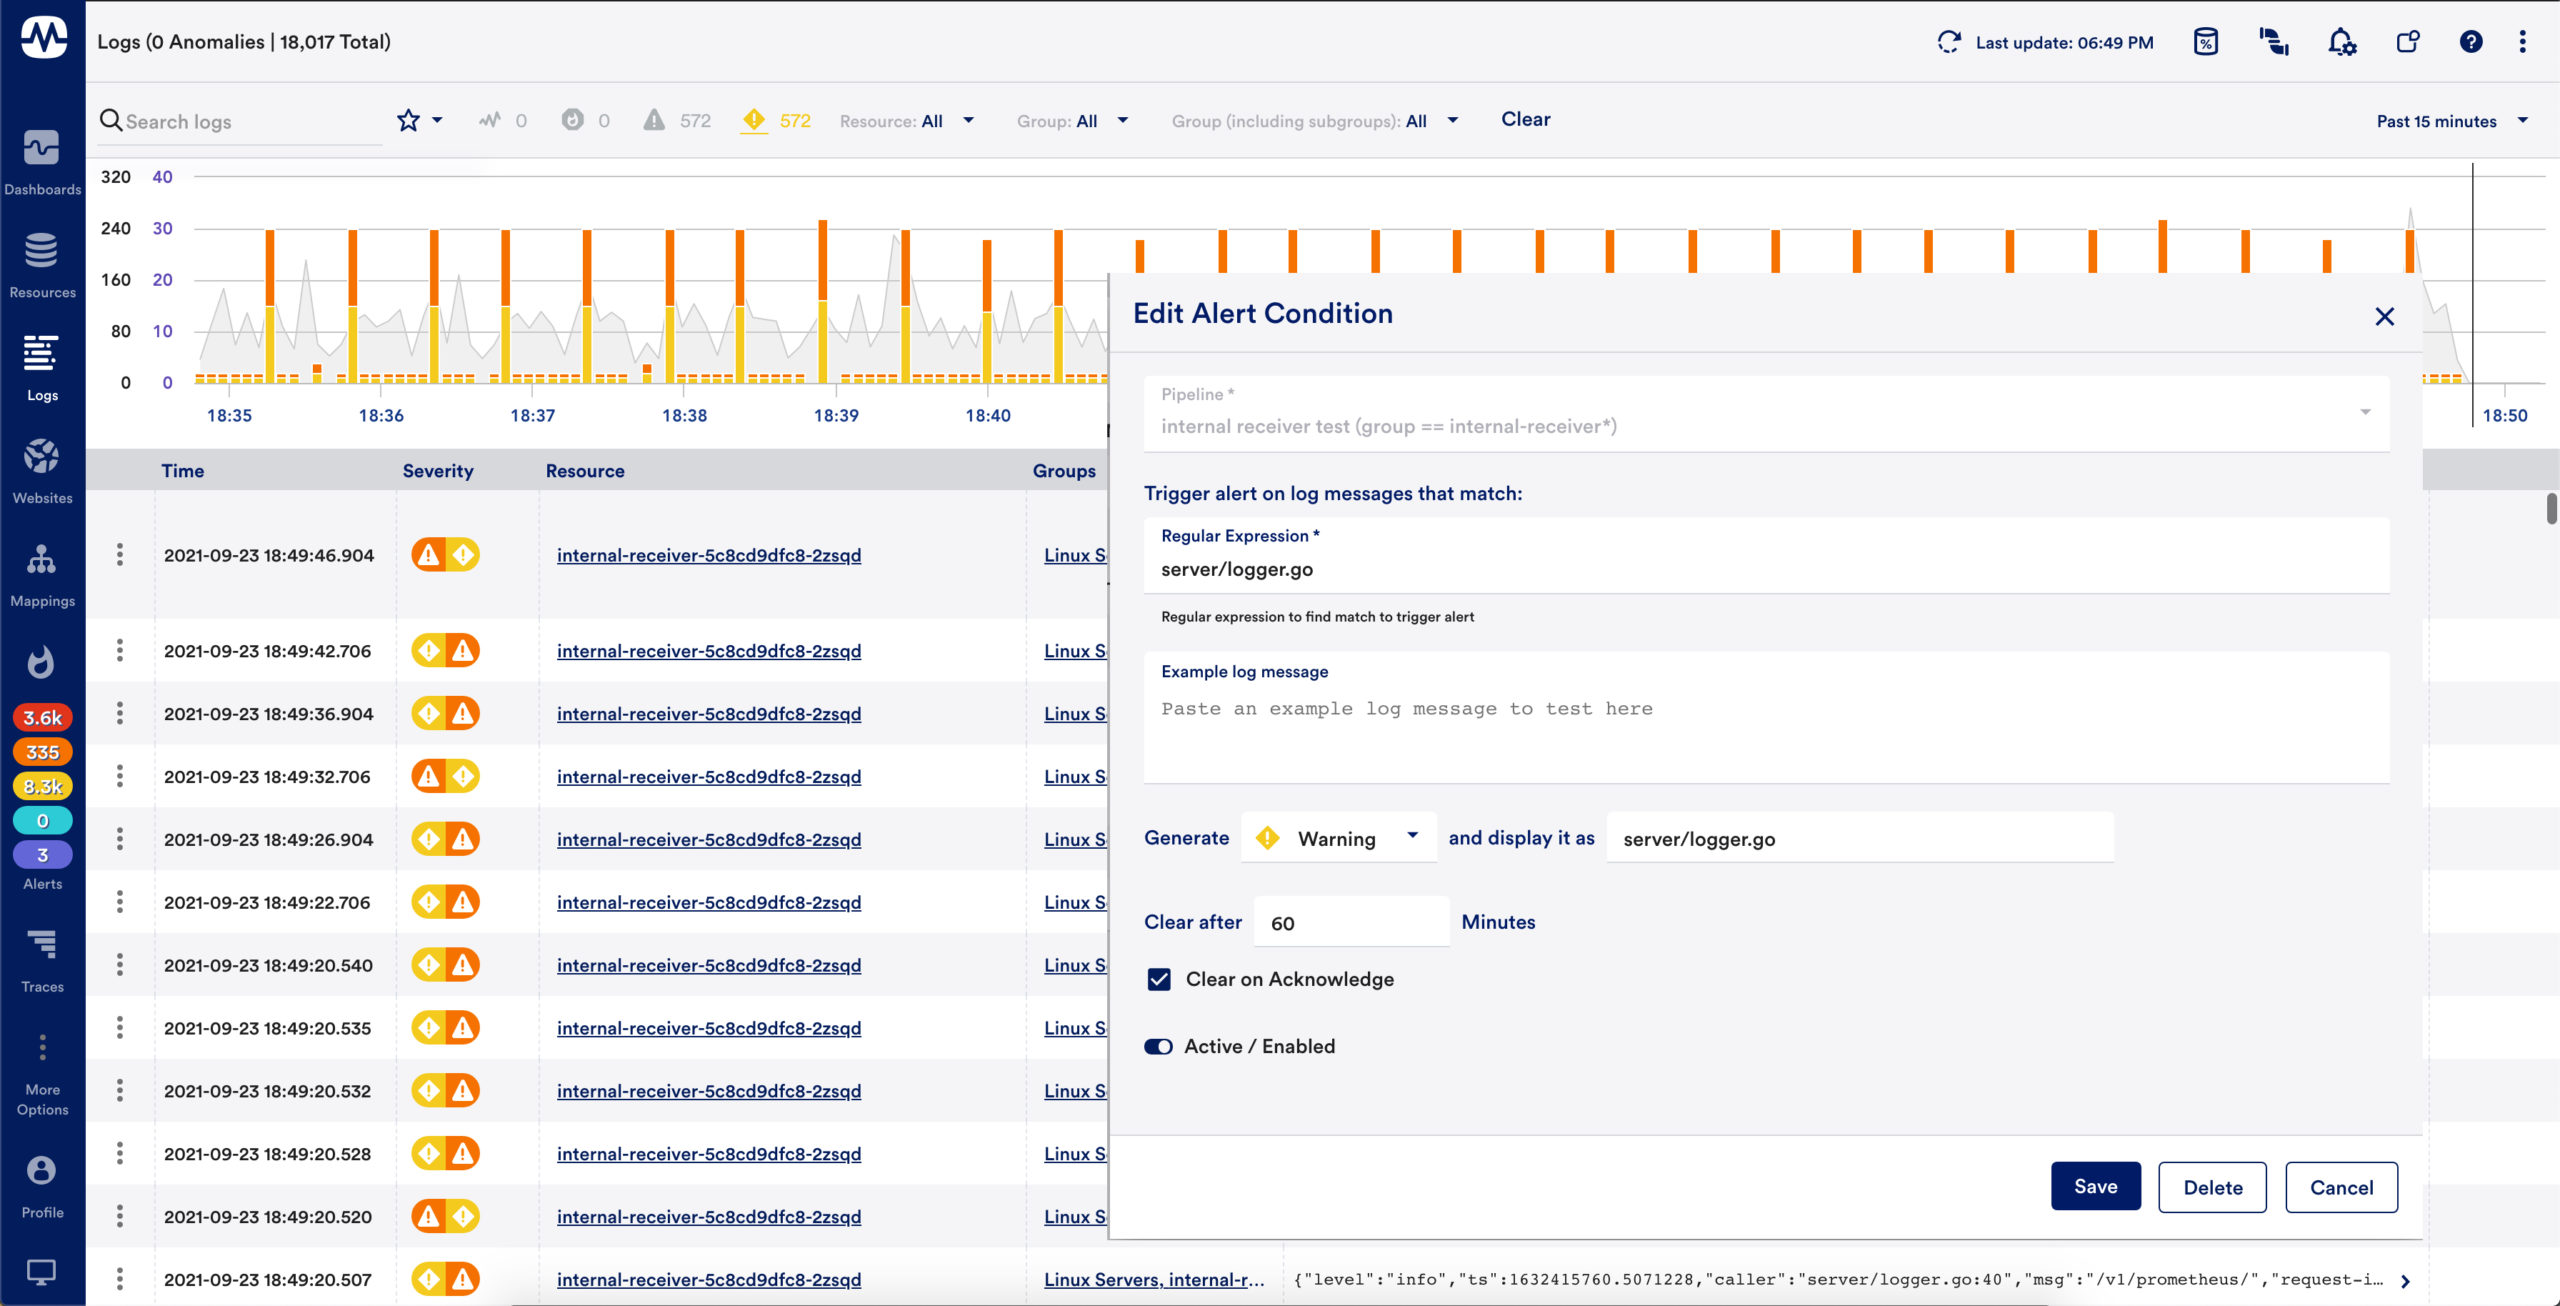
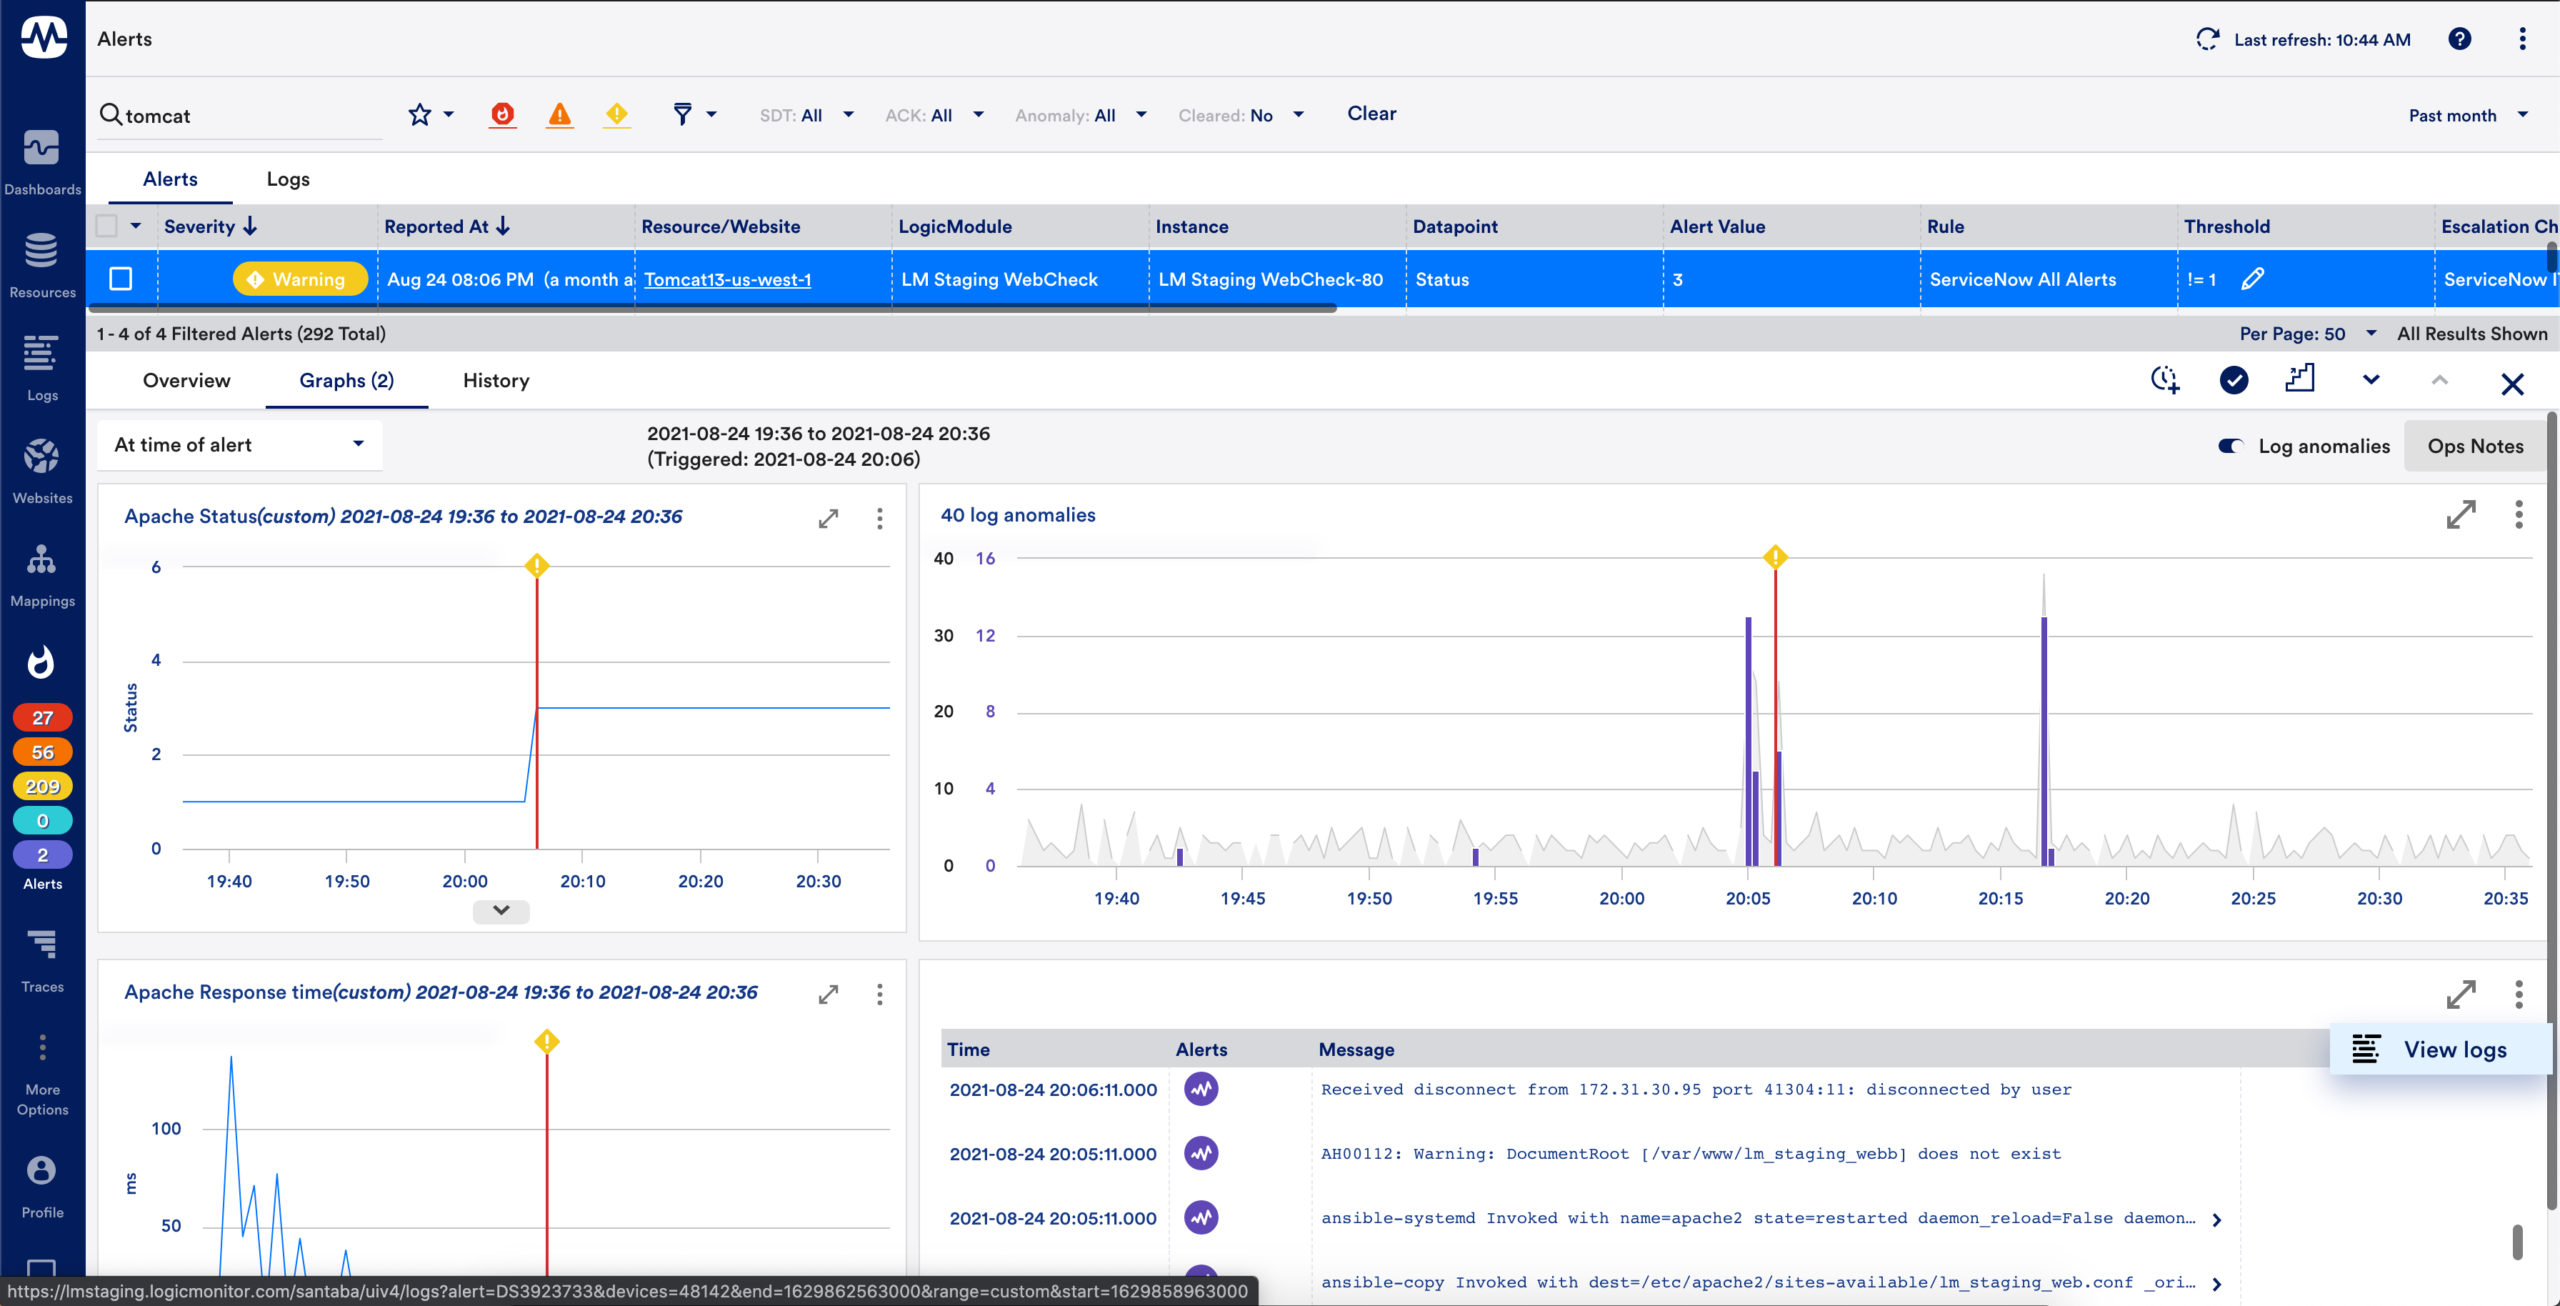
Correlated log alerting
Log alerts are alert conditions based on log events and log pipelines. These alert conditions use regular expression patterns to match ingested logs and trigger LogicMonitor alerts to send you notifications when these log events or anomalies occur
With log alerts, you can speed up your investigation by adding alert conditions to track the logs you always want to know about or creating alerts on a detected anomaly
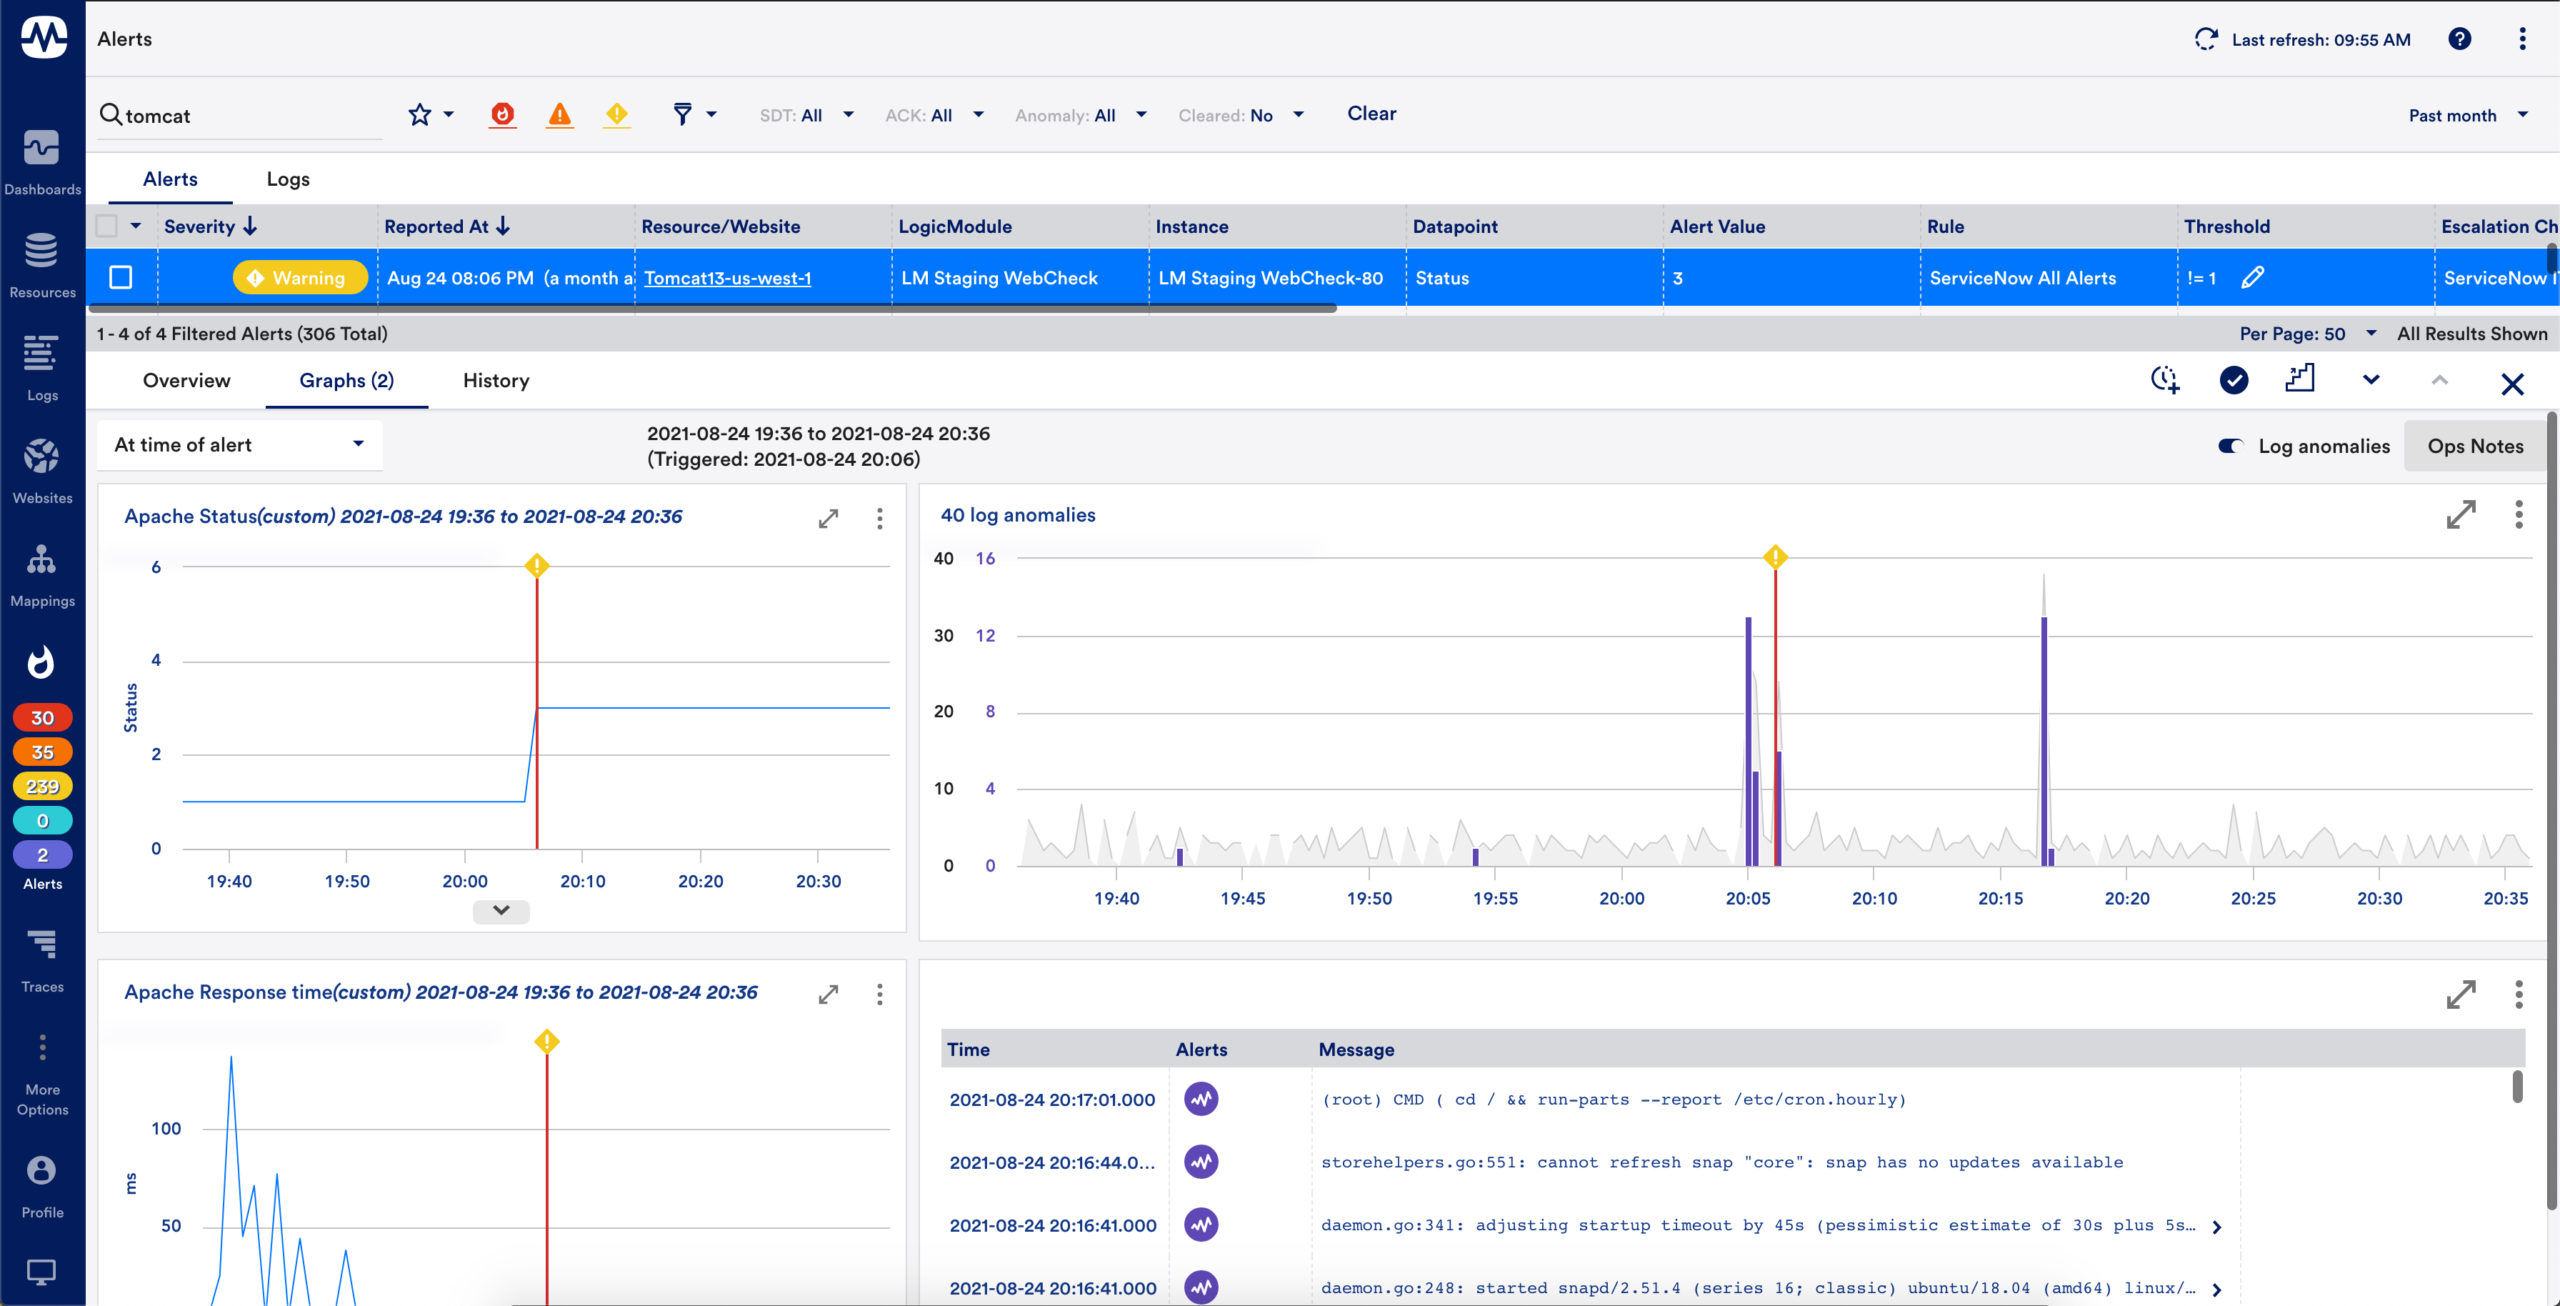
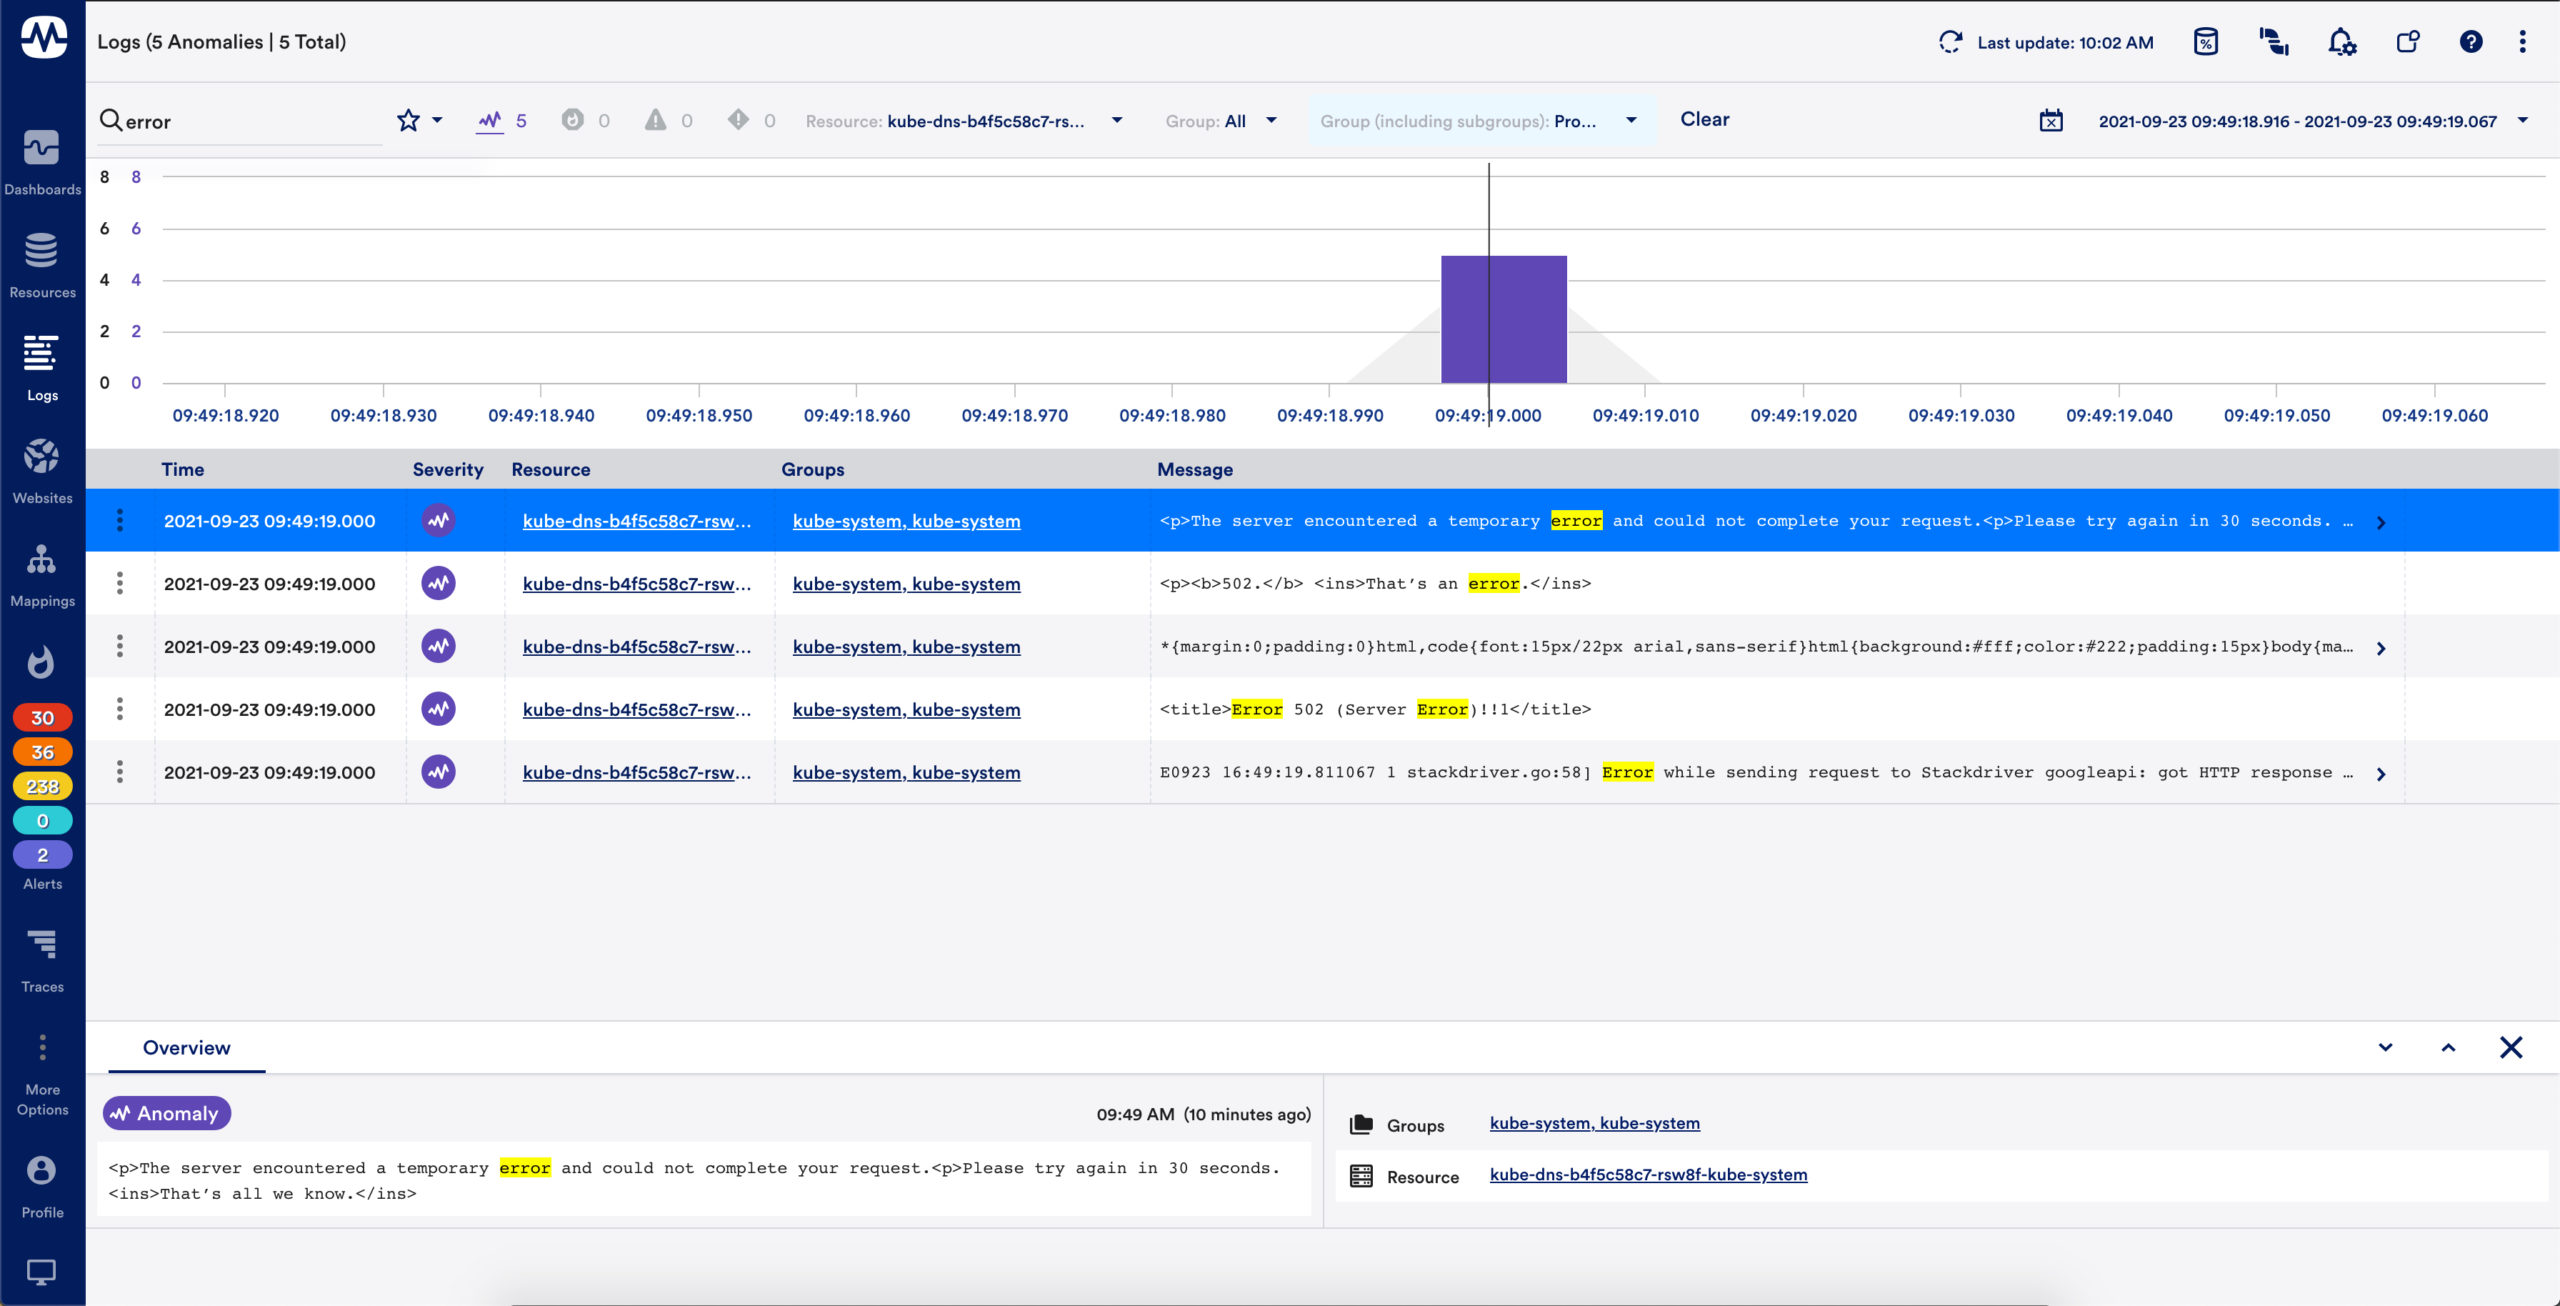
Intelligent log analytics
LM Logs correlates logs with metrics and alerts to troubleshoot critical problems deep inside the applications, infrastructure, and network. The log analytics capability includes:
- Presenting logs contextually with devices, resources, and groups
- Presenting logs contextually with alerts
Tiered retention & hot storage
For customers running critical production and compliance-sensitive environments, LM Logs provides tiered log retention capabilities
LM Logs provides several data retention options (30 days, 1 year, unlimited) to meet any of your data retention needs for internal compliance, risk mitigation and data hygiene
All LM Logs data is available whenever you need it (hot storage) with no need to store the data somewhere else or wait for log re-ingestion
Related Solutions
Accelerate your path to unified observability


LM Logs FAQ
- What is log monitoring?
Log monitoring is the process of collecting and centralizing logs and event information from any of your technologies from on-prem to cloud, infrastructure to applications, to gain insight into what’s going on in your environment. Log data is aggregated over time and retained and accessible for a defined period time.
- How do you monitor logs?
Sending your logs from a variety of sources and technologies via log collectors/aggregators for centralized log collection. Popular log collectors include FluentD and Logstash. Applications can be configured to send logs directly from the code.
- Which logs should be monitored?
Some of the more common log types to monitor include event logs, access and audit logs, and transactional logs. Event logs contain important information about what’s happening in a system and help determine an underlying issue. Access and audit logs keep track of who’s accessing a system and keeping track of their activity. Transactional logs show how systems are interacting with each other, like a web server connecting to a database server.
- What is the difference between logging and monitoring?
Logging generates and records events that occur in your technical environment and keeps them for review. Logging helps explain what is happening at the time the log is created. Monitoring provides information around the data you’ve identified. You can monitor infrastructure performance metrics or you can monitor the number of logs generated by a given device.
- What is tracing monitoring?
Tracing represents the entire application flow and the journey a user takes when accessing the application. Collecting traces from applications will provide better insight into the health performance of the application and how to optimize.
- How are logs maintained and monitored?
Each device, system, or application generate their own logs and are kept locally. User can centralize their logs in a unified space by using a log collector or aggregator, often times to a local logging server or a SaaS-based solution. Once the logs are centralized, users can search through the logs to find the information they need and many solutions provide log alerting capabilities to notify when certain log conditions have been identified.
- What is log analysis?
Log analysis helps make sense of your log data. Systems can generate thousands a logs per day and finding the log that you need can be challenging. When log data is analyzed, log data can provide more insight and context to what’s happening. Log analysis could include analyzing every log for the log severity written in the log and being able to search for the severity that is the target of your investigation.
- Why is logging so important?
Logging provides information about events and transactions taking place in your technical environment. Without logging all events, you may have a difficult time identifying issues or determining the root cause of a problem.
- Log analysis vs APM
Log analysis focuses on collecting and aggregating logs from a variety of sources, making it easier to search across all of your systems. APM focuses on application performance and is used to identify user experience and ways to optimize the application.
- What is log file monitoring?
System events and transactions can be written to local log files for review. The log files can be sent to your logging tool using a log shipper like FluentD or Logstash. Every time new logs are written to the local log file, the new logs will be sent to the logging tool with no concerns about duplicating previous logs.
Related logs resources